
Triangular and Sawtooth Waves: Analytical Tools for Traders

Introduction
When we think of waves, the first image that comes to mind is often a sine wave. They can be used to model and describe oscillations of a wide variety of natures. Including market cycles.
When it comes to wave analysis, Elliott Wave Theory immediately comes to mind. According to this theory, price moves in cycles: first, there is an impulsive movement (rising wave), followed by a correction (falling wave). These movements form a fractal structure, where each larger wave consists of smaller waves. And those, in turn, consist of even smaller ones.
Thus, both sine waves and Elliott waves are two different concepts, but both are related to the idea of periodicity and process repetition. At first glance, it may seem that all these wave theories have long been studied, tested, and that it's impossible to come up with anything new. But this impression is deceptive—it's always possible to build something new on an old foundation. And that's exactly what we'll do now.
Triangular waves
We are all accustomed to waves looking wavy. But waves can have other shapes. I recently read an article about square waves, but triangular waves are something I'm hearing about for the first time. In fact, triangular waves already exist in the MetaTrader terminal, but the company MetaQuotes carefully guards this secret.
Let's take 3 consecutive SMA values with a period of 3 and find their average. We'll get a moving average with the MODE_SMMA averaging method. The calculations will look like this:
![]()
![]()
![]()
![]()
Now, let's look at this problem of 3 indicator bodies from a different perspective. Any linear indicator is simply a set of coefficients. We can perform any arithmetic operations with these coefficients. As an example, let's consider the summation of three SMAs. First, we'll write out the coefficients of each indicator separately, and then we'll add together the coefficients that relate to the same price. As a result, we will get a triangular window function.
| price[0] | price[1] | price[2] | price[3] | price[4] |
|---|---|---|---|---|
| 1 | 1 | 1 | ||
| 1 | 1 | 1 | ||
| 1 | 1 | 1 | ||
| 1 | 2 | 3 | 2 | 1 |
However, a triangular window can also be obtained in a simpler way. First, we need to set the indicator's period. Then its coefficients can be easily calculated using the formula:
![]()
Now we need to normalize these coefficients. First, we need to find the sum of all coefficients. Then, divide each coefficient by the obtained value. Such an indicator will smooth prices, but its difference from SMMA will be very minor.
I will set a more complex and interesting task. Using the coefficients of a triangular window, build an indicator that will react to such price changes.
This indicator will consist of two parts. The first part is the simplest—all its coefficients are equal to 1. The second part is slightly more complex. First, we need to calculate the coefficients of the triangular window. After that, we need to normalize them so that we get an oscillator. To do this, we find the sum of the coefficients:
![]()
After that, we need to recalculate each coefficient using the formula:
![]()
Now, let's see how to apply such an indicator in practice. Let the indicator period be equal to 5. Then, the indicator will consist of 2 arrays of coefficients:
![]()
![]()
Using these coefficients, we need to find 2 weights:
![]()
![]()
Each of these weights is a separate indicator. W0 is the well-known SMA, and W1 is an oscillator based on a triangular window. Using these weights, we can obtain the indicator values:
![]()
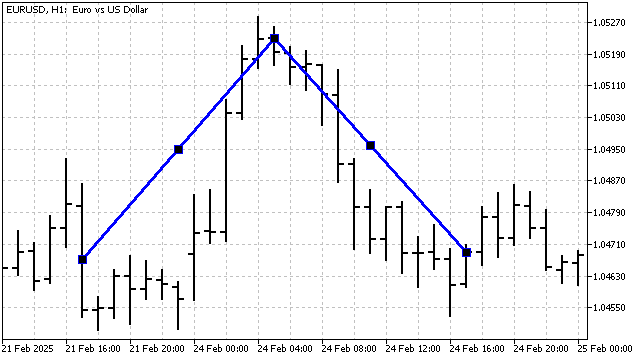
On a chart, it might look like this:
We have achieved our first success. Now, let's try to improve our indicator. For example, let's take an indicator with a period of 24. We already know how to build the main triangular wave. However, two waves with a period of 12 fit into this period. Also, an integer number of cycles will result for waves with periods of 8, 6, 4, and 3. Let's try to add these waves to our indicator. All we need to do is slightly change the coefficient calculation. If the wave period PW fits an integer number of times into the indicator's period, then the coefficient values can be found using the formula:
![]()
Coefficient normalization, weight calculation, and indicator computation remain unchanged.
Of course, the more waves included in the indicator, the better it will smooth prices. However, waves with small periods are more sensitive to noise, and their use may not always be justified. Therefore, let's add the ability to choose the number of waves in the indicator.
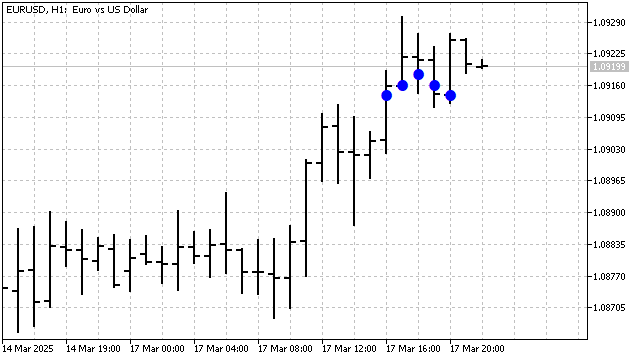
The main advantage of this indicator is price smoothing. It can also detect and highlight wavelike price movements, if any exist.
The main drawback of this indicator is price smoothing. All calculations and the indicator's construction are relative to its center. Consequently, it may have a lag. Let's try to eliminate this drawback.
Sawtooth waves
A trend emerges when price movement in one direction gains an advantage over movement in another direction. For example, upward price movement is larger and more frequent than downward movement. That is, a trend is always a breach of symmetry. Therefore, to isolate a linear trend, we need something asymmetric and linear. A sawtooth wave fits these requirements.
In fact, sawtooth waves already exist in the MetaTrader terminal, but... well, I'm repeating myself. Let's take the LWMA indicator. Its coefficients can be calculated as follows:
![]()
That is, the LWMA indicator is only a single sawtooth. One tooth is not enough for us; we need more teeth. Therefore, we will calculate the coefficients for a sawtooth wave with period PW as follows:
![]()
All other calculations remain the same as with triangular waves.
Sawtooth waves interpret any price movement as a trend. The first wave shows the overall trend. The second wave divides the trend into 2 or 3 parts (depending on the indicator's period). Subsequent waves divide these parts even further. One could say that the indicator constructs trend channels. And the closer the channel lines are to each other, the more pronounced the trend is.
This indicator has an interesting peculiarity. If the number of waves is even, the indicator will smooth the trend, averaging it. With an odd number of waves, the indicator will strive to pinpoint the trend as accurately as possible.
Perfection knows no limits
Let's return to triangular waves. Let the indicator period be equal to 6. It contains 2 triangular waves with a period of 3. The coefficients of these waves will be as follows:
![]()
Depending on how the prices are arranged, these waves will point upward or downward. Let's introduce slight modifications to the coefficient calculation so that both waves become independent of each other. Instead of one coefficient system, we will get two:
![]()
![]()
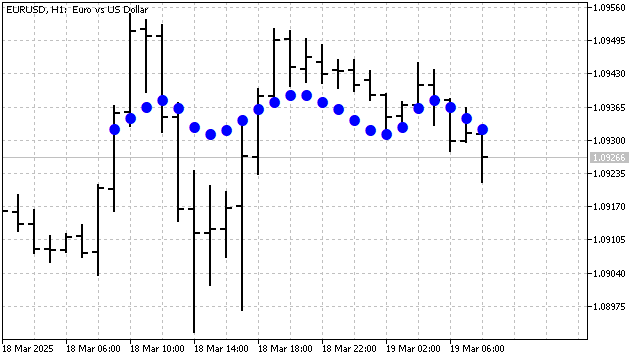
That is, we have separated the two waves in time. Now, the direction and weight of each wave does not depend on the other. Thanks to this separation, the indicator will become more flexible and will track price changes more accurately.
The same separation can be applied to sawtooth waves. In this case, an interesting feature arises: if two adjacent sawtooth waves point in different directions, they form one triangular wave.
Indicators in the form of window functions are extremely rare. And we can redesign the wave indicator so that it is displayed as a line. To do this, we only need to calculate the last value of the indicator. With this approach, a trader won't be able to assess which factors influenced the indicator, but they will be able to see the indicator's movement here and now.
Wave parameter calculation occurs as oscillations around an average value. If we discard this average, we can build an oscillator. This oscillator will sum waves of different periods. The resulting sum will show in which direction and how strongly the waves deviate from the average price value. As a result, we have created 2 new indicators.
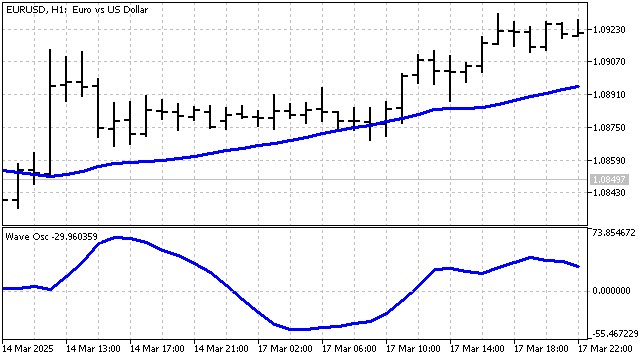
The indicators have acquired a familiar appearance. But they have ceased to display the waves themselves.
Trading strategies
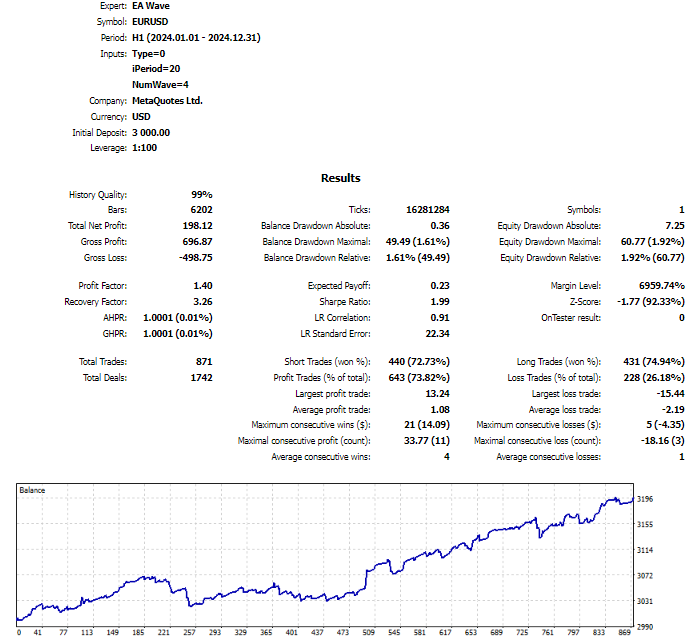
We have built the indicators. Now we need to test their suitability for trading. First, I will use a simple strategy—the crossing of the indicator and the price:
- if the price crosses the indicator line from below upwards, the Expert Advisor will open a buy position and close all sell positions;
- if the price crosses the indicator line from above downwards, the Expert Advisor will open a sell position and close all buy positions.
Despite such a simple approach, the strategy looks quite viable.
Let's slightly modify this strategy. Instead of the price, we will use the readings of another indicator. All other rules remain the same. Using different methods for isolating waves and trends can affect the results.
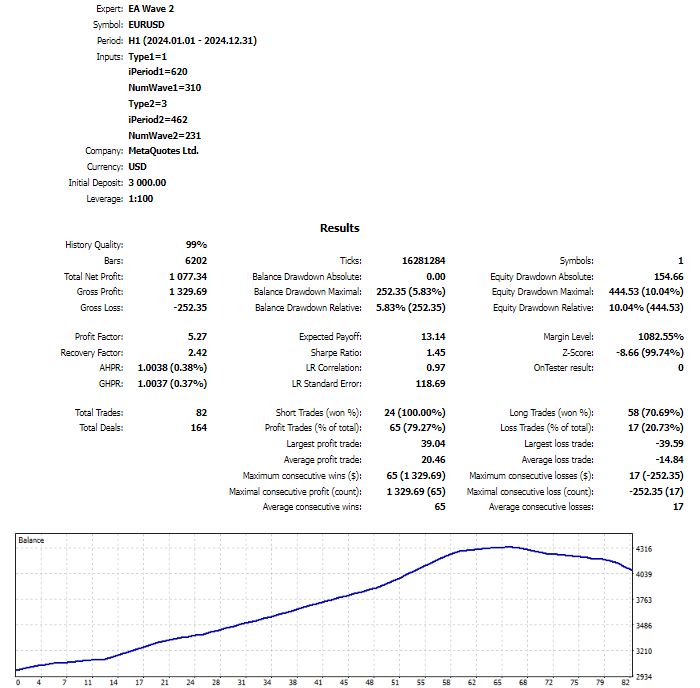
For the next strategy, I will use a feature of window functions: they can rewrite all their values after receiving a new price. For example, it's entirely possible that a crossover of two window functions existed on the previous bar, but disappeared when a new bar opened. Similarly, a crossover might appear not on the current bar, but further back in history.
The Expert Advisor will track the crossover of two indicators across their entire length and generate a signal to open positions regardless of which bar the crossover occurred on. However, with this approach, signals may be delayed. To avoid this, I will add a filter. Signals will be considered valid only if the opening price for the position is better than the previous one. For buy positions, the price must be lower than the previous one; for sell positions, it must be higher. This sounds quite risky, but it's worth trying.
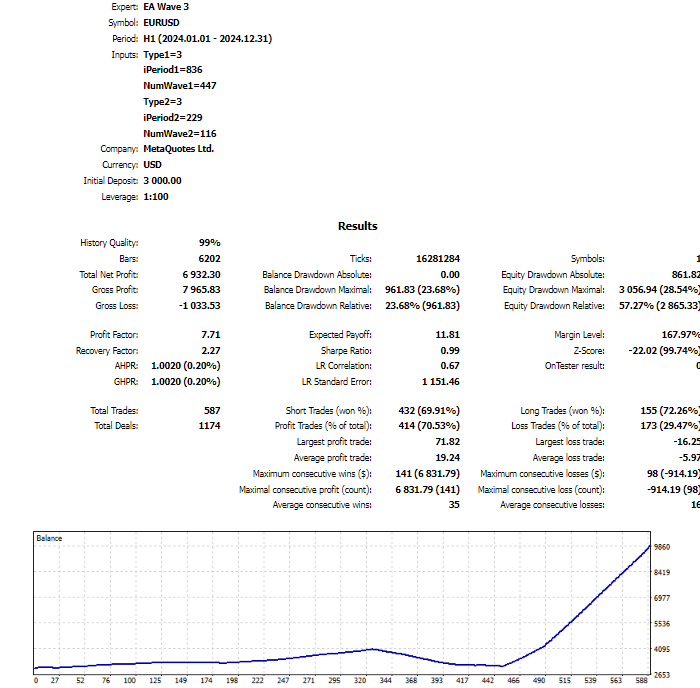
This strategy needs to add another method for closing positions—stop loss, take profit, trailing stop. Then it might yield more stable results.
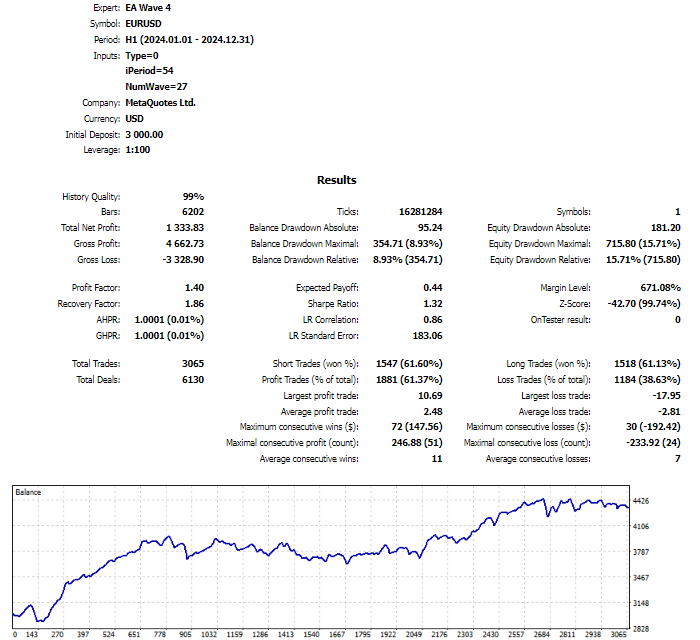
Triangular and sawtooth waves can isolate trends. Based on this feature, I will build a trading strategy with the following rules:
- if the current indicator value is lower than all previous ones, the Expert Advisor will open a buy position;
- if the current indicator value is higher than all previous ones, a sell position will be opened.
The strategy looks simple, but it has potential.
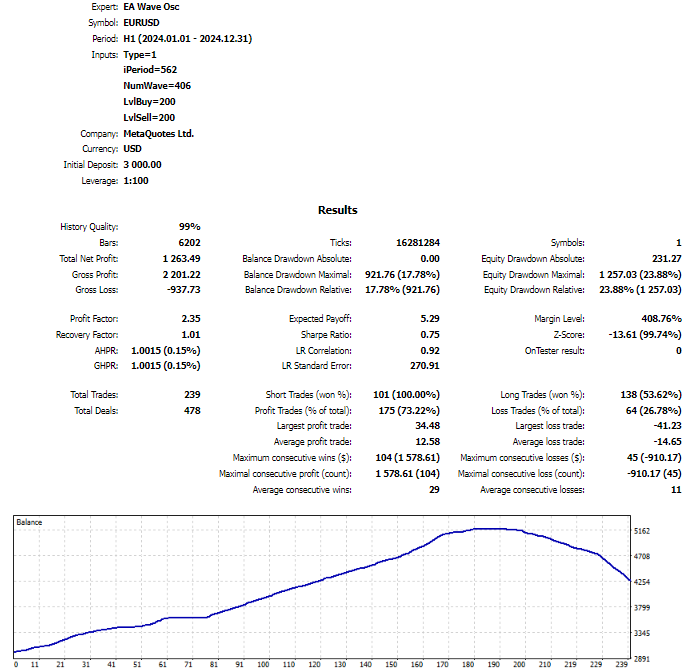
Another strategy can be built on the oscillator. The strategy rules will be based on a return to the mean. Conditions for opening buy positions: the oscillator line has reached a local minimum, and this local minimum is below a set level. For opening sell positions, the rule is: the oscillator line has reached a local maximum, and this maximum is above a set level.
Triangular and sawtooth waves are a useful technical analysis tool. These waves can be used both as the basis for trading strategies and as additional filters. They can help identify potential market entry and exit points. However, they should always be used in conjunction with other analysis methods and sound risk management.
Conclusion
Thus, we have examined various approaches to using triangular and sawtooth waves in trading- from simple price smoothing to constructing complex combinations capable of identifying wave-like movements and trends. Unfortunately, it's impossible to cover all possible applications of these waves in a single article. The topic is too vast, but you can always develop it further. The prospects for studying the features and applications of these waves are quite favorable. Even the simplest strategies based on these waves can be profitable, though they require careful refinement.
The following programs were used in writing the article:
| Name | Type | Features |
|---|---|---|
| Wave | indicator |
The minimum period for triangular waves is 3, for sawtooth waves - 2. The number of waves allows keeping only the low-frequency components of the signal. |
| Wave Lin | indicator | Displays only the very last known value of the waves. |
| Wave Osc | indicator | Calculates and sums only the wave weights. |
| EA Wave | expert advisor | A simple strategy based on the crossover of the indicator line and the price. |
| EA Wave 2 | expert advisor | A strategy based on the crossover of two indicator lines on the last two bars. |
| EA Wave 3 | expert advisor | A strategy based on the crossover of two indicator lines across all bars. |
| EA Wave 4 | expert advisor | A strategy based on the current indicator value reaching a maximum/minimum. |
| EA Wave Osc | expert advisor | A strategy based on the oscillator values. |
Translated from Russian by MetaQuotes Ltd.
Original article: https://www.mql5.com/ru/articles/17595
Warning: All rights to these materials are reserved by MetaQuotes Ltd. Copying or reprinting of these materials in whole or in part is prohibited.
This article was written by a user of the site and reflects their personal views. MetaQuotes Ltd is not responsible for the accuracy of the information presented, nor for any consequences resulting from the use of the solutions, strategies or recommendations described.

- Free trading apps
- Over 8,000 signals for copying
- Economic news for exploring financial markets
You agree to website policy and terms of use