

MQL5交易策略自动化(第二十八部分):构建带可视化反馈的价格行为蝙蝠谐波形态
 37
37
 0
0

引言
在前一篇文章(第二十七部分)中,我们使用MetaQuotes Language 5(MQL5)开发了一套螃蟹形态系统。该系统利用谐波形态,结合精确的斐波那契比率识别高概率反转点位,实现交易自动化,并通过图表对象对形态进行可视化绘制。本文(第二十八部分)将构建蝙蝠形态系统,借助枢轴点以及特定的斐波那契回撤/扩展比例识别看涨和看跌蝙蝠谐波形态。程序会依据计算得出的入场、止损以及多级止盈点位执行交易,并绘制三角形、趋势线与标签,以清晰呈现形态结构。本文将介绍以下内容:
阅读完本文,您将得到一套稳健的MQL5蝙蝠谐波形态交易策略,并可按自己的需要自由定制 —— 现在开始吧!
蝙蝠谐波形态框架解析
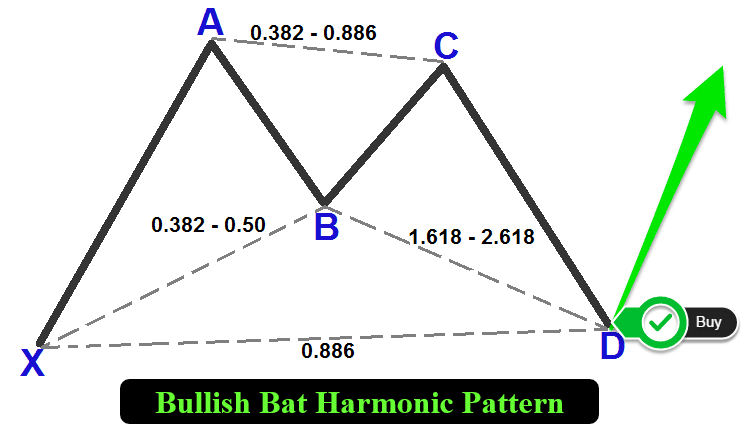
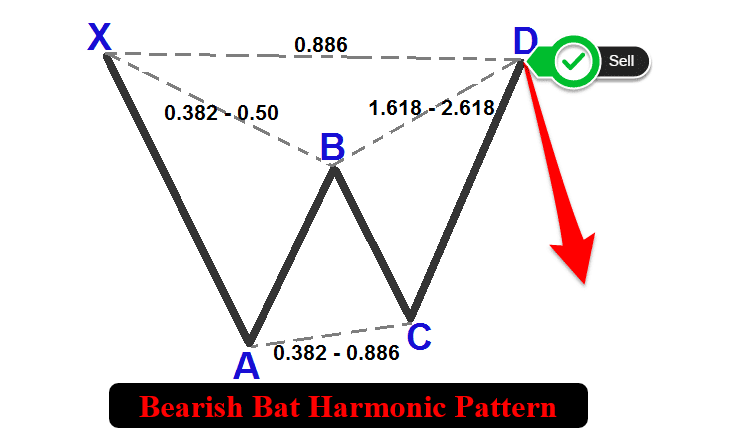
蝙蝠形态是一种谐波交易结构,由五个关键拐点构成:X、A、B、C、D,分为看涨形态与看跌形态两类,借助精确的斐波那契测算,用于识别市场潜在反转行情。看涨蝙蝠形态的走势序列为:低点 — 高点 — 低点 — 高点 — 低点。其中,X点为波段低点,A点为波段高点,B点为波段低点(回撤XA段的约0.5),C点为波段高点(为AB段的0.382至0.886),D点为波段低点(为XA段的0.886,且位置高于X点)。与之相反,看跌蝙蝠形态的走势序列为:高点 — 低点 — 高点 — 低点 — 高点。X点是波段高点,A点是波段低点,B点是波段高点,C点是波段低点,D点是波段高点(为XA段的0.886,且位置低于X点)。两种形态的可视化示意图如下。
看涨蝙蝠谐波形态:
看跌蝙蝠谐波形态:
为识别这些形态,我们将采用以下结构化方法:
- 定义XA段:从X点到A点的初始波段决定形态方向(看涨为向上,看跌为向下),也是斐波那契计算的主要基准。
- 确定AB段:B点应对XA段产生约0.5的回撤,代表初始推动行情的中等幅度修正。
- 分析BC段:该波段为AB段的0.382至0.886倍延伸,形成反向波动,为最终反转区域做铺垫。
- 设定CD段:最后这一波段为XA段的0.886倍延伸,D点即潜在反转点位,形态在此宣告完成,并产生交易信号。
通过应用这套基于几何结构与斐波那契比例的判定标准,我们的交易系统将能够在价格数据中系统地识别有效的蝙蝠形态。一旦形态确认,智能交易系统(EA)会在图表上绘制该形态:用三角形、趋势线以及X、A、B、C、D各点位标签进行展示,同时标注入场与止盈的交易价位。该方案可在D点自动执行交易,使用经过计算的止损位与多级止盈区间,利用该形态预判市场反转的优势来捕捉交易机会。接下来,我们进入代码实现环节!
在MQL5中的实现
要在MQL5中创建该程序,请打开MetaEditor,在导航器中找到“指标”文件夹,点击“新建”选项卡,并按照向导提示创建文件。文件创建完成后,我们首先声明一些将在整个程序中用到的全局变量。
//+------------------------------------------------------------------+
//|                                              Bat Pattern EA.mq5. |
//|                        Copyright 2025, Forex Algo-Trader, Allan. |
//|                                 "https://t.me/Forex_Algo_Trader" |
//+------------------------------------------------------------------+
#property copyright "Forex Algo-Trader, Allan"
#property link      "https://t.me/Forex_Algo_Trader"
#property version   "1.00"
#property description "This EA trades based on Bat Strategy"
#property strict

//--- Include the trading library for order functions
#include <Trade\Trade.mqh>  //--- Include Trade library
CTrade obj_Trade;  //--- Instantiate a obj_Trade object

//--- Input parameters for user configuration
input int    PivotLeft    = 5;      // Number of bars to the left for pivot check
input int    PivotRight   = 5;      // Number of bars to the right for pivot check
input double Tolerance    = 0.10;   // Allowed deviation (10% of XA move)
input double LotSize      = 0.01;   // Lot size for new orders
input bool   AllowTrading = true;   // Enable or disable trading

//---------------------------------------------------------------------------
//--- Bat pattern definition:
//
//--- Bullish Bat:
//---   Pivots (X-A-B-C-D): X swing low, A swing high, B swing low, C swing high, D swing low.
//---   Normally XA > 0; Ideal B = A - 0.5*(A-X); Legs within specified ranges.
//
//--- Bearish Bat:
//---   Pivots (X-A-B-C-D): X swing high, A swing low, B swing high, C swing low, D swing high.
//---   Normally XA > 0; Ideal B = A + 0.5*(X-A); Legs within specified ranges.
//---------------------------------------------------------------------------

//--- Structure for a pivot point
struct Pivot {
   datetime time;   //--- Bar time of the pivot
   double   price;  //--- Pivot price (High for swing high, low for swing low)
   bool     isHigh; //--- True if swing high; false if swing low
};

//--- Global dynamic array for storing pivots in chronological order
Pivot pivots[];     //--- Declare a dynamic array to hold identified pivot points

//--- Global variables to lock in a pattern (avoid trading on repaint)
int      g_patternFormationBar = -1;  //--- Bar index where the pattern was formed (-1 means none)
datetime g_lockedPatternX      = 0;   //--- The key X pivot time for the locked pattern
bool     g_tradeTaken          = false; //--- Flag to indicate if a trade has been taken for the current pattern
为搭建蝙蝠形态交易系统,实现基于蝙蝠谐波形态的自动化交易,首先引入"<Trade\Trade.mqh>"库,并实例化"obj_Trade"作为CTrade对象,用来管理交易操作,例如执行买入或卖出订单。随后定义可供用户自定义的输入参数:"PivotLeft"与"PivotRight"均设置为5根K线,用于指定枢轴点识别的回溯范围;"Tolerance"取值为0.10,代表斐波那契比例的允许偏差;"LotSize"为0.01,即交易手数;将"AllowTrading"设置为true,开启自动交易功能。
接下来定义"Pivot"结构体,包含"time"(日期时间型)、"price"(双精度浮点型)、"isHigh"(布尔型,标记是否为高点),用于存储波段拐点;声明动态数组"pivots"存放这些拐点数据。同时初始化全局变量:将"g_patternFormationBar"赋值为- 1,用于追踪形态形成的K线;将"g_lockedPatternX"赋值为0,锁定X枢轴点的时间;将"g_tradeTaken"设置为false,防止同一形态重复开仓。至此,EA识别蝙蝠形态并执行交易的基础部分就搭建完毕。可视化部分,我们先编写几个辅助函数,用于绘制线段、文字标签和三角形。
//+------------------------------------------------------------------+
//| Helper: Draw a filled triangle                                   |
//+------------------------------------------------------------------+
void DrawTriangle(string name, datetime t1, double p1, datetime t2, double p2, datetime t3, double p3, color cl, int width, bool fill, bool back) {
   //--- Attempt to create a triangle object with three coordinate points
   if(ObjectCreate(0, name, OBJ_TRIANGLE, 0, t1, p1, t2, p2, t3, p3)) {
      //--- Set the triangle's color
      ObjectSetInteger(0, name, OBJPROP_COLOR, cl);
      //--- Set the triangle's line style to solid
      ObjectSetInteger(0, name, OBJPROP_STYLE, STYLE_SOLID);
      //--- Set the line width of the triangle
      ObjectSetInteger(0, name, OBJPROP_WIDTH, width);
      //--- Determine if the triangle should be filled
      ObjectSetInteger(0, name, OBJPROP_FILL, fill);
      //--- Set whether the object is drawn in the background
      ObjectSetInteger(0, name, OBJPROP_BACK, back);
   }
}

//+------------------------------------------------------------------+
//| Helper: Draw a trend line                                        |
//+------------------------------------------------------------------+
void DrawTrendLine(string name, datetime t1, double p1, datetime t2, double p2, color cl, int width, int style) {
   //--- Create a trend line object connecting two points
   if(ObjectCreate(0, name, OBJ_TREND, 0, t1, p1, t2, p2)) {
      //--- Set the trend line's color
      ObjectSetInteger(0, name, OBJPROP_COLOR, cl);
      //--- Set the trend line's style (solid, dotted, etc.)
      ObjectSetInteger(0, name, OBJPROP_STYLE, style);
      //--- Set the width of the trend line
      ObjectSetInteger(0, name, OBJPROP_WIDTH, width);
   }
}

//+------------------------------------------------------------------+
//| Helper: Draw a dotted trend line                                 |
//+------------------------------------------------------------------+
void DrawDottedLine(string name, datetime t1, double p, datetime t2, color lineColor) {
   //--- Create a horizontal trend line at a fixed price level with dotted style
   if(ObjectCreate(0, name, OBJ_TREND, 0, t1, p, t2, p)) {
      //--- Set the dotted line's color
      ObjectSetInteger(0, name, OBJPROP_COLOR, lineColor);
      //--- Set the line style to dotted
      ObjectSetInteger(0, name, OBJPROP_STYLE, STYLE_DOT);
      //--- Set the line width to 1
      ObjectSetInteger(0, name, OBJPROP_WIDTH, 1);
   }
}

//+------------------------------------------------------------------+
//| Helper: Draw anchored text label (for pivots)                    |
//| If isHigh is true, anchor at the bottom (label appears above);   |
//| if false, anchor at the top (label appears below).               |
//+------------------------------------------------------------------+
void DrawTextEx(string name, string text, datetime t, double p, color cl, int fontsize, bool isHigh) {
   //--- Create a text label object at the specified time and price
   if(ObjectCreate(0, name, OBJ_TEXT, 0, t, p)) {
      //--- Set the text of the label
      ObjectSetString(0, name, OBJPROP_TEXT, text);
      //--- Set the color of the text
      ObjectSetInteger(0, name, OBJPROP_COLOR, cl);
      //--- Set the font size for the text
      ObjectSetInteger(0, name, OBJPROP_FONTSIZE, fontsize);
      //--- Set the font type and style
      ObjectSetString(0, name, OBJPROP_FONT, "Arial Bold");
      //--- Anchor the text depending on whether it's a swing high or low
      if(isHigh)
         ObjectSetInteger(0, name, OBJPROP_ANCHOR, ANCHOR_BOTTOM);
      else
         ObjectSetInteger(0, name, OBJPROP_ANCHOR, ANCHOR_TOP);
      //--- Center-align the text
      ObjectSetInteger(0, name, OBJPROP_ALIGN, ALIGN_CENTER);
   }
}
为在图表上清晰绘制形态及其关键价位,我们编写"DrawTriangle"函数:该函数调用ObjectCreate创建填充三角形对象(OBJ_TRIANGLE),三角形的三个顶点分别由三组时间("t1"、"t2"、"t3")与价格("p1", "p2", "p3")坐标确定。通过ObjectSetInteger函数设置属性:OBJPROP_COLOR为指定颜色、将"OBJPROP_STYLE"设置为"STYLE_SOLID"(实线样式)、"OBJPROP_WIDTH"代表线条宽度、用"OBJPROP_FILL"控制是否开启填充,"OBJPROP_BACK"用于设置图形置于图表背景还是前景。接着我们实现"DrawTrendLine"函数,采用和三角形相同的参数格式,在两点之间绘制趋势线对象("OBJ_TREND")。
接下来,我们实现"DrawDottedLine"函数,用于创建水平虚线,并以同样的方式定义它的各项属性。最后编写"DrawTextEx"函数:在坐标("t","p")位置创建文本标签对象(OBJ_TEXT)。借助ObjectSetString和"ObjectSetInteger"设置属性:"OBJPROP_TEXT"代表指定文字、"OBJPROP_COLOR"代表文字颜色、"OBJPROP_FONTSIZE"代表字体大小,OBJPROP_FONT设置为"Arial Bold"(Arial粗体)。通过"OBJPROP_ANCHOR"属性,依据"isHigh"参数选择锚点位置 —— 波段高点时文字锚定在价格上方,波段低点则锚定在价格下方;并使用"OBJPROP_ALIGN"属性设置文字居中对齐。至此我们可以继续推进OnTick事件处理器,开始寻找后续形态识别所需的枢轴点。以下是实现这一逻辑的方法:
//+------------------------------------------------------------------+
//| Expert tick function                                             |
//+------------------------------------------------------------------+
void OnTick() {
   //--- Declare a static variable to store the time of the last processed bar
   static datetime lastBarTime = 0;
   //--- Get the time of the current confirmed bar
   datetime currentBarTime = iTime(_Symbol, _Period, 1);
   //--- If the current bar time is the same as the last processed, exit
   if(currentBarTime == lastBarTime)
      return;
   //--- Update the last processed bar time
   lastBarTime = currentBarTime;

   //--- Clear the pivot array for fresh analysis
   ArrayResize(pivots, 0);
   //--- Get the total number of bars available on the chart
   int barsCount = Bars(_Symbol, _Period);
   //--- Define the starting index for pivot detection (ensuring enough left bars)
   int start = PivotLeft;
   //--- Define the ending index for pivot detection (ensuring enough right bars)
   int end = barsCount - PivotRight;

   //--- Loop through bars from 'end-1' down to 'start' to find pivot points
   for(int i = end - 1; i >= start; i--) {
      //--- Assume current bar is both a potential swing high and swing low
      bool isPivotHigh = true;
      bool isPivotLow = true;
      //--- Get the high and low of the current bar
      double currentHigh = iHigh(_Symbol, _Period, i);
      double currentLow = iLow(_Symbol, _Period, i);
      //--- Loop through the window of bars around the current bar
      for(int j = i - PivotLeft; j <= i + PivotRight; j++) {
         //--- Skip if the index is out of bounds
         if(j < 0 || j >= barsCount)
            continue;
         //--- Skip comparing the bar with itself
         if(j == i)
            continue;
         //--- If any bar in the window has a higher high, it's not a swing high
         if(iHigh(_Symbol, _Period, j) > currentHigh)
            isPivotHigh = false;
         //--- If any bar in the window has a lower low, it's not a swing low
         if(iLow(_Symbol, _Period, j) < currentLow)
            isPivotLow = false;
      }
      //--- If the current bar qualifies as either a swing high or swing low
      if(isPivotHigh || isPivotLow) {
         //--- Create a new pivot structure
         Pivot p;
         //--- Set the pivot's time
         p.time = iTime(_Symbol, _Period, i);
         //--- Set the pivot's price depending on whether it is a high or low
         p.price = isPivotHigh ? currentHigh : currentLow;
         //--- Set the pivot type (true for swing high, false for swing low)
         p.isHigh = isPivotHigh;
         //--- Get the current size of the pivots array
         int size = ArraySize(pivots);
         //--- Increase the size of the pivots array by one
         ArrayResize(pivots, size + 1);
         //--- Add the new pivot to the array
         pivots[size] = p;
      }
   }
}
接下来实现OnTick事件处理器的初始逻辑,用于系统检测波段枢轴点,而枢轴点是识别蝙蝠谐波形态必不可少的要素。首先声明静态变量"lastBarTime"并初始化为0,用来记录上一根已处理K线的时间。从iTime函数获取当前品种、当前周期下偏移量为1的K线时间,赋值给"currentBarTime";如果时间未发生变化则直接退出,避免重复运算。当检测到新K线生成时,更新"lastBarTime"。随后,我们调用ArrayResize清空"pivots"数组,保证每一轮都是全新的分析。
接下来,我们调用Bars函数获取K线总数量;设置枢轴点检测范围:起始位置"start"为"PivotLeft",结束位置"end"等于K线总数减去"PivotRight",并从"end - 1"到"start"遍历每一根K线。对每一根K线,先预设它可能是波段高点(将"isPivotHigh"设置为true),也可能是波段低点(将"isPivotLow"设置为true)。通过iHigh与iLow获取该K线的最高价、最低价,再利用"iHigh"、"iLow"校验该K线左右"PivotLeft"、"PivotRight"范围内的相邻K线。如果任意一根相邻K线创出更高高点或更低低点,则判定该点不是有效枢轴点。最后,如果该K线满足枢轴点判定条件,就创建一个"Pivot"结构体:用"iTime"赋值"time"成员,根据是否为波段高点,将"price"设为最高价或最低价,并设置"isHigh"标记。之后调用ArrayResize扩容数组,把该枢轴点追加存入"pivots"数组。打印此数组时,我们会得到如下结果:
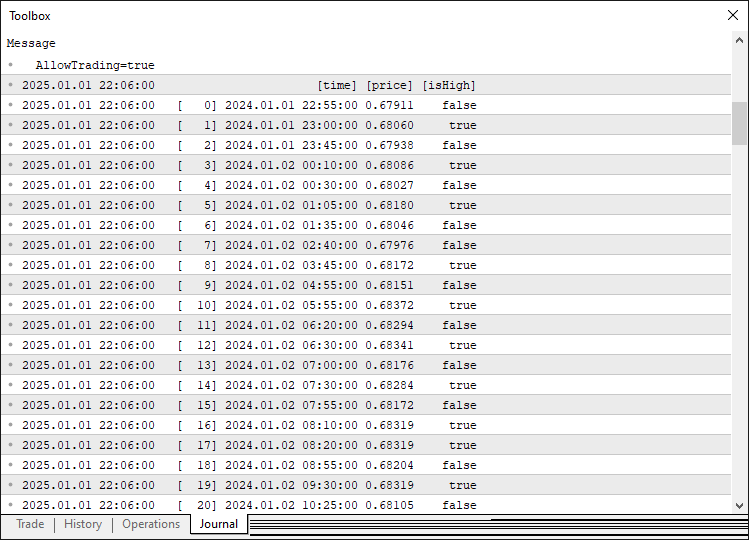
基于这些数据,我们可提取出转折点信息,当有效拐点数量足够时,即可开始形态的分析与识别。以下是实现该功能的完整逻辑:
//--- Determine the total number of pivots found
int pivotCount = ArraySize(pivots);
//--- If fewer than five pivots are found, the pattern cannot be formed
if(pivotCount < 5) {
   //--- Reset pattern lock variables
   g_patternFormationBar = -1;
   g_lockedPatternX = 0;
   g_tradeTaken = false;
   //--- Exit the OnTick function
   return;
}

//--- Extract the last five pivots as X, A, B, C, and D
Pivot X = pivots[pivotCount - 5];
Pivot A = pivots[pivotCount - 4];
Pivot B = pivots[pivotCount - 3];
Pivot C = pivots[pivotCount - 2];
Pivot D = pivots[pivotCount - 1];

//--- Initialize a flag to indicate if a valid Bat pattern is found
bool patternFound = false;
//--- Check for the high-low-high-low-high (Bearish reversal) structure
if(X.isHigh && (!A.isHigh) && B.isHigh && (!C.isHigh) && D.isHigh) {
   //--- Calculate the difference between pivot X and A
   double diff = X.price - A.price;
   //--- Ensure the difference is positive
   if(diff > 0) {
      //--- Calculate the ideal position for pivot B based on Fibonacci ratio
      double idealB = A.price + 0.5 * diff;
      //--- Check if actual B is within tolerance of the ideal position
      if(MathAbs(B.price - idealB) <= Tolerance * diff) {
         //--- Calculate the AB leg length
         double AB = B.price - A.price;
         //--- Calculate the BC leg length
         double BC = B.price - C.price;
         //--- Verify that BC is within the acceptable Fibonacci range
         if((BC >= 0.382 * AB) && (BC <= 0.886 * AB)) {
            //--- Calculate the extension
            double extension = D.price - A.price;
            //--- Verify that the extension is within tolerance of 0.886 and that D is below X
            if(MathAbs(extension - 0.886 * diff) <= Tolerance * diff && (D.price < X.price))
               patternFound = true;
         }
      }
   }
}
//--- Check for the low-high-low-high-low (Bullish reversal) structure
if((!X.isHigh) && A.isHigh && (!B.isHigh) && C.isHigh && (!D.isHigh)) {
   //--- Calculate the difference between pivot A and X
   double diff = A.price - X.price;
   //--- Ensure the difference is positive
   if(diff > 0) {
      //--- Calculate the ideal position for pivot B based on Fibonacci ratio
      double idealB = A.price - 0.5 * diff;
      //--- Check if actual B is within tolerance of the ideal position
      if(MathAbs(B.price - idealB) <= Tolerance * diff) {
         //--- Calculate the AB leg length
         double AB = A.price - B.price;
         //--- Calculate the BC leg length
         double BC = C.price - B.price;
         //--- Verify that BC is within the acceptable Fibonacci range
         if((BC >= 0.382 * AB) && (BC <= 0.886 * AB)) {
            //--- Calculate the extension
            double extension = A.price - D.price;
            //--- Verify that the extension is within tolerance of 0.886 and that D is above X
            if(MathAbs(extension - 0.886 * diff) <= Tolerance * diff && (D.price > X.price))
               patternFound = true;
         }
      }
   }
}
这里,我们继续依据严格的斐波那契判定条件识别看涨与看跌蝙蝠形态。首先调用"ArraySize(pivots)"获取枢轴点总数并赋值给"pivotCount"。如果枢轴点数量不足5个则直接退出逻辑,同时分别将"g_patternFormationBar"、"g_lockedPatternX"、"g_tradeTaken"重置为- 1、0和false。蝙蝠形态必须包含X、A、B、C和D五个拐点,缺一不可。然后从"pivots"数组提取最新的5个枢轴点,依次赋值给"X"(最早的拐点)、"A"、"B"、"C"和"D"(最新拐点),以此构成形态结构。
下一步,我们检测看跌蝙蝠形态(X为高点,A为低点,B为高点,C为低点,D为高点):计算XA波段价差"X.price - A.price",确保该值大于0;B点理论目标价位为"A.price + 0.5 * diff",使用MathAbs函数校验B点实际价位与理论值的偏差不超过"Tolerance * diff";接着校验BC波段(BC长度为AB波段的0.382至0.886倍);同时校验AD扩展位(AD为XA波段的0.886倍,且D点价格低于X点)。全部条件满足时,将"patternFound"设置为true。之后,我们检测看涨蝙蝠形态(X为低点,A为高点,B为低点,C为高点,D为低点):XA波段价差为"A.price - X.price",保证价差大于0;校验B点处于XA的0.5回撤位,BC波段落在AB的0.382至0.886倍区间,AD扩展位等于XA的0.886 倍且D点高于X点。条件全部成立则将"patternFound"设置为true。通过这套逻辑精准识别蝙蝠形态,用于后续图表可视化与交易执行。一旦检测到有效形态,我们就可以在图表上绘制出来。
//--- If a valid Bat pattern is detected
if(patternFound) {
   //--- Print a message indicating the pattern type and detection time
   Print(patternType, " Bat pattern detected at ", TimeToString(D.time, TIME_DATE|TIME_MINUTES|TIME_SECONDS));

   //--- Create a unique prefix for all graphical objects related to this pattern
   string signalPrefix = "BAT_" + IntegerToString(X.time);

   //--- Choose triangle color based on the pattern type
   color triangleColor = (patternType=="Bullish") ? clrBlue : clrRed;

   //--- Draw the first triangle connecting pivots X, A, and B
   DrawTriangle(signalPrefix+"_Triangle1", X.time, X.price, A.time, A.price, B.time, B.price,
                triangleColor, 2, true, true);
   //--- Draw the second triangle connecting pivots B, C, and D
   DrawTriangle(signalPrefix+"_Triangle2", B.time, B.price, C.time, C.price, D.time, D.price,
                triangleColor, 2, true, true);
}
首先,如果检测到有效形态("patternFound"为true),先将"patternType"初始化为空字符串:如果D点价格低于X点价格,则设置为"Bearish"(代表卖出信号);如果D点价格高于X点价格,则设为"Bullish"(代表买入信号)。接着调用Print函数输出日志,打印形态类型,并用TimeToString函数格式化D枢轴点的时间,输出包含日期、分钟、秒。然后拼接生成唯一标识"signalPrefix":字符串"BAT_"加上通过IntegerToString转为字符串的"X.time"。最后,我们设置"triangleColor":看涨形态为蓝色,看跌形态为红色。调用两次"DrawTriangle"函数:第一次绘制X、A和B三点构成的XAB三角形;第二次绘制B、C和D三点构成的BCD三角形。传入参数"signalPrefix"分别拼接后缀"_Triangle1"和"_Triangle2"、对应枢轴点的时间与价格、三角形颜色、线条宽度2;同时传入true标识开启填充与背景显示。该逻辑确保清晰地可视化蝙蝠形态结构,辅助交易决策。以下是输出结果:
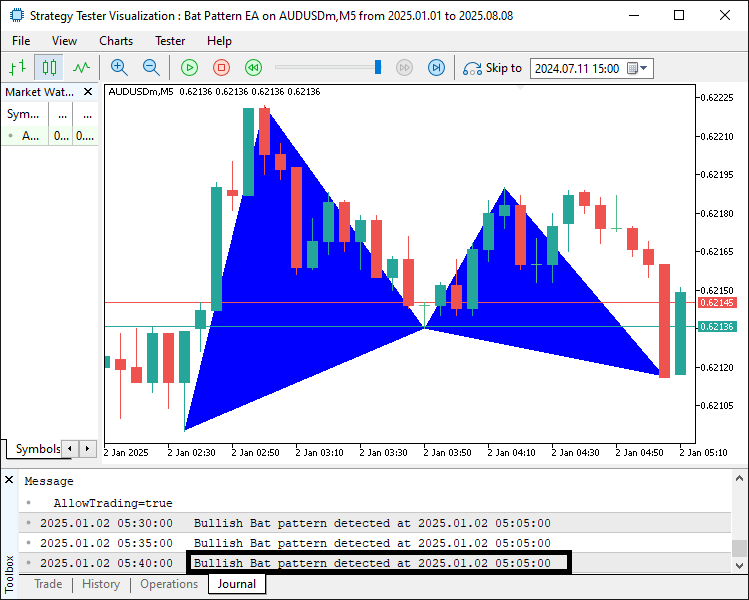
由图可见,程序能够正确定位并绘制识别到的形态。现在,我们继续绘制趋势线,让形态在区间内完整呈现,并添加文字标签,方便快速识别各个价位。
//--- Draw boundary trend lines connecting the pivots for clarity
DrawTrendLine(signalPrefix+"_TL_XA", X.time, X.price, A.time, A.price, clrBlack, 2, STYLE_SOLID);
DrawTrendLine(signalPrefix+"_TL_AB", A.time, A.price, B.time, B.price, clrBlack, 2, STYLE_SOLID);
DrawTrendLine(signalPrefix+"_TL_BC", B.time, B.price, C.time, C.price, clrBlack, 2, STYLE_SOLID);
DrawTrendLine(signalPrefix+"_TL_CD", C.time, C.price, D.time, D.price, clrBlack, 2, STYLE_SOLID);
DrawTrendLine(signalPrefix+"_TL_XB", X.time, X.price, B.time, B.price, clrBlack, 2, STYLE_SOLID);
DrawTrendLine(signalPrefix+"_TL_BD", B.time, B.price, D.time, D.price, clrBlack, 2, STYLE_SOLID);

//--- Retrieve the symbol's point size to calculate offsets for text positioning
double point = SymbolInfoDouble(_Symbol, SYMBOL_POINT);
//--- Calculate an offset (15 points) for positioning text above or below pivots
double offset = 15 * point;

//--- Determine the Y coordinate for each pivot label based on its type
double textY_X = (X.isHigh ? X.price + offset : X.price - offset);
double textY_A = (A.isHigh ? A.price + offset : A.price - offset);
double textY_B = (B.isHigh ? B.price + offset : B.price - offset);
double textY_C = (C.isHigh ? C.price + offset : C.price - offset);
double textY_D = (D.isHigh ? D.price + offset : D.price - offset);

//--- Draw text labels for each pivot with appropriate anchoring
DrawTextEx(signalPrefix+"_Text_X", "X", X.time, textY_X, clrBlack, 11, X.isHigh);
DrawTextEx(signalPrefix+"_Text_A", "A", A.time, textY_A, clrBlack, 11, A.isHigh);
DrawTextEx(signalPrefix+"_Text_B", "B", B.time, textY_B, clrBlack, 11, B.isHigh);
DrawTextEx(signalPrefix+"_Text_C", "C", C.time, textY_C, clrBlack, 11, C.isHigh);
DrawTextEx(signalPrefix+"_Text_D", "D", D.time, textY_D, clrBlack, 11, D.isHigh);

//--- Calculate the central label's time as the midpoint between pivots X and B
datetime centralTime = (X.time + B.time) / 2;
//--- Set the central label's price at pivot D's price
double centralPrice = D.price;
//--- Create the central text label indicating the pattern type
if(ObjectCreate(0, signalPrefix+"_Text_Center", OBJ_TEXT, 0, centralTime, centralPrice)) {
   ObjectSetString(0, signalPrefix+"_Text_Center", OBJPROP_TEXT,
      (patternType=="Bullish") ? "Bullish Bat" : "Bearish Bat");
   ObjectSetInteger(0, signalPrefix+"_Text_Center", OBJPROP_COLOR, clrBlack);
   ObjectSetInteger(0, signalPrefix+"_Text_Center", OBJPROP_FONTSIZE, 11);
   ObjectSetString(0, signalPrefix+"_Text_Center", OBJPROP_FONT, "Arial Bold");
   ObjectSetInteger(0, signalPrefix+"_Text_Center", OBJPROP_ALIGN, ALIGN_CENTER);
}
为使形态展示效果更加直观,我们添加更多图表对象来描绘形态结构。首先调用"DrawTrendLine"函数绘制六条实线趋势线,使用唯一的"signalPrefix"作为对象名称前缀,依次连接关键枢轴点:XA、AB、BC、CD、XB和BD。每条线传入对应枢轴点的时间与价格(如"X.time"、"X.price"),通过ObjectSetInteger设置OBJPROP_COLOR为黑色"clrBlack"、"OBJPROP_WIDTH"线条宽度为 2、"OBJPROP_STYLE"为"STYLE_SOLID"(实线样式),勾勒出形态各个波段。然后调用"SymbolInfoDouble(_Symbol, SYMBOL_POINT)"获取当前品种的点值,计算15点的偏移量用于标签定位。根据每个枢轴点是否为波段高点("isHigh"为true),对价格加上或减去该偏移量,得到各个点位的Y坐标("textY_X"、"textY_A"、"textY_B"、"textY_C"、"textY_D"),实现高点标签放在价格上方、低点标签放在价格下方。您可以根据个人的美观偏好及交易品种自行调整该偏移值。
接下来,我们使用"DrawTextEx"函数为 X、A、B、C和D各个枢轴点添加文本标签。通过"signalPrefix"搭配后缀如"_Text_X"作为对象名,显示对应的点位字母;标签放置在枢轴点时间与调整后的 Y 坐标位置,文字颜色为黑色"clrBlack"、字号11,并依据枢轴点的"isHigh"属性设置锚点。最后计算中心标签位置:"centralTime"取"X.time"与"B.time"的中点,"centralPrice"使用"D.price"。调用ObjectCreate创建文本对象,对象名称为"signalPrefix + '_Text_Center'";根据"patternType"将"OBJPROP_TEXT"文本内容设置为看涨蝙蝠形态或看跌蝙蝠形态。再通过ObjectSetString与"ObjectSetInteger"函数配置属性:将"OBJPROP_COLOR"设置为"clrBlack"、"OBJPROP_FONTSIZE"设置为11、OBJPROP_FONT设置为"Arial Bold"、"OBJPROP_ALIGN"为"ALIGN_CENTER"。这套逻辑可以在图表上完整直观地展示形态结构与形态类型。运行程序后,呈现效果如下:
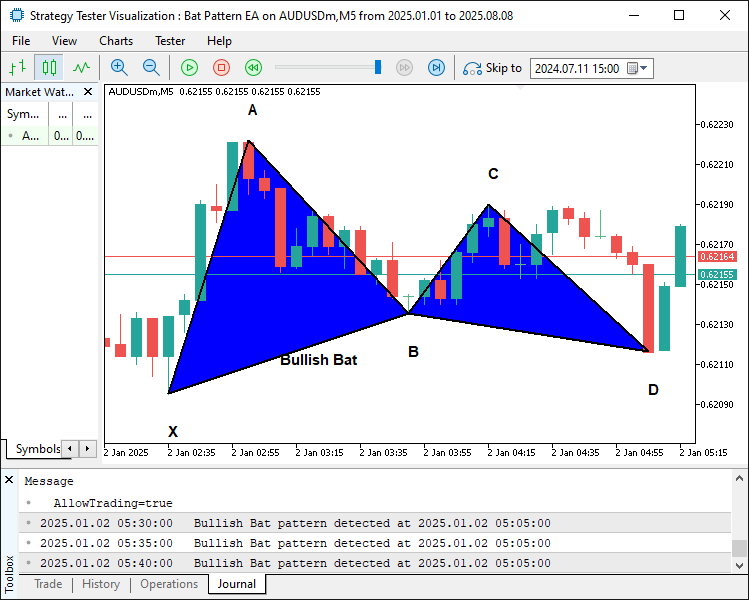
由图可见,我们已经为形态绘制好轮廓线与点位标签,使形态信息更加完整、直观,也更便于解读。接下来,我们需要计算该形态对应的交易价位。
//--- Define start and end times for drawing horizontal dotted lines for obj_Trade levels
datetime lineStart = D.time;
datetime lineEnd = D.time + PeriodSeconds(_Period)*2;

//--- Declare variables for entry price and take profit levels
double entryPriceLevel, TP1Level, TP2Level, TP3Level, tradeDiff;
//--- Calculate obj_Trade levels based on whether the pattern is Bullish or Bearish
if(patternType=="Bullish") { //--- Bullish → BUY signal
   //--- Use the current ASK price as the entry
   entryPriceLevel = SymbolInfoDouble(_Symbol, SYMBOL_ASK);
   //--- Set TP3 at pivot C's price
   TP3Level = C.price;
   //--- Calculate the total distance to be covered by the obj_Trade
   tradeDiff = TP3Level - entryPriceLevel;
   //--- Set TP1 at one-third of the total move
   TP1Level = entryPriceLevel + tradeDiff/3;
   //--- Set TP2 at two-thirds of the total move
   TP2Level = entryPriceLevel + 2*tradeDiff/3;
} else { //--- Bearish → SELL signal
   //--- Use the current BID price as the entry
   entryPriceLevel = SymbolInfoDouble(_Symbol, SYMBOL_BID);
   //--- Set TP3 at pivot C's price
   TP3Level = C.price;
   //--- Calculate the total distance to be covered by the obj_Trade
   tradeDiff = entryPriceLevel - TP3Level;
   //--- Set TP1 at one-third of the total move
   TP1Level = entryPriceLevel - tradeDiff/3;
   //--- Set TP2 at two-thirds of the total move
   TP2Level = entryPriceLevel - 2*tradeDiff/3;
}

//--- Draw dotted horizontal lines to represent the entry and TP levels
DrawDottedLine(signalPrefix+"_EntryLine", lineStart, entryPriceLevel, lineEnd, clrMagenta);
DrawDottedLine(signalPrefix+"_TP1Line", lineStart, TP1Level, lineEnd, clrForestGreen);
DrawDottedLine(signalPrefix+"_TP2Line", lineStart, TP2Level, lineEnd, clrGreen);
DrawDottedLine(signalPrefix+"_TP3Line", lineStart, TP3Level, lineEnd, clrDarkGreen);

//--- Define a label time coordinate positioned just to the right of the dotted lines
datetime labelTime = lineEnd + PeriodSeconds(_Period)/2;

//--- Construct the entry label text with the price
string entryLabel = (patternType=="Bullish") ? "BUY (" : "SELL (";
entryLabel += DoubleToString(entryPriceLevel, _Digits) + ")";
//--- Draw the entry label on the chart
DrawTextEx(signalPrefix+"_EntryLabel", entryLabel, labelTime, entryPriceLevel, clrMagenta, 11, true);

//--- Construct and draw the TP1 label
string tp1Label = "TP1 (" + DoubleToString(TP1Level, _Digits) + ")";
DrawTextEx(signalPrefix+"_TP1Label", tp1Label, labelTime, TP1Level, clrForestGreen, 11, true);

//--- Construct and draw the TP2 label
string tp2Label = "TP2 (" + DoubleToString(TP2Level, _Digits) + ")";
DrawTextEx(signalPrefix+"_TP2Label", tp2Label, labelTime, TP2Level, clrGreen, 11, true);

//--- Construct and draw the TP3 label
string tp3Label = "TP3 (" + DoubleToString(TP3Level, _Digits) + ")";
DrawTextEx(signalPrefix+"_TP3Label", tp3Label, labelTime, TP3Level, clrDarkGreen, 11, true);
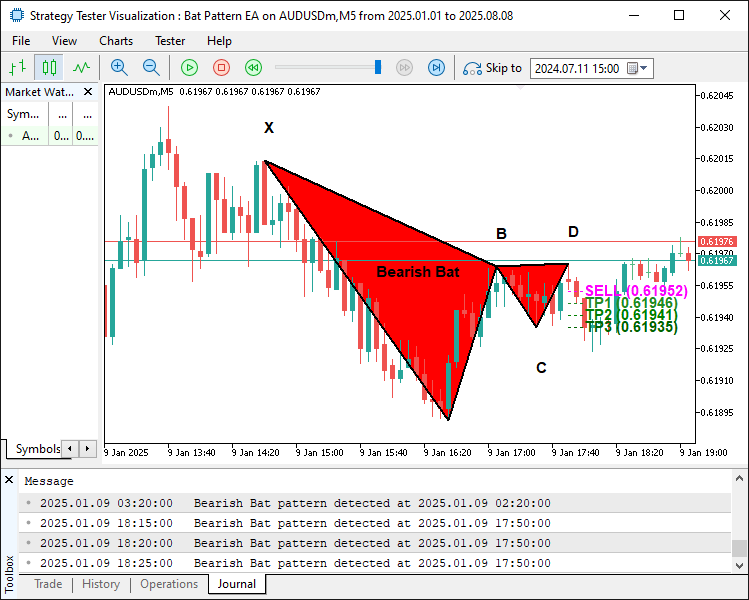
为给识别出的形态定义并可视化交易价位,首先设置"lineStart"为D枢轴点的时间("D.time"),"lineEnd"为向后两个周期,通过"PeriodSeconds(_Period) * 2"计算得到;同时声明"entryPriceLevel"、"TP1Level"、"TP2Level"、"TP3Level"以及"tradeDiff"变量,用于计算交易价位。随后,如果是看涨形态("patternType为'Bullish'"):使用SymbolInfoDouble获取当前ask价作为"entryPriceLevel" ,将"TP3Level"设置为C枢轴点价格,"tradeDiff"等于"TP3Level - entryPriceLevel"。TP1Level与TP2Level则分别在入场价基础上加上价差的1/3和2/3;如果是看跌形态:使用当前bid价作为入场价,"TP3Level"同样取C点价格,"tradeDiff"等于"entryPriceLevel - TP3Level","TP1Level"和"TP2Level"分别通过从入场价减去价差的1/3和2/3得到。
接下来调用"DrawDottedLine"绘制四条水平虚线:品红色的"entryPriceLevel"入场价位线,以及分别位于"TP1Level"(森林绿)、"TP2Level"(绿色)、"TP3Level"(深绿色)的止盈线;所有线条的时间范围均从"lineStart"延伸至"lineEnd"。最后,我们将"labelTime"设置为"lineEnd"再加上半个周期。通过DoubleToString函数把价格转为字符串,生成标签文本(例如入场位标注 “BUY (价格)” 或 “SELL (价格)”,还有 “TP1 (价格)” 等)。调用"DrawTextEx",在"labelTime"位置绘制这些标签,使用对应颜色、字号为11,并将文字锚定在价位线上方。编译后,呈现如下效果:
看跌形态:
看涨形态:
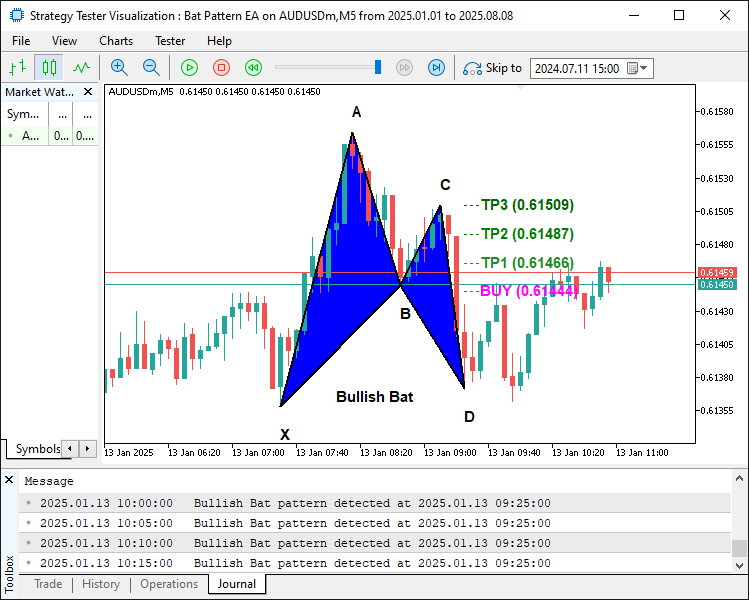
由图可见,我们已经正确绘制好了各项交易价位。现在只剩最后一步 —— 实际开仓,至此整个流程就完成了。
//--- Retrieve the index of the current bar
int currentBarIndex = Bars(_Symbol, _Period) - 1;
//--- If no pattern has been previously locked, lock the current pattern formation
if(g_patternFormationBar == -1) {
   g_patternFormationBar = currentBarIndex;
   g_lockedPatternX = X.time;
   //--- Print a message that the pattern is detected and waiting for confirmation
   Print("Pattern detected on bar ", currentBarIndex, ". Waiting for confirmation on next bar.");
   return;
}
//--- If still on the same formation bar, the pattern is considered to be repainting
if(currentBarIndex == g_patternFormationBar) {
   Print("Pattern is repainting; still on locked formation bar ", currentBarIndex, ". No obj_Trade yet.");
   return;
}
//--- If we are on a new bar compared to the locked formation
if(currentBarIndex > g_patternFormationBar) {
   //--- Check if the locked pattern still corresponds to the same X pivot
   if(g_lockedPatternX == X.time) {
      Print("Confirmed pattern (locked on bar ", g_patternFormationBar, "). Opening obj_Trade on bar ", currentBarIndex, ".");
      //--- Update the pattern formation bar to the current bar
      g_patternFormationBar = currentBarIndex;
      //--- Only proceed with trading if allowed and if there is no existing position
      if(AllowTrading && !PositionSelect(_Symbol) && !g_tradeTaken) {
         double entryPriceTrade = 0, stopLoss = 0, takeProfit = 0;
         point = SymbolInfoDouble(_Symbol, SYMBOL_POINT);
         bool tradeResult = false;
         //--- For a Bullish pattern, execute a BUY obj_Trade
         if(patternType=="Bullish") {  //--- BUY signal
            entryPriceTrade = SymbolInfoDouble(_Symbol, SYMBOL_ASK);
            double diffTrade = TP2Level - entryPriceTrade;
            stopLoss = entryPriceTrade - diffTrade * 3;
            takeProfit = TP2Level;
            tradeResult = obj_Trade.Buy(LotSize, _Symbol, entryPriceTrade, stopLoss, takeProfit, "Bat Signal");
            if(tradeResult)  {
               Print("Buy order opened successfully.");
               g_tradeTaken = true;
            } else
               Print("Buy order failed: ", obj_Trade.ResultRetcodeDescription());
         }
         //--- For a Bearish pattern, execute a SELL obj_Trade
         else if(patternType=="Bearish") {  //--- SELL signal
            entryPriceTrade = SymbolInfoDouble(_Symbol, SYMBOL_BID);
            double diffTrade = entryPriceTrade - TP2Level;
            stopLoss = entryPriceTrade + diffTrade * 3;
            takeProfit = TP2Level;
            tradeResult = obj_Trade.Sell(LotSize, _Symbol, entryPriceTrade, stopLoss, takeProfit, "Bat Signal");
            if(tradeResult)  {
               Print("Sell order opened successfully.");
               g_tradeTaken = true;
            } else
               Print("Sell order failed: ", obj_Trade.ResultRetcodeDescription());
         }
      }
      else {
         //--- If a position is already open, do not execute a new obj_Trade
         Print("A position is already open for ", _Symbol, ". No new obj_Trade executed.");
      }
   }
   else {
      //--- If the pattern has changed, update the lock with the new formation bar and X pivot
      g_patternFormationBar = currentBarIndex;
      g_lockedPatternX = X.time;
      g_tradeTaken = false;
      Print("Pattern has changed; updating lock on bar ", currentBarIndex, ". Waiting for confirmation.");
      return;
   }
}
else {
   //--- If no valid Bat pattern is detected, reset the pattern lock variables
   g_patternFormationBar = -1;
   g_lockedPatternX = 0;
   g_tradeTaken = false;
}
这里,我们完成Tick事件的最终逻辑,用于处理交易开仓以及形态确认。首先通过"Bars(_Symbol, _Period) - 1"获取当前K线索引,并存储在"currentBarIndex"中。如果当前没有锁定任何形态("g_patternFormationBar等于-1"),则将"g_patternFormationBar"赋值为"currentBarIndex",将"X.time"存入"g_lockedPatternX"完成锁定,打印日志提示等待形态确认,随后退出本段逻辑。如果仍然处于形态形成的同一根K线("currentBarIndex等于g_patternFormationBar"),输出日志提示存在重绘风险并退出,防止提前交易。
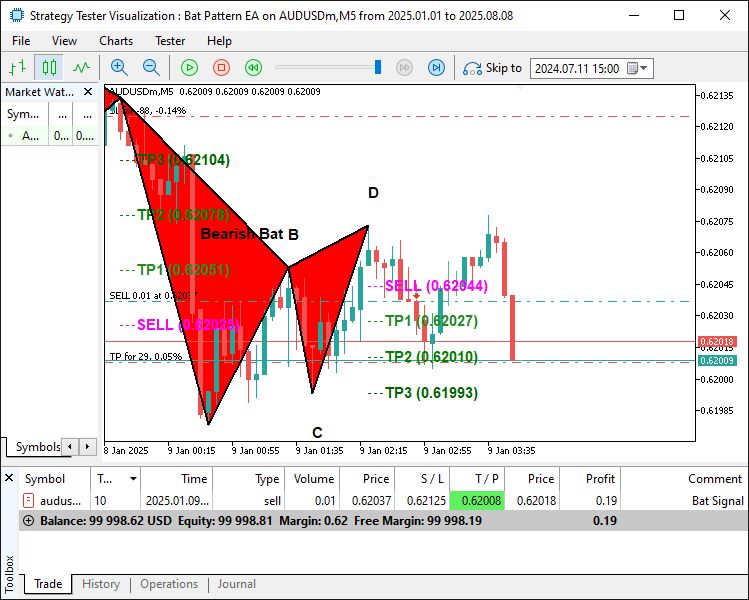
最后,当新K线已经生成(currentBarIndex > g_patternFormationBar),并且当前X枢轴点和"g_lockedPatternX"匹配,则确认该形态,打印日志,更新"g_patternFormationBar",接着校验条件:"AllowTrading"开启自动交易、通过PositionSelect确认无持仓,并且"g_tradeTaken"为false(尚未开仓)。如果是看涨形态:将"entryPriceTrade"设置为ask价,"diffTrade"为"TP2Level - entryPriceTrade",止损位"stopLoss"设置在入场价下方3倍该价差,止盈位"takeProfit"设置为 "TP2Level",调用"obj_Trade.Buy",传入手数"LotSize"与订单注释"Bat Signal"执行做多,打印开仓成功或失败日志,并将"g_tradeTaken"设置为true;如果是看跌形态:取bid价作为入场价,将"stopLoss"设置在入场价上方3倍价差,调用"obj_Trade.Sell"执行做空。如果自动交易未开启、已有持仓或已经开过仓,则输出日志说明不执行交易。如果形态发生变化,则更新锁定信息并继续等待;如果未检测到形态,则重置全部全局变量。编译后,呈现如下效果:
看跌信号:
看涨信号:
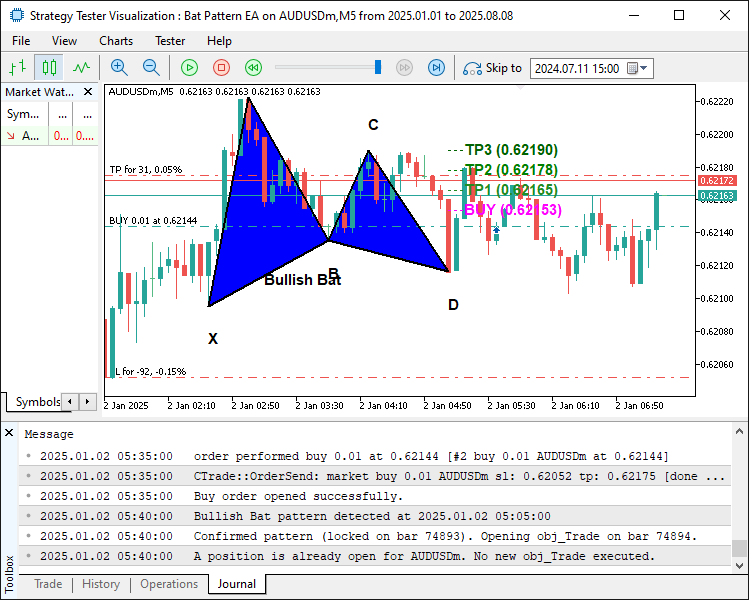
由图可见,程序能够绘制谐波形态,并且在形态确认后按规则执行交易,至此我们达成目标:识别、绘制并交易该形态。接下来需要对程序进行回测,具体内容见下一章节。
回测
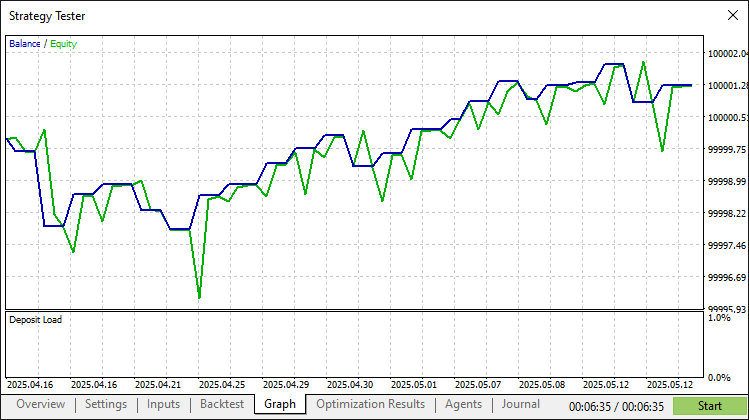
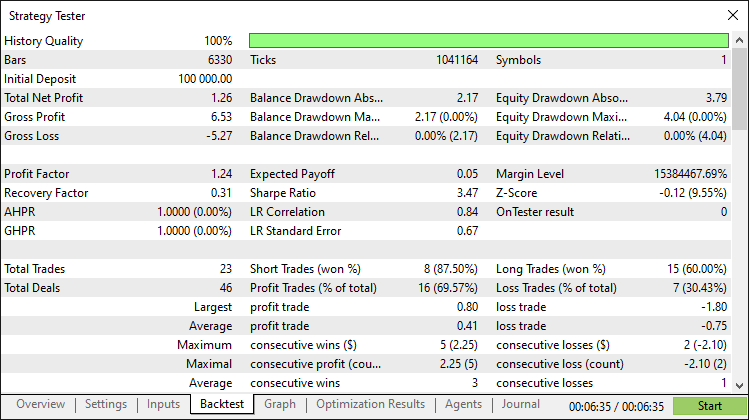
经过全面回测后,我们得到以下结果:
回测图:
回测报告:
结论
总体而言,我们在MQL5中开发了一套蝙蝠形态交易系统,利用价格行为,依托精确的斐波那契比例识别看涨与看跌蝙蝠谐波形态;根据计算得到的入场、止损以及多级止盈点位实现自动化交易,并通过三角形、趋势线等图表对象完成形态可视化。
免责声明:本文仅用于教学目的。交易存在重大财务风险,市场剧烈波动可能导致资金损失。在实盘操作前,务必进行充分的历史回测,并建立严格的风险控制机制。
借助本文介绍的原理与代码实现方案,您可以对这套蝙蝠形态系统进行改造,适配自己的交易风格,从而优化您的算法交易策略。祝您交易顺利!
本文由MetaQuotes Ltd译自英文
原文地址: https://www.mql5.com/en/articles/19105
注意: MetaQuotes Ltd.将保留所有关于这些材料的权利。全部或部分复制或者转载这些材料将被禁止。
本文由网站的一位用户撰写,反映了他们的个人观点。MetaQuotes Ltd 不对所提供信息的准确性负责,也不对因使用所述解决方案、策略或建议而产生的任何后果负责。


 MQL5自优化智能交易系统(第十三部分):基于矩阵分解浅谈控制理论
 新手在交易中的10个基本错误
 市场模拟:MQL5 中的 SQL 入门(五)
