
スタンダードライブラリーのクラスとグーグルチャートAPIを用いて情報ボードを生成する
はじめに
MQL5のプログラマーの活動を楽にするため、デザイナーは 標準ライブラリを作成したが、これはほとんど全てのAPI MQL5機能をカバーし、これで作業することをずっと簡単にそして便利にしている。この記事は標準ライブラリーで使用されるクラスを最大限載せた情報ボードを創ろうという試みとなる。
1. 標準ライブラリのクラスの概観
では、このライブラリとはいったい何なのか?解説ドキュメント ではこれは次のものからなると述べている:
- 基本クラス CObject
- データのクラス
- グラフィックオブジェクトのクラス
- チャートを取り扱うクラス
- ファイル操作のためのクラス
- 文字列操作のためのクラス
- インジケーターと時系列を扱うためのクラス
- トレードのクラス
全てのクラスを含んだファイルはMQL5/Include フォルダーにある。ライブラリーコードを見るとクラスのみを与えていて、ファンクションはないことに気付くだろう。従って、これを使うには、オブジェクト指向プログラミング(OOP)のある程度の知識を持っていなければならない。
ライブラリのクラスの全て(トレーディングのものを除き)は CObject ベースクラスから派生している。これを示すため、 クラスダイヤグラムを構築してみよう。これに必要な全てはそろっている-親のクラスとその継承者たち。MQL5 は基本的にC++のサブセットであるので、IBM Rational Rose instrumentを使うことにする、これはダイヤグラムの自動構築のために、C++プロジェクトのリバースエンジニアリングのツールを提供してくれる。
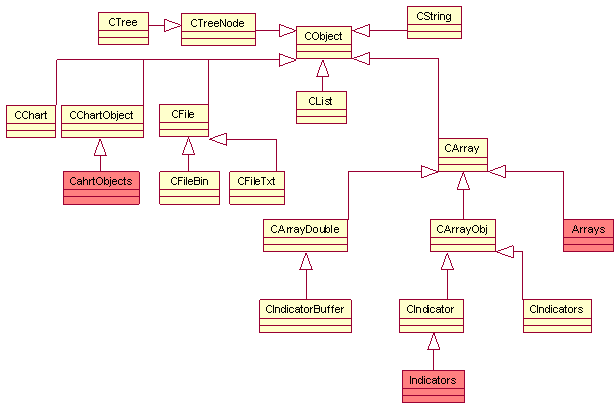
図 1. 標準ライブラリのクラスのダイヤグラム
クラスのプロパティとメソッドは得られるダイヤグラムが複雑になるので表示されていない。アグレゲーション(集合)も、我々には重要でないので省いた。結果として、世代(継承)のみが残っていて、どのプロパティとメソッドをクラスが得ているかを見出すことができる。
ダイヤグラムに見れるように、ライン、ファイル、チャート、グラフィックオブジェクト、そして配列を扱う各ライブラリーの要素はそのベースクラスを持っていて (それぞれCString, CFile, CChart, CChartObject そして CArray)、それらは CObjectから継承されているインジケーター CIndicator とその 付属である CIndicators クラスを扱うためのベースのクラスは CArrayObj から継承されていて、一方インジケーターのバッファーのクラス CIndicatorBuffer は CArrayDoubleから継承されている。
ダイヤグラムの深紅色は実際のクラスには存在しないことを示している - それらは インジケーター、配列とグラフィックオブジェクトを取り扱うときのクラスを含んでいる集合である。それらは非常に多くあり、そしていずれも単一の親から相続されているが、簡単化のため、ダイヤグラムが複雑にならないようにそうしている。例えば、indicatorは CiDEMA, CiStdDev, 等を含んでいる。
またクラスダイヤグラムはDoxygen documentation systemの自動生成を用いて構築できることに注意する価値がある。このシステムでこれを行うのはRational Roseで行うより少し簡単である。Doxygenについてのもっと詳細は記事 Auto-Generated Documentation for MQL5 Code(MQL5 のため自動生成記録)の中に載っている
2. 問題
標準ライブラリークラスのついてできる限り多くの情報を記載するテーブルを作成することを試みよう。
ボードは何を表示するだろうか?いくらかMetaTrader 5の詳細レポートに似たものであろう:

図 2. 詳細レポートの見え方
見て分かるように、レポートはバランスチャートと何らかのトレーディング図を示している。. これらのインジケータの計算方法についてより詳しい内容は論説エキスパートのテスト報告書の数値の意味するもの (What the Numbers in the Expert Testing Report Mean) に見ることができる。.
ボードはあくまで純粋に情報提供のために使われ、なんら取引操作は行使しない。これはチャートを閉じるのを防止するため、別のウインドウで、一つのインジケーターとして実装するのが最良である。さらに、それを簡単な縮尺とするためサブウインドウに置くこと、さらにマウスの一つの操作でボードを閉じることができるのが良い。
報告をパイチャートで補完したいと思うかも知れない、そうすれば全取引数に相対的なその証券 上の取引数を表示することができる。.
3. インターフェースの設計
われわれは目的を定義した - 主チャートのサブウインドウに詳細レポートを必要とする。
情報ボードをクラスとして実装することにしよう。さて始めよう:
//+------------------------------------------------------------------+
///The Board class
//+------------------------------------------------------------------+
class Board
  {
//protected data
protected:
///number of the sub-window where the board will be stored
   int               wnd;
///array with the deals data
   CArrayObj        *Data;
///array with the balance data
   CArrayDouble      ChartData;
///array with elements of the interface
   CChartObjectEdit  cells[10][6];
///object for working with the chart
   CChart            Chart;
///object for working with the balance chart
   CChartObjectBmpLabel BalanceChart;
///object for working with the pie chart
   CChartObjectBmpLabel PieChart;
///data for the pie chart
   PieData          *pie_data;
//private data and methods
private:
   double            net_profit;      //these variables will store the calculated characteristics
   double            gross_profit;
   double            gross_loss;
   double            profit_factor;
   double            expected_payoff;
   double            absolute_drawdown;
   double            maximal_drawdown;
   double            maximal_drawdown_pp;
   double            relative_drawdown;
   double            relative_drawdown_pp;
   int               total;
   int               short_positions;
   double            short_positions_won;
   int               long_positions;
   double            long_positions_won;
   int               profit_trades;
   double            profit_trades_pp;
   int               loss_trades;
   double            loss_trades_pp;
   double            largest_profit_trade;
   double            largest_loss_trade;
   double            average_profit_trade;
   double            average_loss_trade;
   int               maximum_consecutive_wins;
   double            maximum_consecutive_wins_usd;
   int               maximum_consecutive_losses;
   double            maximum_consecutive_losses_usd;
   int               maximum_consecutive_profit;
   double            maximum_consecutive_profit_usd;
   int               maximum_consecutive_loss;
   double            maximum_consecutive_loss_usd;
   int               average_consecutive_wins;
   int               average_consecutive_losses;

   ///method of obtaining data about the deals and the balance
   void              GetData();

   ///method of calculating the characteristics
   void              Calculate();

   ///method of chart construction
   void              GetChart(int X_size,int Y_size,string request,string file_name);

   ///method of request to Google Charts API
   string            CreateGoogleRequest(int X_size,int Y_size,bool type);

  ///method of obtaining the optimum font size
   int               GetFontSize(int x,int y);
   string            colors[12];  //array with text presentation of colors
//public methods
public:
///constructor
   void              Board();
///destructor
   void             ~Board();
///method for board update
   void              Refresh();
///method for creating interface elements
   void              CreateInterface();
  };
保護されているクラスデータはインターフェース要素とディール、バランス、そしてパイチャートデータである。トレードのインジケータといくつかのメソッドはプライベートである。. それらは使用者がそれらに直接のアクセスを持つべきではないのでプライベートであり、それらはクラスの中で計算される。
インターフェース作成とインジケータの計算のメソッドもまたプライベートであり、それはここで厳格なメソッドの呼び出しのシーケンスに耐える必要があるからである。例えば、インジケータの計算に計算のためのデータが無くては計算は不可能であり事前に作成しておくことなく、インタフェースを更新することも不可能である。従って、使用者に「墓穴を掘る(自分の足を撃つ)」ことはさせない。.
あとで、戻ってくる必要がないよう。クラスのコンストラクターとデストラクターを紹介します。
//+------------------------------------------------------------------+
///Constructor
//+------------------------------------------------------------------+
void Board::Board()
  {
   Chart.Attach();                               //attach the current chart to the class instance
   wnd=ChartWindowFind(Chart.ChartId(),"IT");    //find the indicator window
   Data = new CArrayObj;                         //creating the CArrayObj class instance
   pie_data=new PieData;                         //creating the PieData class instance
   //fill colors array
   colors[0]="003366"; colors[1]="00FF66"; colors[2]="990066";
   colors[3]="FFFF33"; colors[4]="FF0099"; colors[5]="CC00FF";
   colors[6]="990000"; colors[7]="3300CC"; colors[8]="000033";
   colors[9]="FFCCFF"; colors[10]="CC6633"; colors[11]="FF0000";
  }
//+------------------------------------------------------------------+
///Destructor
//+------------------------------------------------------------------+
void Board::~Board()
  {
   if(CheckPointer(Data)!=POINTER_INVALID) delete Data;   //delete the deals data
   if(CheckPointer(pie_data)!=POINTER_INVALID) delete pie_data;
   ChartData.Shutdown();    //and balance data
   Chart.Detach();          //detach from the chart
   for(int i=0;i<10;i++)    //delete all interface elements
      for(int j=0;j<6;j++)
         cells[i][j].Delete();
   BalanceChart.Delete();   //delete the balance chart
   PieChart.Delete();       //and pie chart
  }
コンストラクターにおいて、タイプ CChart のオブジェクトをその Attach() メソッドの助けで現在のチャートに結びつける。デストラクターで呼び出される Detach() メソッドはチャートをそのオブジェクトから開放する。 CArrayObj タイプのオブジェクトへのポインターであるデータオブジェクトは、オブジェクトのアドレスを受け取り、 new 操作を用いて動的に 生成され、デストラクタにおいて delete 操作を用いて削除される。. 削除の前に CheckPointer() を用いてオブジェクトの存在をチェックするのを忘れないようにする、さもないとエラーが起こる。
CArrayObj クラスについてのもっと詳しい情報が さらに与えられる。CArrayDouble クラスの Shutdown() メソッドはほかのクラスと同様に CArray クラスから相続され(クラスのダイヤグラム参照) オブジェクトによって占領されたメモリーをクリアし明け渡す。 CChartObject クラス相続者の Delete() メソッド そのチャートからのオブジェクトを除去する。
こうして、コンストラクター はメモリーを割り当てデストラクターはそれを明け渡し、クラスで創られたグラフィックオブジェクト を除去する。
それでは、インタフェースを紹介しよう。上述の通り、CreateInterface() メソッドはボードのインターフェース の生成を行い雨:
//+------------------------------------------------------------------+
///CreateInterface function
//+------------------------------------------------------------------+
void Board::CreateInterface()
  {
   //retrieve the width
   int x_size=Chart.WidthInPixels();
   //and the height of the indicator window
   int y_size=Chart.GetInteger(CHART_HEIGHT_IN_PIXELS,wnd);

    //calculate, how much space will the balance chart take up
   double chart_border=y_size*(1.0-(Chart_ratio/100.0));

   if(Chart_ratio<100)//if the balance chart is taking up the entire table
     {
      for(int i=0;i<10;i++)//create columns
        {
         for(int j=0;j<6;j++)//and rows
           {
            cells[i][j].Create(Chart.ChartId(),"InfBoard "+IntegerToString(i)+" "+IntegerToString(j),
                               wnd,j*(x_size/6.0),i*(chart_border/10.0),x_size/6.0,chart_border/10.0);
            //set selectable property to false
            cells[i][j].Selectable(false);
            //set text as read only
            cells[i][j].ReadOnly(true);
            //set font size
            cells[i][j].FontSize(GetFontSize(x_size/6.0, chart_border/10.0));
            cells[i][j].Font("Arial");    //font name
            cells[i][j].Color(text_color);//font color
           }
        }
     }

   if(Chart_ratio>0)//if the balance chart is required
     {
      //create a balance chart
      BalanceChart.Create(Chart.ChartId(), "InfBoard chart", wnd, 0, chart_border);
      //set selectable property to false
      BalanceChart.Selectable(false);
      //create a pie chart
      PieChart.Create(Chart.ChartId(), "InfBoard pie_chart", wnd, x_size*0.75, chart_border);
      PieChart.Selectable(false);//set selectable property to false
     }

   Refresh();//refresh the board
  }
全ての要素をコンパクトに配置するため、まず CChartクラスの WidthInPixels() と GetInteger() メソッド を用いてボードを置くインジケーターサブウインドウの長さと幅を求める。そしてCChartObjectEdit クラスの Create()メソッドを用いて インジケーターの値を含んでいるセルを生成する (「入力フィールド」の生成), 全ての継承者はこの CChartObjectメソッドを持っている。
このタイプの操作に 標準ライブラリ がいかに便利か分かるだろうこれが無くては各オブジェクトをObjectCreateファンクションを用いて生成し、ObjectSetのようなファンクションを用いてオブジェクトのプロパティを設定しなければならず、コードが冗長になってしまう。後ほどオブジェクトのプロパティを変更したいと思ったときに、混乱を避けるためにオブジェクトの名前を注意深く選ばなければならないだろう。ここで簡単に一連のグラフィックオブジェクトを生成し、望んだような形を見ることができる。
さらに、 オブジェクトのプロパティを、もしそれがCChartObject クラスの Color()メソッドのように、 高負荷なクラスを生成するものであると、一つのファンクションでオブジェクトのプロパティを取得・格納することができる - パラメーターが無ければ - それはオブジェクトの色に戻る。パイチャートをバランスチャートの次に置く、それは画面の全幅の4分の1にもなるかもしれない。
Refresh method() がボードを更新する。この更新の内容は何か?インジケーターを数え、それらをグラフィックオブジェクトに入れ、そしてもしそれが入っているウインドウのサイズが変わったならボードの寸法を再調整する。ボードはウインドウの全フリースペースを占有するはずだ。
//+------------------------------------------------------------------+
///Function of the board updating
//+------------------------------------------------------------------+
void Board::Refresh()
  {
   //check the server connection status
   if(!TerminalInfoInteger(TERMINAL_CONNECTED)) {Alert("No connection with the trading server!"); return;}
   //check the permission for importing functions from DLL
   if(!TerminalInfoInteger(TERMINAL_DLLS_ALLOWED)) {Alert("DLLs are prohibited!"); return;}
   //calculate the characteristics
   Calculate();
   //retrieve the width
   int x_size=Chart.WidthInPixels();
   //and the height of the indicator window
   int y_size=Chart.GetInteger(CHART_HEIGHT_IN_PIXELS,wnd);
   //calculate how much space the balance chart will take up
   double chart_border=y_size*(1.0-(Chart_ratio/100.0));

   string captions[10][6]= //array with signatures of interface elements
     {
        {"Total Net Profit:"," ","Gross Profit:"," ","Gross Loss:"," "},
        {"Profit Factor:"," ","Expected Payoff:"," ","",""},
        {"Absolute Drawdown:"," ","Maximal Drawdown:"," ","Relative Drawdown:"," "},
        {"Total Trades:"," ","Short Positions (won %):"," ","Long Positions (won %):"," "},
        {"","","Profit Trades (% of total):"," ","Loss trades (% of total):"," "},
        {"Largest","","profit trade:"," ","loss trade:"," "},
        {"Average","","profit trade:"," ","loss trade:"," "},
        {"Maximum","","consecutive wins ($):"," ","consecutive losses ($):"," "},
        {"Maximal","","consecutive profit (count):"," ","consecutive loss (count):"," "},
        {"Average","","consecutive wins:"," ","consecutive losses:"," "}
     };

   //put the calculated characteristics into the array
   captions[0][1]=DoubleToString(net_profit, 2);
   captions[0][3]=DoubleToString(gross_profit, 2);
   captions[0][5]=DoubleToString(gross_loss, 2);

   captions[1][1]=DoubleToString(profit_factor, 2);
   captions[1][3]=DoubleToString(expected_payoff, 2);

   captions[2][1]=DoubleToString(absolute_drawdown, 2);
   captions[2][3]=DoubleToString(maximal_drawdown, 2)+"("+DoubleToString(maximal_drawdown_pp, 2)+"%)";
   captions[2][5]=DoubleToString(relative_drawdown_pp, 2)+"%("+DoubleToString(relative_drawdown, 2)+")";

   captions[3][1]=IntegerToString(total);
   captions[3][3]=IntegerToString(short_positions)+"("+DoubleToString(short_positions_won, 2)+"%)";
   captions[3][5]=IntegerToString(long_positions)+"("+DoubleToString(long_positions_won, 2)+"%)";

   captions[4][3]=IntegerToString(profit_trades)+"("+DoubleToString(profit_trades_pp, 2)+"%)";
   captions[4][5]=IntegerToString(loss_trades)+"("+DoubleToString(loss_trades_pp, 2)+"%)";

   captions[5][3]=DoubleToString(largest_profit_trade, 2);
   captions[5][5]=DoubleToString(largest_loss_trade, 2);

   captions[6][3]=DoubleToString(average_profit_trade, 2);
   captions[6][5]=DoubleToString(average_loss_trade, 2);

   captions[7][3]=IntegerToString(maximum_consecutive_wins)+"("+DoubleToString(maximum_consecutive_wins_usd, 2)+")";
   captions[7][5]=IntegerToString(maximum_consecutive_losses)+"("+DoubleToString(maximum_consecutive_losses_usd, 2)+")";

   captions[8][3]=DoubleToString(maximum_consecutive_profit_usd, 2)+"("+IntegerToString(maximum_consecutive_profit)+")";
   captions[8][5]=DoubleToString(maximum_consecutive_loss_usd, 2)+"("+IntegerToString(maximum_consecutive_loss)+")";

   captions[9][3]=IntegerToString(average_consecutive_wins);
   captions[9][5]=IntegerToString(average_consecutive_losses);

   if(Chart_ratio<100) //if the balance chart doesn't take up the entire table
     {
      for(int i=0;i<10;i++) //go through the interface elements
        {
         for(int j=0;j<6;j++)
           {
            //specify the position
            cells[i][j].X_Distance(j*(x_size/6.0));
            cells[i][j].Y_Distance(i*(chart_border/10.0));
            //the size
            cells[i][j].X_Size(x_size/6.0);
            cells[i][j].Y_Size(chart_border/10.0);
            //the text
            cells[i][j].SetString(OBJPROP_TEXT,captions[i][j]);
            //and font size
            cells[i][j].FontSize(GetFontSize(x_size/6.0,chart_border/10.0));
           }
        }
     }

   if(Chart_ratio>0)//if the balance chart is required
     {
      //refresh the balance chart
      int X=x_size*0.75,Y=y_size-chart_border;
      //get the chart
      GetChart(X,Y,CreateGoogleRequest(X,Y,true),"board_balance_chart");
      //set its position
      BalanceChart.Y_Distance(chart_border);
      //specify file names
      BalanceChart.BmpFileOn("board_balance_chart.bmp");
      BalanceChart.BmpFileOff("board_balance_chart.bmp");
      //refresh the pie chart
      X=x_size*0.25;
      //get the chart
      GetChart(X,Y,CreateGoogleRequest(X,Y,false),"pie_chart");
      //set its new position
      PieChart.Y_Distance(chart_border);
      PieChart.X_Distance(x_size*0.75);
      //specify file names
      PieChart.BmpFileOn("pie_chart.bmp");
      PieChart.BmpFileOff("pie_chart.bmp");
     }

   ChartRedraw(); //redraw the chart
  }
たくさんのコードがあり CreateInterface() メソッドに似て、まずCalculate() ファンクションがインジケーターを数え、それらを グラフィックオブジェクトに入れ、そして同時にオブジェクトのサイズをX_Size() and Y_Size() メソッドを用いてウインドウのサイズに合わせる。X_Distance と Y_Distanceメソッドがオブジェクトの位置を変更する。
GetFontSize()ファンクションに注目する、それはフォントのサイズを選び、テキストが再スケールの後コンテナーの境界から「オーバーフロー」しないように、そして、逆に小さくなり過ぎないようにする。.
このファンクションをより詳細に見てみよう。
//import DLL function for string metrics
#import "String_Metrics.dll"
void GetStringMetrics(int font_size,int &X,int &Y);
#import

//+------------------------------------------------------------------+
///Function of determining the optimum font size
//+------------------------------------------------------------------+
int Board::GetFontSize(int x,int y)
  {
   int res=8;
   for(int i=15;i>=1;i--)//go through the different font sizes
     {
      int X,Y; //here we input the line metrics
      //determine the metrics
      GetStringMetrics(i,X,Y);
      //if the line fits the set borders - return the font size
      if(X<=x && Y<=y) return i;
     }
   return res;
  }
GetStringMetrics() ファンクションは上に述べたDLLからインポートされ、そのコードはarchive DLL_Sources.zipの中に見出され、必要があれば変更できる。あなたがプロジェクトで自身のインターフェースを設計する選択をするならこれは便利になると思う 。
これでユーザーインターフェースについて終えたので、トレードのインジケーターの計算に移ろう。
4. トレードのインジケーターの計算
Calculate() メソッドは計算を行う。
しかし、必要なデータを受け取るGetData() メソッドも必要である。
//+------------------------------------------------------------------+
///Function of receiving the deals and balance data
//+------------------------------------------------------------------+
void Board::GetData()
  {
   //delete old data
   Data.Shutdown();
   ChartData.Shutdown();
   pie_data.Shutdown();
   //prepare all the deals history
   HistorySelect(0,TimeCurrent());
   CAccountInfo acc_inf;   //object for work with account
   //calculate the balance
   double balance=acc_inf.Balance();
   double store=0; //balance
   long_positions=0;
   short_positions=0;
   long_positions_won=0;
   short_positions_won=0;
   for(int i=0;i<HistoryDealsTotal();i++) //go through all of the deals in the history

     {
      CDealInfo deal;  //the information about the deals will be stored here
      deal.Ticket(HistoryDealGetTicket(i));//get deal ticket
      //if the trade had a financial result (exit of the market)
      if(deal.Ticket()>=0 && deal.Entry()==DEAL_ENTRY_OUT)
        {
         pie_data.Add(deal.Symbol()); //add data for the pie chart
         //check for the symbol
         if(!For_all_symbols && deal.Symbol()!=Symbol()) continue;
         double profit=deal.Profit(); //retrieve the trade profit
         profit+=deal.Swap();         //swap
         profit+=deal.Commission();   //commission
         store+=profit;               //cumulative profit
         Data.Add(new CArrayDouble);  //add new element to the array
         ((CArrayDouble *)Data.At(Data.Total()-1)).Add(profit);  //and data
         ((CArrayDouble *)Data.At(Data.Total()-1)).Add(deal.Type());
        }
     }

   //calculate the initial deposit
   double initial_deposit=(balance-store);
   for(int i=0;i<Data.Total();i++) //go through the prepared trades
     {
      //calculate the balance value
      initial_deposit+=((CArrayDouble *)Data.At(i)).At(0);
      ChartData.Add(initial_deposit); //and put it to the array
     }
  }
最初に、データ保存のメソッドを考えよう。標準ライブラリは データ構造のクラスを提供し、それで配列を使わないで済ませることができる。利益と取引のタイプのデータを履歴に保存するのに2次元の配列を必要とする。しかし標準ライブラリは2次元の配列を構成する明示的なクラスを提供していない、ただし CArrayDouble (2重データタイプの配列)と CArrayObjクラス( CObject クラスのインスタンスとその継承者へのポインターの動的な配列)がある。すなわちダブルタイプの配列を生成することができ、それはまさに行われていることである。
もちろん ((CArrayDouble *) Data.At (Data.Total () - 1 ))のような宣言もある。(profit)を加えることは data [i] [j] = profit とするほどスマートには見えないが、これは最初に言うだけのことである。結局、標準ライブラリのクラスを使うことなく単に1つの配列を宣言することは、組み込みのメモリ管理、異なった配列を挿入する能力、配列の比較、要素の探索といった利益を失うことになる。こうして、メモリ組織のクラスを使用することは、配列のオーバーフローの管理から開放し、さらに多くの便利な道具も提供してくれる。
CArray (図 1.参照) クラスのTotal()メソッド は配列内の要素の数を戻し、 Add() メソッド はそれらを加算し、 At() メソッドは要素を戻す。
パイチャートを作ることにしているので、シンボルに対するディールの数を表示するために、必要なデータを集めなければならない。
ここでこのデータを収集するために、追加のクラスを書く。
//+------------------------------------------------------------------+
///The Pie chart class
//+------------------------------------------------------------------+
class PieData
  {
protected:
///number of deals per symbol
   CArrayInt         val;
///symbols
   CArrayString      symb;
public:
///delete the data
   bool Shutdown()
     {
      bool res=true;
      res&=val.Shutdown();
      res&=symb.Shutdown();
      return res;
     }
///search for a sting in the array
   int Search(string str)
     {  //check all array elements
      for(int i=0;i<symb.Total();i++)
         if(symb.At(i)==str) return i;
      return -1;
     }
///add new data
   void Add(string str)
     {
      int symb_pos=Search(str);//determine symbol position in the array
      if(symb_pos>-1)
         val.Update(symb_pos,val.At(symb_pos)+1);//update the deals data
      else //if there isn't such a symbol yet
        {
         symb.Add(str); //add it
         val.Add(1);
        }
     }

   int Total() const {return symb.Total();}
   int Get_val(int pos) const {return val.At(pos);}
   string Get_symb(int pos) const {return symb.At(pos);}
  };
標準ライブラリのクラスが常に処理に必要なメソッドを提供してくれるわけではない。この例では 、CArrayString クラスのSearch() メソッドは適切ではない、というのはそれを適用するのに配列をソートする必要があり、それはデータ構造に反するからである。 したがって、自身でメソッドを書き下ろさなければならない。
トレードの特性の計算はCalculate() メソッドに組まれている:
//+------------------------------------------------------------------+
///Calculation of characteristics
//+------------------------------------------------------------------+
void Board::Calculate()
  {
   //get the data
   GetData();
   //zero all characteristics
   gross_profit=0;
   gross_loss=0;
   net_profit=0;
   profit_factor=0;
   expected_payoff=0;
   absolute_drawdown=0;
   maximal_drawdown_pp=0;
   maximal_drawdown=0;
   relative_drawdown=0;
   relative_drawdown_pp=0;
   total=Data.Total();
   long_positions=0;
   long_positions_won=0;
   short_positions=0;
   short_positions_won=0;
   profit_trades=0;
   profit_trades_pp=0;
   loss_trades=0;
   loss_trades_pp=0;
   largest_profit_trade=0;
   largest_loss_trade=0;
   average_profit_trade=0;
   average_loss_trade=0;
   maximum_consecutive_wins=0;
   maximum_consecutive_wins_usd=0;
   maximum_consecutive_losses=0;
   maximum_consecutive_losses_usd=0;
   maximum_consecutive_profit=0;
   maximum_consecutive_profit_usd=0;
   maximum_consecutive_loss=0;
   maximum_consecutive_loss_usd=0;
   average_consecutive_wins=0;
   average_consecutive_losses=0;

   if(total==0) return; //there isn't deals - return from the function
   double max_peak=0,min_peak=0,tmp_balance=0;
   int max_peak_pos=0,min_peak_pos=0;
   int max_cons_wins=0,max_cons_losses=0;
   double max_cons_wins_usd=0,max_cons_losses_usd=0;
   int avg_win=0,avg_loss=0,avg_win_cnt=0,avg_loss_cnt=0;

   for(int i=0; i<total; i++)
     {
      double profit=((CArrayDouble *)Data.At(i)).At(0); //get profit
      int deal_type=((CArrayDouble *)Data.At(i)).At(1); //and deal type
      switch(deal_type) //check deal type
        {
         //and calculate number of long and short positions
         case DEAL_TYPE_BUY: {long_positions++; if(profit>=0) long_positions_won++; break;}
         case DEAL_TYPE_SELL: {short_positions++; if(profit>=0) short_positions_won++; break;}
        }

      if(profit>=0)//the deal is profitable
        {
         gross_profit+=profit; //gross profit
         profit_trades++;      //number of profit deals
         //the largest profitable trade and the largest profitable series
         if(profit>largest_profit_trade) largest_profit_trade=profit;

         if(maximum_consecutive_losses<max_cons_losses ||
            (maximum_consecutive_losses==max_cons_losses && maximum_consecutive_losses_usd>max_cons_losses_usd))
           {
            maximum_consecutive_losses=max_cons_losses;
            maximum_consecutive_losses_usd=max_cons_losses_usd;
           }
         if(maximum_consecutive_loss_usd>max_cons_losses_usd ||
            (maximum_consecutive_loss_usd==max_cons_losses_usd && maximum_consecutive_losses<max_cons_losses))
           {
            maximum_consecutive_loss=max_cons_losses;
            maximum_consecutive_loss_usd=max_cons_losses_usd;
           }
         //average profit per deal
         if(max_cons_losses>0) {avg_loss+=max_cons_losses; avg_loss_cnt++;}
         max_cons_losses=0;
         max_cons_losses_usd=0;
         max_cons_wins++;
         max_cons_wins_usd+=profit;
        }
      else //deal is losing
        {
         gross_loss-=profit; //cumulative profit
         loss_trades++;      //number of losing deals
         //the most unprofitable deal and the most unprofitable series
         if(profit<largest_loss_trade) largest_loss_trade=profit;
         if(maximum_consecutive_wins<max_cons_wins ||
            (maximum_consecutive_wins==max_cons_wins && maximum_consecutive_wins_usd<max_cons_wins_usd))
           {
            maximum_consecutive_wins=max_cons_wins;
            maximum_consecutive_wins_usd=max_cons_wins_usd;
           }
         if(maximum_consecutive_profit_usd<max_cons_wins_usd ||
            (maximum_consecutive_profit_usd==max_cons_wins_usd && maximum_consecutive_profit<max_cons_wins))
           {
            maximum_consecutive_profit=max_cons_wins;
            maximum_consecutive_profit_usd=max_cons_wins_usd;
           }
         //average lose per deal
         if(max_cons_wins>0) {avg_win+=max_cons_wins; avg_win_cnt++;}
         max_cons_wins=0;
         max_cons_wins_usd=0;
         max_cons_losses++;
         max_cons_losses_usd+=profit;
        }

      tmp_balance+=profit; //absolute drawdown calculation
      if(tmp_balance>max_peak) {max_peak=tmp_balance; max_peak_pos=i;}
      if(tmp_balance<min_peak) {min_peak=tmp_balance; min_peak_pos=i;}
      if((max_peak-min_peak)>maximal_drawdown && min_peak_pos>max_peak_pos) maximal_drawdown=max_peak-min_peak;
     }
   //maximal drawdown calculation
   double min_peak_rel=max_peak;
   tmp_balance=0;
   for(int i=max_peak_pos;i<total;i++)
     {
      double profit=((CArrayDouble *)Data.At(i)).At(0);
      tmp_balance+=profit;
      if(tmp_balance<min_peak_rel) min_peak_rel=tmp_balance;
     }
   //relative drawdown calculation
   relative_drawdown=max_peak-min_peak_rel;
   //net profit
   net_profit=gross_profit-gross_loss;
   //profit factor
   profit_factor=(gross_loss!=0) ?  gross_profit/gross_loss : gross_profit;
   //expected payoff
   expected_payoff=net_profit/total;
   double initial_deposit=AccountInfoDouble(ACCOUNT_BALANCE)-net_profit;
   absolute_drawdown=MathAbs(min_peak);
   //drawdowns
   maximal_drawdown_pp=(initial_deposit!=0) ?(maximal_drawdown/initial_deposit)*100.0 : 0;
   relative_drawdown_pp=((max_peak+initial_deposit)!=0) ?(relative_drawdown/(max_peak+initial_deposit))*100.0 : 0;

   //profit and losing trade percentage
   profit_trades_pp=((double)profit_trades/total)*100.0;
   loss_trades_pp=((double)loss_trades/total)*100.0;

   //average profitable and losing deals
   average_profit_trade=(profit_trades>0) ? gross_profit/profit_trades : 0;
   average_loss_trade=(loss_trades>0) ? gross_loss/loss_trades : 0;

   //maximum consecutive losses
   if(maximum_consecutive_losses<max_cons_losses ||
      (maximum_consecutive_losses==max_cons_losses && maximum_consecutive_losses_usd>max_cons_losses_usd))
     {
      maximum_consecutive_losses=max_cons_losses;
      maximum_consecutive_losses_usd=max_cons_losses_usd;
     }
   if(maximum_consecutive_loss_usd>max_cons_losses_usd ||
      (maximum_consecutive_loss_usd==max_cons_losses_usd && maximum_consecutive_losses<max_cons_losses))
     {
      maximum_consecutive_loss=max_cons_losses;
      maximum_consecutive_loss_usd=max_cons_losses_usd;
     }

   if(maximum_consecutive_wins<max_cons_wins ||
      (maximum_consecutive_wins==max_cons_wins && maximum_consecutive_wins_usd<max_cons_wins_usd))
     {
      maximum_consecutive_wins=max_cons_wins;
      maximum_consecutive_wins_usd=max_cons_wins_usd;
     }
   if(maximum_consecutive_profit_usd<max_cons_wins_usd ||
      (maximum_consecutive_profit_usd==max_cons_wins_usd && maximum_consecutive_profit<max_cons_wins))
     {
      maximum_consecutive_profit=max_cons_wins;
      maximum_consecutive_profit_usd=max_cons_wins_usd;
     }
   //average loss and profit
   if(max_cons_losses>0) {avg_loss+=max_cons_losses; avg_loss_cnt++;}
   if(max_cons_wins>0) {avg_win+=max_cons_wins; avg_win_cnt++;}
   average_consecutive_wins=(avg_win_cnt>0) ? round((double)avg_win/avg_win_cnt) : 0;
   average_consecutive_losses=(avg_loss_cnt>0) ? round((double)avg_loss/avg_loss_cnt) : 0;

   //number of profitable long and short positions
   long_positions_won=(long_positions>0) ?((double)long_positions_won/long_positions)*100.0 : 0;
   short_positions_won=(short_positions>0) ?((double)short_positions_won/short_positions)*100.0 : 0;
  }
5. バランスチャートを生成するためにグーグルチャートAPIを使用する
グーグルチャートAPI によって開発者は種々のタイプのダイヤグラムを手っ取り早く開発することができる。グーグルチャートAPIはグーグルのウエブサーバーの リソースへのリンク(URL) に保存されていて、正しくフォーマットされたリンク (URL)を受け取ると、ダイヤグラムを画像として戻す。
ダイヤグラム特性 (色、表題、軸、チャート上の点、など) はリンク(URL)によって指定される。結果のグラフはファイルシステムあるいはデータベースに保存できる。最もありがたいことはグーグルチャートAPIは無料で、アカウントを持つ必要も無く登録手続きも要らない。
GetChart() メソッドでグーグルからチャートを受け取り、 それをディスクに保存する。
#import "PNG_to_BMP.dll"//import of DLL with the function of conversion of PNG images to BMP
bool Convert_PNG(string src,string dst);
#import

#import "wininet.dll"//import DLL with the function for working with the internet
int InternetAttemptConnect(int x);
int InternetOpenW(string sAgent,int lAccessType,
                  string sProxyName="",string sProxyBypass="",
                  int lFlags=0);
int InternetOpenUrlW(int hInternetSession,string sUrl,
                     string sHeaders="",int lHeadersLength=0,
                     int lFlags=0,int lContext=0);
int InternetReadFile(int hFile,char &sBuffer[],int lNumBytesToRead,
                     int &lNumberOfBytesRead[]);
int InternetCloseHandle(int hInet);
#import

//+------------------------------------------------------------------+
///Function of creating a balance chart
//+------------------------------------------------------------------+
void Board::GetChart(int X_size,int Y_size,string request,string file_name)
  {
   if(X_size<1 || Y_size<1) return; //too small
   //try to create connection
   int rv=InternetAttemptConnect(0);
   if(rv!=0) {Alert("Error in call of the InternetAttemptConnect()"); return;}
   //initialize the structures
   int hInternetSession=InternetOpenW("Microsoft Internet Explorer", 0, "", "", 0);
   if(hInternetSession<=0) {Alert("Error in call of the InternetOpenW()"); return;}
   //send request
   int hURL=InternetOpenUrlW(hInternetSession, request, "", 0, 0, 0);
   if(hURL<=0) Alert("Error in call of the InternetOpenUrlW()");
   //file with the result
   CFileBin chart_file;
   //let's create it
   chart_file.Open(file_name+".png",FILE_BIN|FILE_WRITE);
   int dwBytesRead[1]; //number of data read
   char readed[1000];  //the data
   //read the data, returned by server after the request
   while(InternetReadFile(hURL,readed,1000,dwBytesRead))
     {
      if(dwBytesRead[0]<=0) break; //no data - exit
      chart_file.WriteCharArray(readed,0,dwBytesRead[0]); //write data to file
     }
   InternetCloseHandle(hInternetSession);//close connection
   chart_file.Close();//close file
   //******************************
   //prepare the paths for the converter
   CString src;
   src.Assign(TerminalInfoString(TERMINAL_PATH));
   src.Append("\MQL5\Files\\"+file_name+".png");
   src.Replace("\\","\\\\");
   CString dst;
   dst.Assign(TerminalInfoString(TERMINAL_PATH));
   dst.Append("\MQL5\Images\\"+file_name+".bmp");
   dst.Replace("\\","\\\\");
   //convert the file
   if(!Convert_PNG(src.Str(),dst.Str())) Alert("Error in call of the Convert_PNG()");
  }
API ウインドウのオンラインツールMQL5で作業するための詳細については記事 Using WinInet.dll for exchange data between terminals via the Internet(インターネット経由で端末間でデータを交換するためにWinInet.dll を使用する)で詳細を得ることができる。したがってこれについては時間を割かない。インポートしたファンクションConvert_PNG() はPNG画像をBMPに変換するために私が書いたものである。.
これはグーグルチャートがPNGあるいはGIFフォーマットで戻し、"graphic label" オブジェクトは BMP 画像のみを受け入れるためにため 必要となる。PNG_to_BMP.dll ライブラリーファンクション はアーカイブ DLL_Sources.zipで見つけることができる。
このファンクションはまた標準ライブラリを使ってラインとファイルを取り扱ういくつかの例も示している。CString class methods allow the performance of the same operations as String Functions . Class CFile is the base for CFileBin and CFileTxt classes. これらの助けを借りて、バイナリーやテキストのファイルをそれぞれ読み、保存することもできる。このメソッドは ファイルを取り扱うファンクションに似ている。
最後に、ファンクションCreateGoogleRequest ()について触れておく - これはバランス上のデータからクエリーを生成する。
//+------------------------------------------------------------------+
///Function for creating a request for the Google Charts server
//+------------------------------------------------------------------+
string Board::CreateGoogleRequest(int X_size,int Y_size,bool type)
  {
   if(X_size>1000) X_size=1000; //check the chart size
   if(Y_size>1000) Y_size=300;  //to make sure it is not too large
   if(X_size<1) X_size=1;       //and small//s18>
   if(Y_size<1) Y_size=1;
   if(X_size*Y_size>300000) {X_size=1000; Y_size=300;}//and fit the area
   CString res; //string with results
   if(type) //create request for the balance chart
     {
      //prepare the request
      res.Assign("http://chart.apis.google.com/chart?cht=lc&chs=");
      res.Append(IntegerToString(X_size));
      res.Append("x");
      res.Append(IntegerToString(Y_size));
      res.Append("&chd=t:");
      for(int i=0;i<ChartData.Total();i++)
         res.Append(DoubleToString(ChartData.At(i),2)+",");
      res.TrimRight(",");
      //sort array
      ChartData.Sort();
      res.Append("&chxt=x,r&chxr=0,0,");
      res.Append(IntegerToString(ChartData.Total()));
      res.Append("|1,");
      res.Append(DoubleToString(ChartData.At(0),2)+",");
      res.Append(DoubleToString(ChartData.At(ChartData.Total()-1),2));
      res.Append("&chg=10,10&chds=");
      res.Append(DoubleToString(ChartData.At(0),2)+",");
      res.Append(DoubleToString(ChartData.At(ChartData.Total()-1),2));
     }
   else //create request for the pie chart
     {
      //prepare the request
      res.Assign("http://chart.apis.google.com/chart?cht=p3&chs=");
      res.Append(IntegerToString(X_size));
      res.Append("x");
      res.Append(IntegerToString(Y_size));
      res.Append("&chd=t:");
      for(int i=0;i<pie_data.Total();i++)
         res.Append(IntegerToString(pie_data.Get_val(i))+",");
      res.TrimRight(",");
      res.Append("&chdl=");
      for(int i=0;i<pie_data.Total();i++)
         res.Append(pie_data.Get_symb(i)+"|");
      res.TrimRight("|");
      res.Append("&chco=");
      int cnt=0;
      for(int i=0;i<pie_data.Total();i++)
        {
         if(cnt>11) cnt=0;
         res.Append(colors[cnt]+"|");
         cnt++;
        }
      res.TrimRight("|");
     }
   return res.Str(); //return the result
  }
バランスチャートとパイチャートへの要求は別々に集めなければならないことに注意する。Append() メソッドは既存の行の最後にもう一つの行を加え、そしてTrimRight() メソッドは余分な文字を削除し、ラインの最後に表示することを可能にする。
6. 最終組み合わせとテスト
クラスは全てできているので、テストしてみよう。 OnInit () indicator:
から始めよう
Board *tablo;   //pointer to the board object
int prev_x_size=0,prev_y_size=0,prev_deals=0;
//+------------------------------------------------------------------+
//| Custom indicator initialization function                         |
//+------------------------------------------------------------------+
int OnInit()
  {
//--- indicator buffers mapping
   //set indicator short name
   IndicatorSetString(INDICATOR_SHORTNAME,"IT");
   //launch the timer
   EventSetTimer(1);
   //create object instance
   tablo=new Board;
   //and the interface
   tablo.CreateInterface();
   prev_deals=HistoryDealsTotal(); //number of deals
   //current sizes of the window
   prev_x_size=ChartGetInteger(0,CHART_WIDTH_IN_PIXELS);
   prev_y_size=ChartGetInteger(0, CHART_HEIGHT_IN_PIXELS);
//---
   return(0);
  }
ここで動的に ボードクラスのインスタンスを生成し、タイマーを起動し、追加変数を初期化する。
直ちに OnDeinit() ファンクションを置き、そこでオブジェクトを除去し(デストラクターを自動的に呼び出す)、そしてタイマーを停止させる。
void OnDeinit(const int reason)
{
   EventKillTimer(); //stop the timer
   delete table;    //and board
}
Function OnCalculate() will monitor the flow of new deals, tick by tick, and update the display, if this occurs:
int OnCalculate(const int rates_total,
                const int prev_calculated,
                const datetime &time[],
                const double &open[],
                const double &high[],
                const double &low[],
                const double &close[],
                const long &tick_volume[],
                const long &volume[],
                const int &spread[])
  {
//---
   //prepare the history
   HistorySelect(0,TimeCurrent());
   int deals=HistoryDealsTotal();
   //update the board if number of deals has changed
   if(deals!=prev_deals) tablo.Refresh();
   prev_deals=deals;
//--- return value of prev_calculated for next call
   return(rates_total);
  }
OnTimer() ファンクションはウインドウのサイズの変化を監視し、そして、もし必要であれば、ディスプレーのサイズをカスタム化し、 チックが1秒に1回より間隔が伸びる場合に OnCalculate()のようにディールを監視する。
void OnTimer()
  {
   int x_size=ChartGetInteger(0, CHART_WIDTH_IN_PIXELS);
   int y_size=ChartGetInteger(0, CHART_HEIGHT_IN_PIXELS);
   //update the board if window size has changed
   if(x_size!=prev_x_size || y_size!=prev_y_size) tablo.Refresh();
   prev_x_size=x_size;
   prev_y_size=y_size;
   //update the board if number of deals has changed
   HistorySelect(0,TimeCurrent());
   int deals=HistoryDealsTotal();
   if(deals!=prev_deals) tablo.Refresh();
   prev_deals=deals;
  }
インジケーターをコンパイルし実行させる:

図 3. テーブルの最終の姿
結論
読者の皆さんがこの記事を読み、何か新しいことを見つけられることを期待しています。 標準ライブラリのようなすばらしい道具の可能性の全てを皆様に紹介できるよう努めました。それは便利で、速く、高品質の処理を与えてくれるからです。もちろん、OOP(オブジェクト指向プログラミング)の知識を必要とします。.
それでは、成功を祈ります
始めるにはMQL5.rar のアーカイブを端末のフォルダーに展し、DLLの使用を許可します。アーカイブDLL_Sources.zip はライブラリー String_Metrics.dll PNG_to_BMP.dll を含んでいてそれらは私が GDIをインストールした上で Borland C++ Builder 環境で書いたものです。
MetaQuotes Ltdによってロシア語から翻訳されました。
元の記事: https://www.mql5.com/ru/articles/102
警告: これらの資料についてのすべての権利はMetaQuotes Ltd.が保有しています。これらの資料の全部または一部の複製や再プリントは禁じられています。
この記事はサイトのユーザーによって執筆されたものであり、著者の個人的な見解を反映しています。MetaQuotes Ltdは、提示された情報の正確性や、記載されているソリューション、戦略、または推奨事項の使用によって生じたいかなる結果についても責任を負いません。
 エキスパートアドバイザーの資金管理のためのファンクション
 MQL5でExpert Advisorを書くための初心者向けステップバイステップガイド
 MQL5における 20のトレードシグナル
 MQL5でのティックインディケーターの作成
- 無料取引アプリ
- 8千を超えるシグナルをコピー
- 金融ニュースで金融マーケットを探索
Евгений
とても興味深く、とても役に立つ可能性がある。
ご苦労様でした。
CTradeはどのクラスのものですか?
トレードクラスの宣言を見ています:
こんにちは、
良い例をありがとうございます。問題は、MT5の最後のアップデート後、winnetの機能が 動作しないことです。アクセス違反エラーが表示されます。
<vcl.h>はBorlandの仕様ですか? このファイルを持っていないのでコンパイルできません!