
구글 차트 API와 표준 라이브러리 클래스를 이용하여 정보 보드 만들기
시작하며
MQL5 언어의 프로그래머들의 삶을 풍요롭게 하기 위해, 디자이너들은 거의 모든 API MQL5 기능을 다루는 표준 라이브러리를 만들었고, 그들과 함께 작업하는 것을 훨씬 더 쉽고 편리하게 만들었습니다. 이 자료에서는 표준 라이브러리에서 사용하는 최대 클래스 수가 포함된 정보 게시판을 만들려고 합니다.
1. 표준 라이브러리 클래스 개요
이 라이브러리는 그래서 무엇인가? 홈페이지의 문서 파트는 이하로 구성되어있습니다:
모든 클래스의 코드를 포함하는 파일은 MQL5/Include 폴더에 있습니다. 라이브러리 코드를 볼 때 해당 코드는 클래스만 제공하고 기능은 제공하지 않는다는 것을 알 수 있습니다. 따라서 이를 사용하려면 객체 지향 프로그래밍(OOP)에 대한 지식이 어느정도는 있어야 합니다.
모든 라이브러리 클래스(거래 클래스 제외)는 기본 클래스 CObject에 기원을 두고 있습니다. 기본 클래스와 그 상속자들이 다 준비되어 있으니 - 지금부터 클래스 다이어그램을 만들어 볼 것입니다. MQL5 언어는 기본적으로 C++의 부분 집합이므로, IBM Rational Rose instrument를 사용하여 C++ 프로젝트의 역엔지니어링을 위한 도구를 다이어그램의 자동 구성에 사용해봅시다.
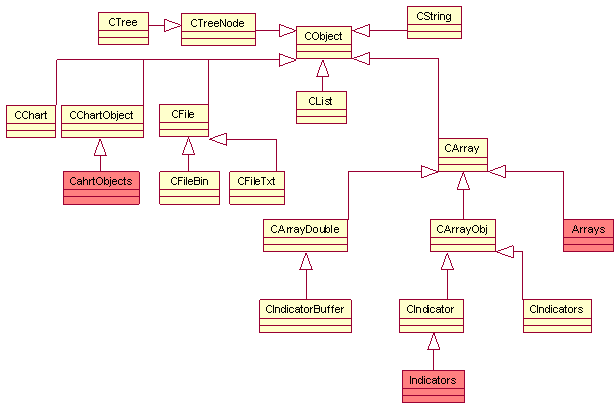
1번 그림. 표준 라이브러리 클래스 다이어그램
다이어그램이 많이 번잡해질 우려가 있기 때문에 클래스 특성과 메소드는 생략하겠습니다. 집계또한 중요치 않기 때문에 생략하겠습니다. 결과적으로, 우리는 클래스가 어떤 속성과 메소드를 얻을 수 있는 일반화(상속화)만 남게 됩니다.
본 다이어그램에서 볼 수 있는 것처럼 라이브러리에서 선, 파일, 차트, 그래픽 객체, 어레이를 다루는 컴포넌트는 CObject에서 상속받은 각자 고유의 기본 클래스 (각각, CString, CFile, CChart, CChartObject and CArray)를 지니고 있습니다. 인디케이터를 다루는 기본 클래스인 CIndicator 와 그 보조 CIndicators 클래스는 CArrayObj 에서 상속되었으며, 인디케이터 버퍼 클래스 CIndicatorBuffer 의 액세스는 CArrayDouble에서 상속되었습니다.
다이어그램에 선홍색으로 표시된 부분은 실제 클래스, 표시기, 배열 및 ChartObjects에 존재하지 않는 것을 표시하는데, 이는 표시기, 어레이 및 그래픽 객체로 작업하기 위한 클래스가 포함된 세트입니다. 그 수가 많고, 하나의 부모로부터 상속받은 것이기 때문에, 도표가 너무 지저분해지지 않도록 약간 간략하게 처리했습니다. 예를들어 이 인디케이터는 CiDEMA, CiStdDev, 등을 포함합니다.
Doxygen 문서화 시스템의 자동 생성을 사용하여 클래스 다이어그램을 구성할 수 있다는 점도 주목할 필요가 있습니다. Rational Rose에서 하는 것보다 이 시스템으로 하는 편이 좀 쉽네요. Doxygen에 대해 더알아보고 싶으시다면 MQL5 코드를 위한 자동생성 다큐멘테이션 문서를 참조하실 수 있습니다.
2. 문제점
표준 라이브러리 클래스의 최대 수를 가진 정보 테이블을 만들어 봅시다.
보드에 표시되는 내용은 무엇입니까? MetaTrader 5의 상세 보고서와 같은 것, 즉:

2번 그림. 상세 보고서의 외관
우리가 볼 수 있듯이, 그 보고서에는 잔액 차트와 몇몇 거래 수치가 표시됩니다. 이들 인디케이터를 계산하기 위한 메소드들에 대한 추가 정보는 What the Numbers in the Expert Testing Report Mean에서 확인할 수 있습니다.
이 보드는 순전히 정보 목적으로만 사용되며 어떠한 거래 작업도 수행하지 않기 때문에, 실제 차트를 닫는 것을 피하기 위해 별도의 창에서 인디케이터로 구현하는 것이 가장 좋을 것입니다. 또한 하위 창에 배치하면 쉽게 확장할 수 있고 마우스 한 번의 동작으로 보드를 닫을 수도 있습니다.
또한 전체 매매 수에 비해 기기에서 수행된 매매 수를 표시하는 파이 차트로 보고서를 보완할 수도 있습니다.
3. 인터페이스 디자인하기
지금까지 목표를 정했습니다 - 메인 차트의 하위 창에 상세한 보고서가 있어야할 것입니다.
정보 보드를 클래스로 구현해봅시다. 시작해보죠:
//+------------------------------------------------------------------+
///The Board class
//+------------------------------------------------------------------+
class Board
  {
//protected data
protected:
///number of the sub-window where the board will be stored
   int               wnd;
///array with the deals data
   CArrayObj        *Data;
///array with the balance data
   CArrayDouble      ChartData;
///array with elements of the interface
   CChartObjectEdit  cells[10][6];
///object for working with the chart
   CChart            Chart;
///object for working with the balance chart
   CChartObjectBmpLabel BalanceChart;
///object for working with the pie chart
   CChartObjectBmpLabel PieChart;
///data for the pie chart
   PieData          *pie_data;
//private data and methods
private:
   double            net_profit;      //these variables will store the calculated characteristics
   double            gross_profit;
   double            gross_loss;
   double            profit_factor;
   double            expected_payoff;
   double            absolute_drawdown;
   double            maximal_drawdown;
   double            maximal_drawdown_pp;
   double            relative_drawdown;
   double            relative_drawdown_pp;
   int               total;
   int               short_positions;
   double            short_positions_won;
   int               long_positions;
   double            long_positions_won;
   int               profit_trades;
   double            profit_trades_pp;
   int               loss_trades;
   double            loss_trades_pp;
   double            largest_profit_trade;
   double            largest_loss_trade;
   double            average_profit_trade;
   double            average_loss_trade;
   int               maximum_consecutive_wins;
   double            maximum_consecutive_wins_usd;
   int               maximum_consecutive_losses;
   double            maximum_consecutive_losses_usd;
   int               maximum_consecutive_profit;
   double            maximum_consecutive_profit_usd;
   int               maximum_consecutive_loss;
   double            maximum_consecutive_loss_usd;
   int               average_consecutive_wins;
   int               average_consecutive_losses;

   ///method of obtaining data about the deals and the balance
   void              GetData();

   ///method of calculating the characteristics
   void              Calculate();

   ///method of chart construction
   void              GetChart(int X_size,int Y_size,string request,string file_name);

   ///method of request to Google Charts API
   string            CreateGoogleRequest(int X_size,int Y_size,bool type);

  ///method of obtaining the optimum font size
   int               GetFontSize(int x,int y);
   string            colors[12];  //array with text presentation of colors
//public methods
public:
///constructor
   void              Board();
///destructor
   void             ~Board();
///method for board update
   void              Refresh();
///method for creating interface elements
   void              CreateInterface();
  };
보호된 클래스 데이터는 인터페이스 요소 및 거래, 균형 및 파이 차트 데이터입니다(PieData 클래스는 아래에서 설명). 거래 인디케이터와 일부 방법은 비공개입니다. 사용자가 직접 접근해서는 안 되고, 클래스 내에서 계산되어야하며, 적절한 퍼블릭 메소드를 호출해야만 계산되기 때문에 때문에 프라이빗입니다.
또한 인터페이스 생성 및 인디케이터 계산 메소드는 프라이빗입니다. 여기서는 일련의 엄격한 메소드 콜을 견뎌야 하기 때문입니다. 예를 들어, 계산을 위한 데이터가 없는 상태로 인디케이터를 계산하거나 인터페이스를 미리 만들지 않고 업데이트할 수는 없습니다. 따라서 유저가 "자폭하는 것"을 미연에 방지합니다.
한 클래스의 생성자와 소멸자를 즉시 처리하도록 합니다. 그러면 나중에 해당 클래스로 돌아갈 필요가 없습니다.
//+------------------------------------------------------------------+
///Constructor
//+------------------------------------------------------------------+
void Board::Board()
  {
   Chart.Attach();                               //attach the current chart to the class instance
   wnd=ChartWindowFind(Chart.ChartId(),"IT");    //find the indicator window
   Data = new CArrayObj;                         //creating the CArrayObj class instance
   pie_data=new PieData;                         //creating the PieData class instance
   //fill colors array
   colors[0]="003366"; colors[1]="00FF66"; colors[2]="990066";
   colors[3]="FFFF33"; colors[4]="FF0099"; colors[5]="CC00FF";
   colors[6]="990000"; colors[7]="3300CC"; colors[8]="000033";
   colors[9]="FFCCFF"; colors[10]="CC6633"; colors[11]="FF0000";
  }
//+------------------------------------------------------------------+
///Destructor
//+------------------------------------------------------------------+
void Board::~Board()
  {
   if(CheckPointer(Data)!=POINTER_INVALID) delete Data;   //delete the deals data
   if(CheckPointer(pie_data)!=POINTER_INVALID) delete pie_data;
   ChartData.Shutdown();    //and balance data
   Chart.Detach();          //detach from the chart
   for(int i=0;i<10;i++)    //delete all interface elements
      for(int j=0;j<6;j++)
         cells[i][j].Delete();
   BalanceChart.Delete();   //delete the balance chart
   PieChart.Delete();       //and pie chart
  }
생성자 내에서 Attach() 메소드의 도움을 받아 CChart 타입의 객체를 현재의 차트에 연결시킬 것입니다. 소멸자라고 불리는 Detach() 메소드는 차트와 객체 간의 연결을 끊을 것입니다. Data object, which is a pointer to an object of CArrayObj 타입 객체를 가리키는 포인터인 데이터 객체는 객체의 주소를 받아 능동적으로 새 오퍼레이션으로 생성 된 후 소멸자 내에서 삭제 오페라토를 이용하여 삭제됩니다. 삭제 전에 CheckPointer()를 이용하여객체가 존재하는지 확인하는 것을 잊지 마세요. 그렇지 않으면 에러가 발생할 것입니다.
CArrayObj 클래스에 대한 보다 자세한 정보 는 나중에 다시 나올 것입니다. CArrayDouble 클래스의 Shutdown() 메소드는 CArray 클래스 (클래스 다이어그램 참조) 에서 계승되는 다른 메소드들하고 다를 바 없이 객체가 차지하고있던 메모리를 비웁니다. CChartObject 클래스의 Delete() 메소드는 차트에서 객체를 삭제합니다.
따라서 생성자는 메모리를 할당하고 소멸자는 메모리를 해제하고 클래스에 의해 생성된 그래픽 개체를 제거합니다.
이제 인터페이스를 살펴보겠습니다. 위에서 설명한 대로 CreateInterface() 메소드는 보드의 인터페이스를 생성합니다.
//+------------------------------------------------------------------+
///CreateInterface function
//+------------------------------------------------------------------+
void Board::CreateInterface()
  {
   //retrieve the width
   int x_size=Chart.WidthInPixels();
   //and the height of the indicator window
   int y_size=Chart.GetInteger(CHART_HEIGHT_IN_PIXELS,wnd);

    //calculate, how much space will the balance chart take up
   double chart_border=y_size*(1.0-(Chart_ratio/100.0));

   if(Chart_ratio<100)//if the balance chart is taking up the entire table
     {
      for(int i=0;i<10;i++)//create columns
        {
         for(int j=0;j<6;j++)//and rows
           {
            cells[i][j].Create(Chart.ChartId(),"InfBoard "+IntegerToString(i)+" "+IntegerToString(j),
                               wnd,j*(x_size/6.0),i*(chart_border/10.0),x_size/6.0,chart_border/10.0);
            //set selectable property to false
            cells[i][j].Selectable(false);
            //set text as read only
            cells[i][j].ReadOnly(true);
            //set font size
            cells[i][j].FontSize(GetFontSize(x_size/6.0, chart_border/10.0));
            cells[i][j].Font("Arial");    //font name
            cells[i][j].Color(text_color);//font color
           }
        }
     }

   if(Chart_ratio>0)//if the balance chart is required
     {
      //create a balance chart
      BalanceChart.Create(Chart.ChartId(), "InfBoard chart", wnd, 0, chart_border);
      //set selectable property to false
      BalanceChart.Selectable(false);
      //create a pie chart
      PieChart.Create(Chart.ChartId(), "InfBoard pie_chart", wnd, x_size*0.75, chart_border);
      PieChart.Selectable(false);//set selectable property to false
     }

   Refresh();//refresh the board
  }
모든 요소를 촘촘하게 배열하려면 먼저 CChart 클래스의 WidthInPixels()와 GetInteger() 메소드를 사용하여 보드가 놓인 인디케이터 하위 창의 길이와 너비를 알아냅니다. 그 후 CChartObjectEdit 클래스 ("입력 창" 생성) 의 Create() 메소드를 이용하여 인디케이터의 값을 포함하는 셀을 만듭니다. 모든 자손이 CChartObject클래스의 본 메소드를 지니고 있습니다.
이 유형의 작업에 표준 라이브러리 를 사용하는 것이 얼마나 편리한지 알아두세요. 그것이 없다면, 우리는 ObjectCreate 함수를 사용하여 각 객체를 생성하고, ObjectSet과 같은 함수를 사용하여 객체의 속성을 설정해야 할 것이며, 이는 코드 이중화로 이어질 것입니다. 그리고 나중에 객체의 속성을 변경하고 싶을 때 혼란을 피하기 위해 객체의 이름을 신중하게 제어할 필요가 있습니다. 이제 우리는 단지 일련의 그래픽 객체를 만들어 우리가 원하는 대로 훑어볼 수 있습니다.
또한 CChartObject 클래스의 Color() 메소드처럼 클래스의 크리에이터가 오버로드된 경우 하나의 함수를 사용하여 개체의 속성을 가져오거나 설정할 수 있습니다. 패러미터를 사용하여 호출하면 패러미터 없이 해당 패러미터를 설정합니다. 객체 색을 반환합니다. 파이 차트를 밸런스 차트 옆에 두면 전체 화면 너비의 1/4을 차지하게 됩니다.
새로 고침 method()가 보드를 업데이트합니다. 이 업데이트는 무엇으로 구성됩니까? 인디케이터를 세어 그래픽 객체에 입력하고 보드의 크기를 조정해야 합니다. 만약 인디케이터가 위치한 창의 크기가 변경되었다면 말이죠. 보드가 창의 빈 공간 전체를 차지해야 합니다.
//+------------------------------------------------------------------+
///Function of the board updating
//+------------------------------------------------------------------+
void Board::Refresh()
  {
   //check the server connection status
   if(!TerminalInfoInteger(TERMINAL_CONNECTED)) {Alert("No connection with the trading server!"); return;}
   //check the permission for importing functions from DLL
   if(!TerminalInfoInteger(TERMINAL_DLLS_ALLOWED)) {Alert("DLLs are prohibited!"); return;}
   //calculate the characteristics
   Calculate();
   //retrieve the width
   int x_size=Chart.WidthInPixels();
   //and the height of the indicator window
   int y_size=Chart.GetInteger(CHART_HEIGHT_IN_PIXELS,wnd);
   //calculate how much space the balance chart will take up
   double chart_border=y_size*(1.0-(Chart_ratio/100.0));

   string captions[10][6]= //array with signatures of interface elements
     {
        {"Total Net Profit:"," ","Gross Profit:"," ","Gross Loss:"," "},
        {"Profit Factor:"," ","Expected Payoff:"," ","",""},
        {"Absolute Drawdown:"," ","Maximal Drawdown:"," ","Relative Drawdown:"," "},
        {"Total Trades:"," ","Short Positions (won %):"," ","Long Positions (won %):"," "},
        {"","","Profit Trades (% of total):"," ","Loss trades (% of total):"," "},
        {"Largest","","profit trade:"," ","loss trade:"," "},
        {"Average","","profit trade:"," ","loss trade:"," "},
        {"Maximum","","consecutive wins ($):"," ","consecutive losses ($):"," "},
        {"Maximal","","consecutive profit (count):"," ","consecutive loss (count):"," "},
        {"Average","","consecutive wins:"," ","consecutive losses:"," "}
     };

   //put the calculated characteristics into the array
   captions[0][1]=DoubleToString(net_profit, 2);
   captions[0][3]=DoubleToString(gross_profit, 2);
   captions[0][5]=DoubleToString(gross_loss, 2);

   captions[1][1]=DoubleToString(profit_factor, 2);
   captions[1][3]=DoubleToString(expected_payoff, 2);

   captions[2][1]=DoubleToString(absolute_drawdown, 2);
   captions[2][3]=DoubleToString(maximal_drawdown, 2)+"("+DoubleToString(maximal_drawdown_pp, 2)+"%)";
   captions[2][5]=DoubleToString(relative_drawdown_pp, 2)+"%("+DoubleToString(relative_drawdown, 2)+")";

   captions[3][1]=IntegerToString(total);
   captions[3][3]=IntegerToString(short_positions)+"("+DoubleToString(short_positions_won, 2)+"%)";
   captions[3][5]=IntegerToString(long_positions)+"("+DoubleToString(long_positions_won, 2)+"%)";

   captions[4][3]=IntegerToString(profit_trades)+"("+DoubleToString(profit_trades_pp, 2)+"%)";
   captions[4][5]=IntegerToString(loss_trades)+"("+DoubleToString(loss_trades_pp, 2)+"%)";

   captions[5][3]=DoubleToString(largest_profit_trade, 2);
   captions[5][5]=DoubleToString(largest_loss_trade, 2);

   captions[6][3]=DoubleToString(average_profit_trade, 2);
   captions[6][5]=DoubleToString(average_loss_trade, 2);

   captions[7][3]=IntegerToString(maximum_consecutive_wins)+"("+DoubleToString(maximum_consecutive_wins_usd, 2)+")";
   captions[7][5]=IntegerToString(maximum_consecutive_losses)+"("+DoubleToString(maximum_consecutive_losses_usd, 2)+")";

   captions[8][3]=DoubleToString(maximum_consecutive_profit_usd, 2)+"("+IntegerToString(maximum_consecutive_profit)+")";
   captions[8][5]=DoubleToString(maximum_consecutive_loss_usd, 2)+"("+IntegerToString(maximum_consecutive_loss)+")";

   captions[9][3]=IntegerToString(average_consecutive_wins);
   captions[9][5]=IntegerToString(average_consecutive_losses);

   if(Chart_ratio<100) //if the balance chart doesn't take up the entire table
     {
      for(int i=0;i<10;i++) //go through the interface elements
        {
         for(int j=0;j<6;j++)
           {
            //specify the position
            cells[i][j].X_Distance(j*(x_size/6.0));
            cells[i][j].Y_Distance(i*(chart_border/10.0));
            //the size
            cells[i][j].X_Size(x_size/6.0);
            cells[i][j].Y_Size(chart_border/10.0);
            //the text
            cells[i][j].SetString(OBJPROP_TEXT,captions[i][j]);
            //and font size
            cells[i][j].FontSize(GetFontSize(x_size/6.0,chart_border/10.0));
           }
        }
     }

   if(Chart_ratio>0)//if the balance chart is required
     {
      //refresh the balance chart
      int X=x_size*0.75,Y=y_size-chart_border;
      //get the chart
      GetChart(X,Y,CreateGoogleRequest(X,Y,true),"board_balance_chart");
      //set its position
      BalanceChart.Y_Distance(chart_border);
      //specify file names
      BalanceChart.BmpFileOn("board_balance_chart.bmp");
      BalanceChart.BmpFileOff("board_balance_chart.bmp");
      //refresh the pie chart
      X=x_size*0.25;
      //get the chart
      GetChart(X,Y,CreateGoogleRequest(X,Y,false),"pie_chart");
      //set its new position
      PieChart.Y_Distance(chart_border);
      PieChart.X_Distance(x_size*0.75);
      //specify file names
      PieChart.BmpFileOn("pie_chart.bmp");
      PieChart.BmpFileOff("pie_chart.bmp");
     }

   ChartRedraw(); //redraw the chart
  }
CreateInterface() 방법과 유사한 코드가 많이 있으며, 먼저 Calculate() 함수가 표시기를 계산한 다음 그래픽 객체에 입력되며, 동시에 개체 크기가 X_Size() 및 Y_Size() 메소드를 사용하여 창의 크기에 맞게 조정됩니다. X_Distance 및 Y_Distance 메소드는 객체의 위치를 변경합니다.
GetFontSize() 함수에 유의하여 글꼴 크기를 선택합니다. 이렇게 하면 텍스트가 크기를 조정한 후 컨테이너 테두리를 "넘치게" 하지 않으며, 반대로 너무 작아지지도 않습니다.
본 함수를 좀 더 자세히 살펴보겠습니다.
//import DLL function for string metrics
#import "String_Metrics.dll"
void GetStringMetrics(int font_size,int &X,int &Y);
#import

//+------------------------------------------------------------------+
///Function of determining the optimum font size
//+------------------------------------------------------------------+
int Board::GetFontSize(int x,int y)
  {
   int res=8;
   for(int i=15;i>=1;i--)//go through the different font sizes
     {
      int X,Y; //here we input the line metrics
      //determine the metrics
      GetStringMetrics(i,X,Y);
      //if the line fits the set borders - return the font size
      if(X<=x && Y<=y) return i;
     }
   return res;
  }
GetStringMetrics() 함수는 위에서 설명한 DLL에서 가져오며, 이 코드는 DLL_Source.zip 아카이브에서 찾을 수 있고, 또한 필요에 따라 수정할 수 있습니다. 프로젝트에서 인터페이스를 직접 설계하면 유용할 것 같습니다.
사용자 인터페이스 관련 설명은 이상이며, 이제 거래 인디케이터 계산으로 돌아갑시다.
4. 거래 인디케이터 계산
Calculate() 메소드는 계산을 수행합니다.
그러나 필요한 데이터를 수신하는 GetData() 메소드 또한 필요합니다.
//+------------------------------------------------------------------+
///Function of receiving the deals and balance data
//+------------------------------------------------------------------+
void Board::GetData()
  {
   //delete old data
   Data.Shutdown();
   ChartData.Shutdown();
   pie_data.Shutdown();
   //prepare all the deals history
   HistorySelect(0,TimeCurrent());
   CAccountInfo acc_inf;   //object for work with account
   //calculate the balance
   double balance=acc_inf.Balance();
   double store=0; //balance
   long_positions=0;
   short_positions=0;
   long_positions_won=0;
   short_positions_won=0;
   for(int i=0;i<HistoryDealsTotal();i++) //go through all of the deals in the history

     {
      CDealInfo deal;  //the information about the deals will be stored here
      deal.Ticket(HistoryDealGetTicket(i));//get deal ticket
      //if the trade had a financial result (exit of the market)
      if(deal.Ticket()>=0 && deal.Entry()==DEAL_ENTRY_OUT)
        {
         pie_data.Add(deal.Symbol()); //add data for the pie chart
         //check for the symbol
         if(!For_all_symbols && deal.Symbol()!=Symbol()) continue;
         double profit=deal.Profit(); //retrieve the trade profit
         profit+=deal.Swap();         //swap
         profit+=deal.Commission();   //commission
         store+=profit;               //cumulative profit
         Data.Add(new CArrayDouble);  //add new element to the array
         ((CArrayDouble *)Data.At(Data.Total()-1)).Add(profit);  //and data
         ((CArrayDouble *)Data.At(Data.Total()-1)).Add(deal.Type());
        }
     }

   //calculate the initial deposit
   double initial_deposit=(balance-store);
   for(int i=0;i<Data.Total();i++) //go through the prepared trades
     {
      //calculate the balance value
      initial_deposit+=((CArrayDouble *)Data.At(i)).At(0);
      ChartData.Add(initial_deposit); //and put it to the array
     }
  }
먼저, 데이터를 저장하는 메소드를 생각해 봅시다. 표준 라이브러리는 어레이를 쓰지 않아도 되도록 데이터 구조 클래스들을 제공합니다. 우리는 수익과 거래 유형에 대한 과거 데이터 또한 저장하는 2차원 어레이가 필요합니다. 하지만 표준 라이브러리로는 2차원 어레이를 정리하기 위한 외적 클래스가 지원되지 않습니다. 대신에 CArrayDouble (double 타입 어레이) 및 CArrayObj 클래스 ( CObject 클래스 인스턴스와 승계자들을 가리키는 포인터의 능동 어레이) 가 있습니다. 즉, double 타입의 어레이의 어레이를 만들 수 있습니다. 정확히 그렇게 하죠.
((CArrayDouble *) Data.At (Data.Total () - 1 )). Add (profit) 와 같은 코드는 data [i] [j] = profit 만큼 깔끔해보이진 않습니다만, 어디까지나 첫 눈에만 그런 겁니다. 결국 표준 라이브러리 클래스를 사용하지 않고 단순히 어레이를 선언함으로써 우리는 내장 메모리 관리자, 다른 어레이를 삽입할 수 있는 기능, 어레이 비교, 항목 찾기 등과 같은 이점을 잃게 됩니다. 그러므로 메모리 구성의 클래스를 사용하면 어레이의 오버플로를 제어할 필요로부터 해방되고 많은 유용한 기기를 제공할 수 있습니다.
CArray (1번 그림 참조) 의 Total() 메소드는 어레이 내의 요소 수를 반환하며, Add() 메소드는 그것들을 합치고 At() 메소드는 요소를 반환합니다.
파이 차트를 만들기로 결정했기 때문에 기호에 대한 거래 수를 표시하려면 필요한 데이터를 수집해야 합니다.
다음 데이터를 수집하기 위한 보조 클래스를 작성합니다:
//+------------------------------------------------------------------+
///The Pie chart class
//+------------------------------------------------------------------+
class PieData
  {
protected:
///number of deals per symbol
   CArrayInt         val;
///symbols
   CArrayString      symb;
public:
///delete the data
   bool Shutdown()
     {
      bool res=true;
      res&=val.Shutdown();
      res&=symb.Shutdown();
      return res;
     }
///search for a sting in the array
   int Search(string str)
     {  //check all array elements
      for(int i=0;i<symb.Total();i++)
         if(symb.At(i)==str) return i;
      return -1;
     }
///add new data
   void Add(string str)
     {
      int symb_pos=Search(str);//determine symbol position in the array
      if(symb_pos>-1)
         val.Update(symb_pos,val.At(symb_pos)+1);//update the deals data
      else //if there isn't such a symbol yet
        {
         symb.Add(str); //add it
         val.Add(1);
        }
     }

   int Total() const {return symb.Total();}
   int Get_val(int pos) const {return val.At(pos);}
   string Get_symb(int pos) const {return symb.At(pos);}
  };
표준 라이브러리 클래스가 항상 작업에 필요한 방법을 제공할 수 있는 것은 아닙니다. 본례에서는 CArrayString 클래스의 Search() 메소드는 적합하지 않습니다. 왜냐하면 이 클래스를 적용하려면 먼저 어레이를 분류해야 하고, 이는 데이터 구조를 위반하기 때문입니다. 그래서 우리는 우리만의 메소드를 써야합니다.
그 거래 특성의 계산은 Calculate() 메소드를 통해 이루어집니다:
//+------------------------------------------------------------------+
///Calculation of characteristics
//+------------------------------------------------------------------+
void Board::Calculate()
  {
   //get the data
   GetData();
   //zero all characteristics
   gross_profit=0;
   gross_loss=0;
   net_profit=0;
   profit_factor=0;
   expected_payoff=0;
   absolute_drawdown=0;
   maximal_drawdown_pp=0;
   maximal_drawdown=0;
   relative_drawdown=0;
   relative_drawdown_pp=0;
   total=Data.Total();
   long_positions=0;
   long_positions_won=0;
   short_positions=0;
   short_positions_won=0;
   profit_trades=0;
   profit_trades_pp=0;
   loss_trades=0;
   loss_trades_pp=0;
   largest_profit_trade=0;
   largest_loss_trade=0;
   average_profit_trade=0;
   average_loss_trade=0;
   maximum_consecutive_wins=0;
   maximum_consecutive_wins_usd=0;
   maximum_consecutive_losses=0;
   maximum_consecutive_losses_usd=0;
   maximum_consecutive_profit=0;
   maximum_consecutive_profit_usd=0;
   maximum_consecutive_loss=0;
   maximum_consecutive_loss_usd=0;
   average_consecutive_wins=0;
   average_consecutive_losses=0;

   if(total==0) return; //there isn't deals - return from the function
   double max_peak=0,min_peak=0,tmp_balance=0;
   int max_peak_pos=0,min_peak_pos=0;
   int max_cons_wins=0,max_cons_losses=0;
   double max_cons_wins_usd=0,max_cons_losses_usd=0;
   int avg_win=0,avg_loss=0,avg_win_cnt=0,avg_loss_cnt=0;

   for(int i=0; i<total; i++)
     {
      double profit=((CArrayDouble *)Data.At(i)).At(0); //get profit
      int deal_type=((CArrayDouble *)Data.At(i)).At(1); //and deal type
      switch(deal_type) //check deal type
        {
         //and calculate number of long and short positions
         case DEAL_TYPE_BUY: {long_positions++; if(profit>=0) long_positions_won++; break;}
         case DEAL_TYPE_SELL: {short_positions++; if(profit>=0) short_positions_won++; break;}
        }

      if(profit>=0)//the deal is profitable
        {
         gross_profit+=profit; //gross profit
         profit_trades++;      //number of profit deals
         //the largest profitable trade and the largest profitable series
         if(profit>largest_profit_trade) largest_profit_trade=profit;

         if(maximum_consecutive_losses<max_cons_losses ||
            (maximum_consecutive_losses==max_cons_losses && maximum_consecutive_losses_usd>max_cons_losses_usd))
           {
            maximum_consecutive_losses=max_cons_losses;
            maximum_consecutive_losses_usd=max_cons_losses_usd;
           }
         if(maximum_consecutive_loss_usd>max_cons_losses_usd ||
            (maximum_consecutive_loss_usd==max_cons_losses_usd && maximum_consecutive_losses<max_cons_losses))
           {
            maximum_consecutive_loss=max_cons_losses;
            maximum_consecutive_loss_usd=max_cons_losses_usd;
           }
         //average profit per deal
         if(max_cons_losses>0) {avg_loss+=max_cons_losses; avg_loss_cnt++;}
         max_cons_losses=0;
         max_cons_losses_usd=0;
         max_cons_wins++;
         max_cons_wins_usd+=profit;
        }
      else //deal is losing
        {
         gross_loss-=profit; //cumulative profit
         loss_trades++;      //number of losing deals
         //the most unprofitable deal and the most unprofitable series
         if(profit<largest_loss_trade) largest_loss_trade=profit;
         if(maximum_consecutive_wins<max_cons_wins ||
            (maximum_consecutive_wins==max_cons_wins && maximum_consecutive_wins_usd<max_cons_wins_usd))
           {
            maximum_consecutive_wins=max_cons_wins;
            maximum_consecutive_wins_usd=max_cons_wins_usd;
           }
         if(maximum_consecutive_profit_usd<max_cons_wins_usd ||
            (maximum_consecutive_profit_usd==max_cons_wins_usd && maximum_consecutive_profit<max_cons_wins))
           {
            maximum_consecutive_profit=max_cons_wins;
            maximum_consecutive_profit_usd=max_cons_wins_usd;
           }
         //average lose per deal
         if(max_cons_wins>0) {avg_win+=max_cons_wins; avg_win_cnt++;}
         max_cons_wins=0;
         max_cons_wins_usd=0;
         max_cons_losses++;
         max_cons_losses_usd+=profit;
        }

      tmp_balance+=profit; //absolute drawdown calculation
      if(tmp_balance>max_peak) {max_peak=tmp_balance; max_peak_pos=i;}
      if(tmp_balance<min_peak) {min_peak=tmp_balance; min_peak_pos=i;}
      if((max_peak-min_peak)>maximal_drawdown && min_peak_pos>max_peak_pos) maximal_drawdown=max_peak-min_peak;
     }
   //maximal drawdown calculation
   double min_peak_rel=max_peak;
   tmp_balance=0;
   for(int i=max_peak_pos;i<total;i++)
     {
      double profit=((CArrayDouble *)Data.At(i)).At(0);
      tmp_balance+=profit;
      if(tmp_balance<min_peak_rel) min_peak_rel=tmp_balance;
     }
   //relative drawdown calculation
   relative_drawdown=max_peak-min_peak_rel;
   //net profit
   net_profit=gross_profit-gross_loss;
   //profit factor
   profit_factor=(gross_loss!=0) ?  gross_profit/gross_loss : gross_profit;
   //expected payoff
   expected_payoff=net_profit/total;
   double initial_deposit=AccountInfoDouble(ACCOUNT_BALANCE)-net_profit;
   absolute_drawdown=MathAbs(min_peak);
   //drawdowns
   maximal_drawdown_pp=(initial_deposit!=0) ?(maximal_drawdown/initial_deposit)*100.0 : 0;
   relative_drawdown_pp=((max_peak+initial_deposit)!=0) ?(relative_drawdown/(max_peak+initial_deposit))*100.0 : 0;

   //profit and losing trade percentage
   profit_trades_pp=((double)profit_trades/total)*100.0;
   loss_trades_pp=((double)loss_trades/total)*100.0;

   //average profitable and losing deals
   average_profit_trade=(profit_trades>0) ? gross_profit/profit_trades : 0;
   average_loss_trade=(loss_trades>0) ? gross_loss/loss_trades : 0;

   //maximum consecutive losses
   if(maximum_consecutive_losses<max_cons_losses ||
      (maximum_consecutive_losses==max_cons_losses && maximum_consecutive_losses_usd>max_cons_losses_usd))
     {
      maximum_consecutive_losses=max_cons_losses;
      maximum_consecutive_losses_usd=max_cons_losses_usd;
     }
   if(maximum_consecutive_loss_usd>max_cons_losses_usd ||
      (maximum_consecutive_loss_usd==max_cons_losses_usd && maximum_consecutive_losses<max_cons_losses))
     {
      maximum_consecutive_loss=max_cons_losses;
      maximum_consecutive_loss_usd=max_cons_losses_usd;
     }

   if(maximum_consecutive_wins<max_cons_wins ||
      (maximum_consecutive_wins==max_cons_wins && maximum_consecutive_wins_usd<max_cons_wins_usd))
     {
      maximum_consecutive_wins=max_cons_wins;
      maximum_consecutive_wins_usd=max_cons_wins_usd;
     }
   if(maximum_consecutive_profit_usd<max_cons_wins_usd ||
      (maximum_consecutive_profit_usd==max_cons_wins_usd && maximum_consecutive_profit<max_cons_wins))
     {
      maximum_consecutive_profit=max_cons_wins;
      maximum_consecutive_profit_usd=max_cons_wins_usd;
     }
   //average loss and profit
   if(max_cons_losses>0) {avg_loss+=max_cons_losses; avg_loss_cnt++;}
   if(max_cons_wins>0) {avg_win+=max_cons_wins; avg_win_cnt++;}
   average_consecutive_wins=(avg_win_cnt>0) ? round((double)avg_win/avg_win_cnt) : 0;
   average_consecutive_losses=(avg_loss_cnt>0) ? round((double)avg_loss/avg_loss_cnt) : 0;

   //number of profitable long and short positions
   long_positions_won=(long_positions>0) ?((double)long_positions_won/long_positions)*100.0 : 0;
   short_positions_won=(short_positions>0) ?((double)short_positions_won/short_positions)*100.0 : 0;
  }
5. 구글 차트 API를 통해 잔고 차트 만들기
구글 차트 API 는 개발자들이 즉석에서 다양한 타입의 다이어그램을 만들 수 있게 해줍니다. 구글 차트 API는 Google 웹 서버의 리소스(URL) 링크에 저장되며, 올바른 형식의 링크(URL)를 수신하면 다이어그램을 이미지로 반환합니다.
다이어그램 특성(색상, 헤더, 축, 차트의 점 등)은 링크(URL)로 지정됩니다. 결과 이미지는 파일 시스템 또는 데이터베이스에 저장할 수 있습니다. 가장 좋은 점은 구글 차트 API는 공짜이며 계정을 딱히 가입하지 않아도 된다는 점입니다.
GetChart() 메소드는 구글에서 차트를 받아 디스크에 저장합니다.
#import "PNG_to_BMP.dll"//import of DLL with the function of conversion of PNG images to BMP
bool Convert_PNG(string src,string dst);
#import

#import "wininet.dll"//import DLL with the function for working with the internet
int InternetAttemptConnect(int x);
int InternetOpenW(string sAgent,int lAccessType,
                  string sProxyName="",string sProxyBypass="",
                  int lFlags=0);
int InternetOpenUrlW(int hInternetSession,string sUrl,
                     string sHeaders="",int lHeadersLength=0,
                     int lFlags=0,int lContext=0);
int InternetReadFile(int hFile,char &sBuffer[],int lNumBytesToRead,
                     int &lNumberOfBytesRead[]);
int InternetCloseHandle(int hInet);
#import

//+------------------------------------------------------------------+
///Function of creating a balance chart
//+------------------------------------------------------------------+
void Board::GetChart(int X_size,int Y_size,string request,string file_name)
  {
   if(X_size<1 || Y_size<1) return; //too small
   //try to create connection
   int rv=InternetAttemptConnect(0);
   if(rv!=0) {Alert("Error in call of the InternetAttemptConnect()"); return;}
   //initialize the structures
   int hInternetSession=InternetOpenW("Microsoft Internet Explorer", 0, "", "", 0);
   if(hInternetSession<=0) {Alert("Error in call of the InternetOpenW()"); return;}
   //send request
   int hURL=InternetOpenUrlW(hInternetSession, request, "", 0, 0, 0);
   if(hURL<=0) Alert("Error in call of the InternetOpenUrlW()");
   //file with the result
   CFileBin chart_file;
   //let's create it
   chart_file.Open(file_name+".png",FILE_BIN|FILE_WRITE);
   int dwBytesRead[1]; //number of data read
   char readed[1000];  //the data
   //read the data, returned by server after the request
   while(InternetReadFile(hURL,readed,1000,dwBytesRead))
     {
      if(dwBytesRead[0]<=0) break; //no data - exit
      chart_file.WriteCharArray(readed,0,dwBytesRead[0]); //write data to file
     }
   InternetCloseHandle(hInternetSession);//close connection
   chart_file.Close();//close file
   //******************************
   //prepare the paths for the converter
   CString src;
   src.Assign(TerminalInfoString(TERMINAL_PATH));
   src.Append("\MQL5\Files\\"+file_name+".png");
   src.Replace("\\","\\\\");
   CString dst;
   dst.Assign(TerminalInfoString(TERMINAL_PATH));
   dst.Append("\MQL5\Images\\"+file_name+".bmp");
   dst.Replace("\\","\\\\");
   //convert the file
   if(!Convert_PNG(src.Str(),dst.Str())) Alert("Error in call of the Convert_PNG()");
  }
API Windows 및 MQL5의 온라인 도구에 대한 자세한 내용은 인터넷 터미널 간 데이터 교환에 WinInet.dll 사용하기에서 확인할 수 있습니다. 그러므로 나는 이것에 시간을 할애하진 않겠습니다. 임포트한 함수 Convert_PNG()는 PNG 이미지를 BMP로 변환하기 위해 제가 작성한 것입니다.
구글차트가 PNG나 GIF 형식으로 차트를 반환하고, "그래픽 레이블" 개체는 BMP 이미지만 받아들이기 때문에 필요하죠. PNG_to_BMP.dll 라이브러리 함수의 코드는 DLL_Sources.zip 아카이브에서 찾아볼 수 있습니다.
이 함수는 표준 라이브러리를 사용하여 줄과 파일로 작업하는 몇 가지 예를 보여줍니다. CString 클래스 메소드는 스트링 함수와 동일한 작업을 수행할 수 있습니다. CFile 클래스는 CFileBin와 CFileTxt클래스의 베이스입니다. 그 덕택에, 우리는 각각 바이너리 파일과 텍스트 파일의 읽기 및 기록을 각각 생성할 수 있습니다. 이들 메소드는 파일 관리 함수들과 유사합니다.
마지막으로 CreateGoogleRequest () 함수를 설명하겠습니다 - 잔고 데이터에 대한 쿼리를 만듭니다.
//+------------------------------------------------------------------+
///Function for creating a request for the Google Charts server
//+------------------------------------------------------------------+
string Board::CreateGoogleRequest(int X_size,int Y_size,bool type)
  {
   if(X_size>1000) X_size=1000; //check the chart size
   if(Y_size>1000) Y_size=300;  //to make sure it is not too large
   if(X_size<1) X_size=1;       //and small//s18>
   if(Y_size<1) Y_size=1;
   if(X_size*Y_size>300000) {X_size=1000; Y_size=300;}//and fit the area
   CString res; //string with results
   if(type) //create request for the balance chart
     {
      //prepare the request
      res.Assign("http://chart.apis.google.com/chart?cht=lc&chs=");
      res.Append(IntegerToString(X_size));
      res.Append("x");
      res.Append(IntegerToString(Y_size));
      res.Append("&chd=t:");
      for(int i=0;i<ChartData.Total();i++)
         res.Append(DoubleToString(ChartData.At(i),2)+",");
      res.TrimRight(",");
      //sort array
      ChartData.Sort();
      res.Append("&chxt=x,r&chxr=0,0,");
      res.Append(IntegerToString(ChartData.Total()));
      res.Append("|1,");
      res.Append(DoubleToString(ChartData.At(0),2)+",");
      res.Append(DoubleToString(ChartData.At(ChartData.Total()-1),2));
      res.Append("&chg=10,10&chds=");
      res.Append(DoubleToString(ChartData.At(0),2)+",");
      res.Append(DoubleToString(ChartData.At(ChartData.Total()-1),2));
     }
   else //create request for the pie chart
     {
      //prepare the request
      res.Assign("http://chart.apis.google.com/chart?cht=p3&chs=");
      res.Append(IntegerToString(X_size));
      res.Append("x");
      res.Append(IntegerToString(Y_size));
      res.Append("&chd=t:");
      for(int i=0;i<pie_data.Total();i++)
         res.Append(IntegerToString(pie_data.Get_val(i))+",");
      res.TrimRight(",");
      res.Append("&chdl=");
      for(int i=0;i<pie_data.Total();i++)
         res.Append(pie_data.Get_symb(i)+"|");
      res.TrimRight("|");
      res.Append("&chco=");
      int cnt=0;
      for(int i=0;i<pie_data.Total();i++)
        {
         if(cnt>11) cnt=0;
         res.Append(colors[cnt]+"|");
         cnt++;
        }
      res.TrimRight("|");
     }
   return res.Str(); //return the result
  }
잔고 차트 및 원형 차트에 대한 요청은 별도로 수집됩니다. Append() 메소드는 현존하는 행의 끝에 새로운 행을 추가하며, TrimRight() 메소드는 행 끝에 표시되는 추가 문자를 제거하게 해줍니다.
6. 마지막 조립 및 테스팅
클래스가 완성되었으니 테스트해봅시다. OnInit () 인디케이터로 시작합니다:
Board *tablo;   //pointer to the board object
int prev_x_size=0,prev_y_size=0,prev_deals=0;
//+------------------------------------------------------------------+
//| Custom indicator initialization function                         |
//+------------------------------------------------------------------+
int OnInit()
  {
//--- indicator buffers mapping
   //set indicator short name
   IndicatorSetString(INDICATOR_SHORTNAME,"IT");
   //launch the timer
   EventSetTimer(1);
   //create object instance
   tablo=new Board;
   //and the interface
   tablo.CreateInterface();
   prev_deals=HistoryDealsTotal(); //number of deals
   //current sizes of the window
   prev_x_size=ChartGetInteger(0,CHART_WIDTH_IN_PIXELS);
   prev_y_size=ChartGetInteger(0, CHART_HEIGHT_IN_PIXELS);
//---
   return(0);
  }
여기서는 보드 클래스 인스턴스를 동적으로 생성하고, 타이머를 시작하고, 보조 변수를 초기화합니다.
바로 OnDeinit() 함수를 사용하여 객체(소멸자를 자동적으로 발동시키는)를 제거하고 타이머를 중지합니다:
void OnDeinit(const int reason)
{
   EventKillTimer(); //stop the timer
   delete table;    //and board
}
함수 OnCalculate()가 신규 거래의 흐름을 틱마다 모니터링하고 화면을 갱신합니다:
int OnCalculate(const int rates_total,
                const int prev_calculated,
                const datetime &time[],
                const double &open[],
                const double &high[],
                const double &low[],
                const double &close[],
                const long &tick_volume[],
                const long &volume[],
                const int &spread[])
  {
//---
   //prepare the history
   HistorySelect(0,TimeCurrent());
   int deals=HistoryDealsTotal();
   //update the board if number of deals has changed
   if(deals!=prev_deals) tablo.Refresh();
   prev_deals=deals;
//--- return value of prev_calculated for next call
   return(rates_total);
  }
OnTimer() 함수는 창의 크기 변화를 모니터링하고, 필요한 경우 디스플레이 크기를 수정하며, 틱 간 간극이 1초를 넘어가는 경우 OnCalculate()처럼 거래도 모니터링합니다.
void OnTimer()
  {
   int x_size=ChartGetInteger(0, CHART_WIDTH_IN_PIXELS);
   int y_size=ChartGetInteger(0, CHART_HEIGHT_IN_PIXELS);
   //update the board if window size has changed
   if(x_size!=prev_x_size || y_size!=prev_y_size) tablo.Refresh();
   prev_x_size=x_size;
   prev_y_size=y_size;
   //update the board if number of deals has changed
   HistorySelect(0,TimeCurrent());
   int deals=HistoryDealsTotal();
   if(deals!=prev_deals) tablo.Refresh();
   prev_deals=deals;
  }
인디케이터 컴파일 및 실행:

3번 그림. 테이블의 최종 모습
마치며
독자님께서 이 글을 읽으시면서 무언가 새로운 정보를 얻으셨길 빕니다. 표준 라이브러리의 무궁무진한 가능성의 일단이라도 느끼실 수 있도록 노력했습니다. 표준 라이브러리는 편하고, 빠르며, 아주 높은 퍼포먼스를 선보일 수 있기 때문입니다. 물론 객체 지향 프로그래밍의 지식이 조금 있으셔야겠지만 말입니다.
행운을 빕니다.
써보시려면 MQL5.rar 아카이브를 종단 폴더에 압축해제하시고 DLL 사용을 허가하셔야합니다. DLL_Sources.zip 아카이브엔 String_Metrics.dll PNG_to_BMP.dll와 같은 라이브러리들의 소스 코드가 포함되어있으며, 이들은 Borland C++ Builder 환경에서 설치된 GDI로 제가 쓴 것들입니다.
MetaQuotes 소프트웨어 사를 통해 러시아어가 번역됨.
원본 기고글: https://www.mql5.com/ru/articles/102
경고: 이 자료들에 대한 모든 권한은 MetaQuotes(MetaQuotes Ltd.)에 있습니다. 이 자료들의 전부 또는 일부에 대한 복제 및 재출력은 금지됩니다.
이 글은 사이트 사용자가 작성했으며 개인의 견해를 반영합니다. Metaquotes Ltd는 제시된 정보의 정확성 또는 설명 된 솔루션, 전략 또는 권장 사항의 사용으로 인한 결과에 대해 책임을 지지 않습니다.
 Expert Advisor에서의 자금 관리용 함수들
 초보자를 위한 MQL5 Expert Advisor 코드 작성 가이드
 다른 인디케이터 기반으로 인디케이터를 쓰는 방법에 관하여
 MetaTrader5가 주는 새로운 기회
Евгенй
매우 흥미롭고 잠재적으로 매우 유용합니다.
노력해 주셔서 감사합니다.
CTrade는 어떤 클래스에서 시작되나요?
트레이딩 클래스 선언을 살펴보고 있습니다:
안녕하세요,
좋은 예제 주셔서 감사합니다. 제가 가진 문제는 마지막 MT5 업데이트 후 위넷 기능이 작동하지 않는다는 것입니다. 액세스 위반 오류가 표시되고 있습니다. 이 오류를 극복했는지 알려주세요.
<vcl.h>는 볼랜드의 특정 파일입니까? 이 파일이 없기 때문에 컴파일하지 않습니다!