R Stoploss Signals

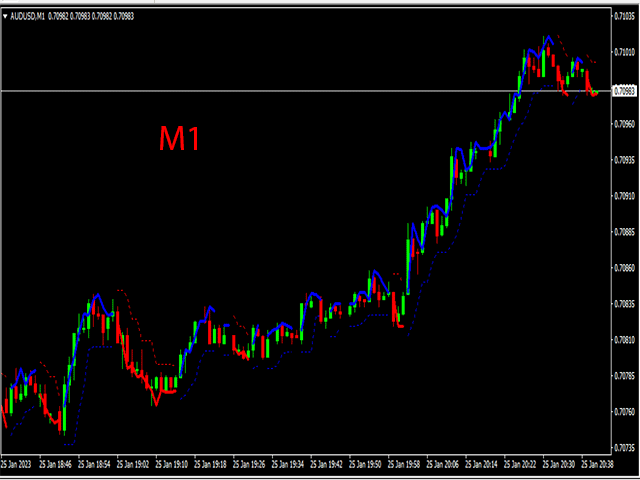
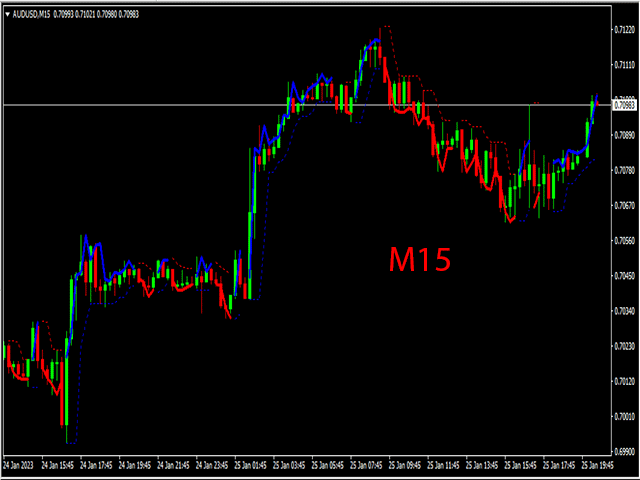
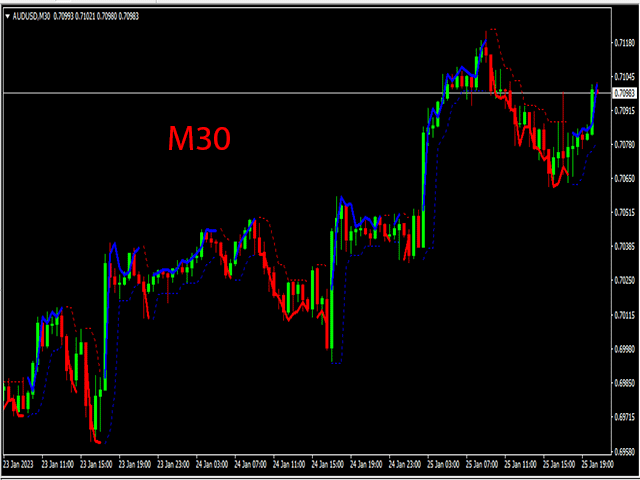
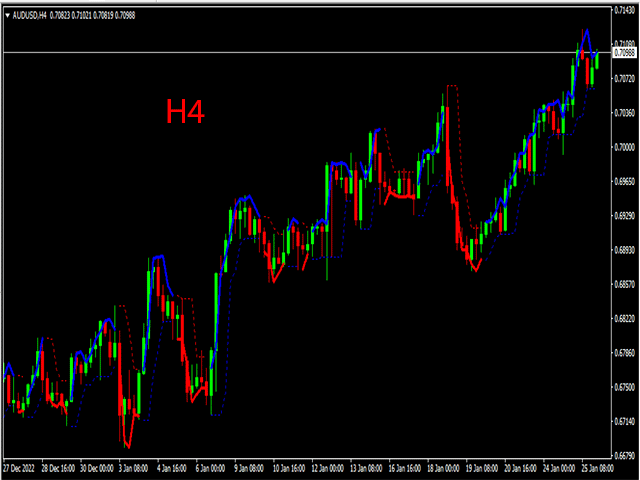
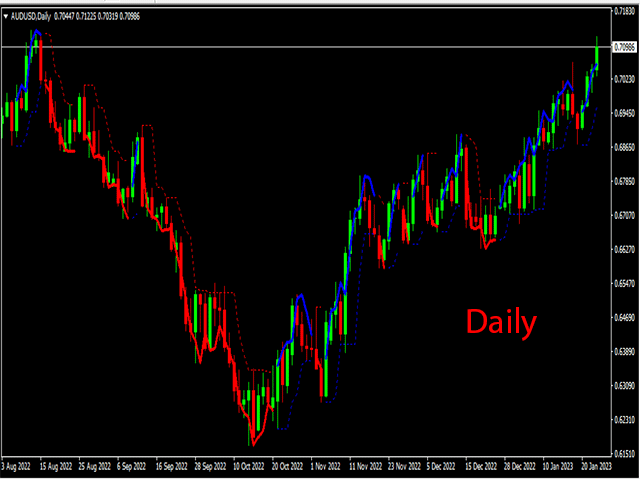
The R Stoploss Signals indicator is based on a trend following exponential moving average.

This forex indicator generates buy and sell trading signals in the form of blue and red lines drawn on the activity chart.

  • Blue colored lines indicate the trend is upwards and this is a signal to buy the currency pair.
  • Red colored lines indicate the trend is downwards and this is a signal to sell the currency pair.

A suggested stop-loss line is also included with this forex indicator.

  • For buy signals, put the stop-loss 1 pip below the blue stop-loss line and trail it up.
  • For sell signals, put the stop-loss 1 pip above the red stop-loss line and trail it down.

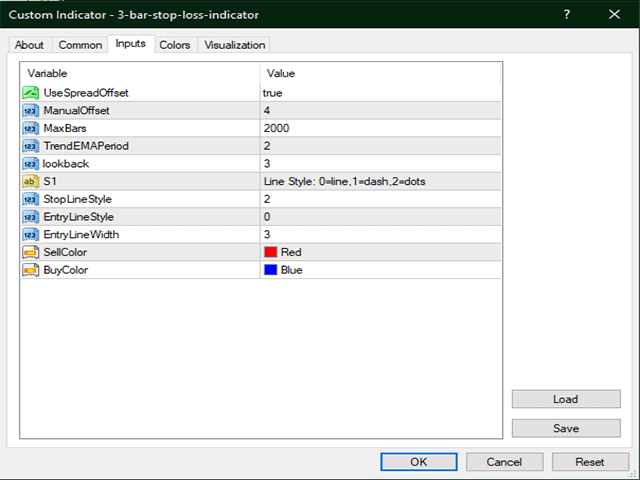
The default indicator input settings including the Trend EMA Period can be changed directly from the indicator’s inputs tab.

Basic Trading Signals

Signals from the R Stoploss Signals indicator are easy to interpret and goes as follows:

  1. Buy Signal: Initiate a buy trade when the R Stoploss Signals indicator starts painting a blue line.
  2. Sell Signal: Initiate a sell trade when the R Stoploss Signals indicator starts painting a red line.
  3. Trade Exit: Close the open trade when an opposite signal occurs, or use your own method of trade exit.

Characteristics

Currency pairs: Any

Platform: Metatrader 4

Customization options: Variable (TrendEMAPeriod, StopLineStyle, EntryLineStyle, SellColor, BuyColor) Colors, width & Style.

Time frames: 1-Minute, 5-Minutes, 15-Minutes, 30-Minutes, 1-Hour, 4-Hours, 1-Day, 1-Week, 1-Month

Type: Trend


Recommended products
EZZ Zig Zag MT4
Paulo Rocha
5 (1)
EZZ Elite Zig Zag is an indicator for the MetaTrader 4 terminal. This indicator traces the peak of the trend based on the market reversal, thus showing various opportunities in the financial market. EZZ Elite Zig Zag is a visual tool, intuitive, and easy to understand and use.  Test it Yourself by Downloading it for Free. Author Paulo Rocha all rights reserved
Daily Candle Predictor is an indicator that predicts the closing price of a candle. The indicator is primarily intended for use on D1 charts. This indicator is suitable for both traditional forex trading and binary options trading. The indicator can be used as a standalone trading system, or it can act as an addition to your existing trading system. This indicator analyzes the current candle, calculating certain strength factors inside the body of the candle itself, as well as the parameters of
RiverScope Lite automatically determines the nearest most important price levels and support and resistance zones in history, it also identifies a large number of price action patterns (the lite version is limited to 10, while the full version has 30+). The support and resistance levels are determined based on an algorithm that calculates and filters the historical values of the price, its movement character, volumes, etc. It displays the current situation, therefore the nearest levels change in
Blahtech Market Profile
Blahtech Limited
4.53 (15)
Was: $249  Now: $99   Market Profile defines a number of day types that can help the trader to determine market behaviour. A key feature is the Value Area, representing the range of price action where 70% of trading took place. Understanding the Value Area can give traders valuable insight into market direction and establish the higher odds trade. It is an excellent addition to any system you may be using. Blahtech Limited presents their Market Profile indicator for the MetaTrader community. Ins
The indicator builds current quotes, which can be compared with historical ones and on this basis make a price movement forecast. The indicator has a text field for quick navigation to the desired date. Options: Symbol - selection of the symbol that the indicator will display; SymbolPeriod - selection of the period from which the indicator will take data; IndicatorColor - indicator color; Inverse - true reverses quotes, false - original view; Next are the settings of the text field, in w
Introduction It is common practice for professional trades to hide their stop loss / take profit from their brokers. Either from keeping their strategy to the themselves or from the fear that their broker works against them. Using this indicator, the stop loss / take profit points will be drawn on the product chart using the bid price. So, you can see exactly when the price is hit and close it manually.  Usage Once attached to the chart, the indicator scans the open orders to attach lines for t
Description The Market Profile & Volume Profile Indicator is a powerful technical analysis tool designed to visualize market activity and price distribution over specific timeframes. Unlike standard technical indicators that focus solely on price over time, this indicator organizes price data to show where the market spent the most time (TPO) and where the most volume was traded (Volume Profile). It automatically calculates and displays key structural levels such as the Point of Control (POC) ,
Quantum Currency Strength Indicator
QUANTUM TRADING SOFTWARE LIMITED
Your success as a forex trader depends on being able to identify when a currency or currency pair is oversold or overbought. If it is strong or weak. It is this concept which lies at the heart of forex trading. Without the Quantum Currency Strength indicator, it is almost impossible. There are simply too many currencies and too many pairs to do this quickly and easily yourself. You need help! The Quantum Currency Strength indicator has been designed with one simple objective in mind. To give you
The indicator allows you to trade binary options. The recommended time frame is М1 and the expiration time is 1,2,3 minutes. The indicator suitable for auto and manual trading. A possible signal is specified as a arrows above/under a candle. You should wait until the candle closes! Arrows are not re-painted Trade sessions: TOKYO section (Half-end) Currency pairs: USD/JPY Working time frame: M1 Expiration time: 1,2,3 minutes. The indicator also shows good results when using the martingale strateg
FREE
We present you the indicator "Candle closing counter", which will become your indispensable assistant in the world of trading. That’s why knowing when the candle will close can help: If you like to trade using candle patterns, you will know when the candle will be closed. This indicator will allow you to check if a known pattern has formed and if there is a possibility of trading. The indicator will help you to prepare for market opening and market closure. You can set a timer to create a pre
Title : Market Bias Indicator - Oscillator-Based Trading Tool Introduction : Discover the potential of the "Market Bias Indicator," a revolutionary oscillator-based trading tool designed for precise market analysis. If you're in search of a robust alternative to traditional bias indicators, your quest ends here. Market Bias Indicator offers unparalleled accuracy in identifying market sentiment and is your gateway to confident trading decisions. Recommended Trading Pairs : Market Bias Indicator i
Owl smart levels
Sergey Ermolov
4.26 (38)
MT5 version  |  FAQ The Owl Smart Levels Indicator  is a complete trading system within the one indicator that includes such popular market analysis tools as  Bill Williams' advanced fractals , Valable ZigZag which builds  the correct wave structure  of the market, and  Fibonacci levels  which mark the exact levels of entry into the market and places to take profits. Detailed description of the strategy Instructions for working with the indicator Advisor-assistant in trading Owl Helper Private
Volume Compair
Thiago Pereira Pinho
Professional Cumulative Delta & Volume Median Indicator Track   real buying/selling pressure   with this powerful volume analysis tool. The   Volume Compare Indicator   combines   Cumulative Delta   and   Volume Medians   to help you identify institutional activity, imbalances, and potential reversals. Key Features: Cumulative Delta Histogram   – Visualizes net buying vs. selling volume in real-time. Buy/Sell Volume Medians   – Horizontal lines showing average buy & sell volume levels. Smart Vo
Heiken Ashi candle chart is an improved version of The Japanese candle chart, which can effectively filter the market "noise" of the Japanese candle chart. It is favored by many traders for its simplicity and intuition. For trend traders, the HA candle chart is a magic tool. Unlike the traditional Japanese candle chart, Heikenashi does not reflect the opening price, high price, low price and closing price of the market. Instead, Heikenashi calculates the value of a single K line in the dominant
Price Grid Navigator Indicator The   Price Grid Navigator   is a powerful and intuitive trading tool designed to help traders identify key   support and resistance levels   dynamically. It provides clear visual cues for potential   entry points,   exit points, and   reversal zones, making it an essential tool for traders of all experience levels. By dynamically calculating and plotting these levels, the indicator provides traders with a clear visual representation of potential entry points, exit
FREE
Quantum Currency Array Indicator
QUANTUM TRADING SOFTWARE LIMITED
This indicator has been developed to identify and display these trends quickly and easily, allowing you to see instantly, those currency pairs which are trending, and those which are not – and in all timeframes, with just one click. The 28 currency pairs are displayed as a fan as they sweep from strong to weak and back again, and this is why we call it the ‘currency array’. All 28 pairs are arrayed before you, giving an instant visual description of those pairs that are trending strongly, those
Fibonacci retracement and extension line drawing tool Fibonacci retracement and extended line drawing tool for MT4 platform is suitable for traders who use  golden section trading Advantages: There is no extra line, no too long line, and it is easy to observe and find trading opportunities Trial version: https://www.mql5.com/zh/market/product/35884 Main functions: 1. Multiple groups of Fibonacci turns can be drawn directly, and the relationship between important turning points can be seen
It will be the best tool for you to make a profit! Through unique algorithms You're going to see an amazing amount of right trading signals Make huge profits every day and realize more possibilities!   Like the car no money to buy it, the love of the girls dare not to pursue?Or the credit card bill is not paid, the rent does not have the extra money to settle?Or are you fed up with being bossed around by your boss and Hope to get more people's respect?Can't afford to buy the things you want ? wa
Pair Spread Indicator
Vladislav Ostashenkov
Pair Spread Indicator The indicator shows the difference in price between the two instruments. : Graph in the form of a histogram of the difference in price between the two instruments in a separate window. Ideal for related tools for example:  BRN -- WTI,   GOLD -- 50* Silver, DJ -- 14*S&P500, etc; Calculation method: closing price (open, high, low) N-bars back; Moving average on the histogram; Averaging options for the moving average: simple, exponential, smoothed, etc; The negative coefficie
Price Magnet — Price Density and Attraction Levels Indicator Price Magnet is a professional analytical tool designed to identify key support and resistance levels based on statistical Price Density. The indicator analyzes a specified historical period and detects price levels where the market spent the most time. These zones act as “magnets,” attracting price action or forming a structural base for potential reversals. Unlike traditional Volume Profile tools, Price Magnet focuses on price-time d
The Super Arrow Indicator provides non-repainting buy and sell signals with exceptional accuracy. Key Features No repainting – confirmed signals remain fixed Clear visual arrows: green for buy, red for sell Real-time alerts via pop-up, sound, and optional email Clean chart view with no unnecessary clutter Works on all markets: Forex, gold, oil, indices, crypto Adjustable Parameters TimeFrame Default: "current time frame" Function: Sets the time frame for indicator calculation Options: Can be set
Atomic CHOCH BOS Trend Indicator v1.4 TRADING AUTOMATION EXPERTS - MT4 tools designed to enhance trader performance. Master the Smart Money Strategy with Precision _____________________________________________________________________________________________________________________________________________________________________________ Smart Market Structure Analysis Unlock the power of smart market structure analysis with the Atomic Break of Structure Change of Character (CHOCH) / Break of Str
Smart Moving Average MT4
Mostafa Saad Saeed Shawara
Product Title Smart Moving Averages (MT4) – part of the SmartView series Short Description A Moving Averages indicator with a unique user experience on MetaTrader platform. Features advanced capabilities not previously available, such as opening settings with double-click, hiding and showing indicators without deleting them, and displaying indicator windows at full chart size. Designed to work seamlessly with the rest of the SmartView Indicators series. Overview The SmartView series offers a uni
FREE
Alpha Trend sign has been a very popular trading tool in our company for a long time. It can verify our trading system and clearly indicate trading signals, and the signals will not drift. Main functions: Based on the market display of active areas, indicators can be used to intuitively determine whether the current market trend belongs to a trend market or a volatile market. And enter the market according to the indicator arrows, with green arrows indicating buy and red arrows indicating se
Noize Absorption Index MT4
Ekaterina Saltykova
5 (1)
Noize Absorption Index - is the manual trading system that measures the difference of pressure between bears forces and bulls forces. Green line - is a noize free index that showing curent situation. Zero value of index shows totally choppy/flat market.Values above zero level shows how powerfull bullish wave is and values below zero measures bearish forces.Up arrow appears on bearish market when it's ready to reverse, dn arrow appears on weak bullish market, as a result of reverse expectation. S
Deal Trading Trend
Sukunthakan Ngernbamrung
Simple Trading System Update !!! Follow this link to see our 2024 Strategy !!!   ( Download the EAs scanner ) Deal trading trend indicator is a useful indicator tool predicting the market movement, easy-to-use due to obviously showing trend line, arrow and target point. You can consider the direction of the market for going up or going down by using this indicator. Parameters In this section, we are explaining the main parameters including; Period bar   :   The number of history bars are used
Be notified of every color change of Heiken Ashi (HA) candles. The indicator will trigger past and new signals every time that HA candles change their colors. Note : this tool is based on the code of Heiken Ashi indicator developed by MetaQuotes Software Corp. Features The signals are triggered at closing of last bar/opening of a new bar; Any kind of alerts can be enabled: Dialog Box, Email message, SMS notifications for smartphones and tablets, and Sound alerts; By default, up arrows are plott
The   Strategy Tester   product is an indicator where you can both test and run strategies. There are 64 strategies in total in this indicator. It uses 3 indicators. You can test tens of thousands of strategies by changing the parameter settings of these indicators. You can run 6 strategies at the same time. With this product, you will now create your own signals. Recommendations and Features Used indicators:   Rsi, Bears power, Stochastic It works on all   time frame   Recommended time frame
VR Grid
Vladimir Pastushak
5 (3)
The VR Grid indicator is designed to create a graphical grid with user-defined settings. Unlike the standard grid , VR Grid is used to build circular levels . Depending on the user's choice, the step between the round levels can be arbitrary. In addition, unlike other indicators and utilities, VR Grid maintains the position of the grid even when the time period changes or the terminal is rebooted. You can find settings, set files, demo versions, instructions, problem solving, at [blog] You can
FREE
The "MR Volume Profile Rectangles 4" indicator is a charting tool that displays trading volume at different price levels rather than time intervals. A key concept in volume profile is the point of control (POC) —the price level with the highest volume traded during the session or time range. While tools like VWAP or OBV provide volume trends, the "MR Volume Profile Rectangles 4" indicator offers granular detail about where the most market activity occurs at specific price levels. This makes it a
Buyers of this product also purchase
Gann Made Easy
Oleg Rodin
4.83 (155)
Gann Made Easy is a professional and easy to use Forex trading system which is based on the best principles of trading using the theory of W.D. Gann. The indicator provides accurate BUY and SELL signals including Stop Loss and Take Profit levels. You can trade even on the go using PUSH notifications. PLEASE CONTACT ME AFTER PURCHASE TO GET TRADING TIPS, BONUSES  AND GANN EA ASSISTANT + MT5 VERSION OF THE GANN MADE EASY INDICATOR  FOR FREE! Probably you already heard about the Gann trading method
GOLD Impulse with Alert
Bernhard Schweigert
4.64 (11)
This indicator is a super combination of our 2 products  Advanced Currency IMPULSE with ALERT  and  Currency Strength Exotics . It works for all time frames and shows graphically impulse of strength or weakness for the 8 main currencies plus one Symbol! This Indicator is specialized to show currency strength acceleration for any symbols like Gold, Exotic Pairs, Commodities, Indexes or Futures. Is first of its kind, any symbol can be added to the 9th line to show  true currency strength accelerat
Game Changer Indicator
Vasiliy Strukov
4.4 (20)
Game Changer is a revolutionary trend indicator designed to be used on any financial instrument to transform your metatrader in a powerful trend analyzer.   It works on any time frame and assists in trend identification, signals potential reversals, serves as a trailing stop mechanism, and provides real-time alerts for prompt market responses.  Whether you’re a seasoned, professional or a beginner seeking an edge, this tool empowers you to trade with confidence, discipline and a clear understand
RFI levels PRO
Roman Podpora
5 (1)
The indicator accurately shows the reversal points and price return zones where the   Major players . You see where new trends are forming and make decisions with maximum precision, maintaining control over every trade. VERSION MT5     -     Reveals its maximum potential when combined with the   TREND LINES PRO   indicator What the indicator shows: Reversal structures and reversal levels with activation at the beginning of a new trend. Display of   TAKE PROFIT   and   STOP LOSS   levels with mi
Scalper Inside PRO
Alexey Minkov
4.74 (69)
An exclusive indicator that utilizes an innovative algorithm to swiftly and accurately determine the market trend. The indicator automatically calculates opening, closing, and profit levels, providing detailed trading statistics. With these features, you can choose the most appropriate trading instrument for the current market conditions. Additionally, you can easily integrate your own arrow indicators into Scalper Inside Pro to quickly evaluate their statistics and profitability. Scalper Inside
Miraculous Indicator – 100% Non-Repaint Forex and Binary Tool Based on Gann Square of Nine This video introduces the Miraculous Indicator , a highly accurate and powerful trading tool specifically developed for Forex and Binary Options traders. What makes this indicator unique is its foundation on the legendary Gann Square of Nine and Gann's Law of Vibration , making it one of the most precise forecasting tools available in modern trading. The Miraculous Indicator is fully non-repaint, meaning t
Trend Lines PRO
Roman Podpora
5 (1)
TREND LINES PRO    helps understand where the market is truly changing direction. The indicator shows real trend reversals and points where major players re-enter. You see   BOS lines   Trend changes and key levels on higher timeframes — without complex settings or unnecessary noise. Signals don't repaint and remain on the chart after the bar closes. VERSION MT 5     -     Reveals its maximum potential when paired with the   RFI LEVELS PRO  indicator What the indicator shows: Real shifts   tren
Currency Strength Wizard is a very powerful indicator that provides you with all-in-one solution for successful trading. The indicator calculates the power of this or that forex pair using the data of all currencies on multiple time frames. This data is represented in a form of easy to use currency index and currency power lines which you can use to see the power of this or that currency. All you need is attach the indicator to the chart you want to trade and the indicator will show you real str
M1 Sniper
Oleg Rodin
5 (19)
M1 SNIPER is an easy to use trading indicator system. It is an arrow indicator which is designed for M1 time frame. The indicator can be used as a standalone system for scalping on M1 time frame and it can be used as a part of your existing trading system. Though this trading system was designed specifically for trading on M1, it still can be used with other time frames too. Originally I designed this method for trading XAUUSD and BTCUSD. But I find this method helpful in trading other markets a
Currency Strength Exotics
Bernhard Schweigert
4.88 (33)
CURRENTLY 20% OFF ! Best Solution for any Newbie or Expert Trader! This Indicator is specialized to show currency strength for any symbols like Exotic Pairs Commodities, Indexes or Futures. Is first of its kind, any symbol can be added to the 9th line to show true currency strength of Gold, Silver, Oil, DAX, US30, MXN, TRY, CNH etc. This is a unique, high quality and affordable trading tool because we have incorporated a number of proprietary features and a new formula. Imagine how your trading
Precautions for subscribing to indicator This indicator only supports the computer version of MT4 Does not support MT5, mobile phones, tablets The indicator only shows the day's entry arrow The previous history arrow will not be displayed (Live broadcast is for demonstration) The indicator is a trading aid Is not a EA automatic trading No copy trading function The indicator only indicates the entry position No exit (target profit)  The entry stop loss point is set at 30-50 PIPS Or the front hi
Are you looking for a simple and reliable indicator that can help you spot market swing points easily? Do you want clear buy and sell signals that work on any timeframe and any trading instrument? Buy Sell Signal Pro is designed to do exactly that. It helps traders identify important market turning points and understand the current market structure in a clear and easy way. This indicator detects Higher Highs (HH), Higher Lows (HL), Lower Highs (LH), and Lower Lows (LL) so you can quickly see wh
Trading Special – 40% OFF Best Solution for any Newbie or Expert Trader! This dashboard software is working on 28 currency pairs plus one. It is based on 2 of our main indicators (Advanced Currency Strength 28 and Advanced Currency Impulse). It gives a great overview of the entire Forex market plus Gold or 1 indices. It shows Advanced Currency Strength values, currency speed of movement and signals for 28 Forex pairs in all (9) timeframes. Imagine how your trading will improve when you can watch
Volatility Trend System - a trading system that gives signals for entries. The volatility system gives linear and point signals in the direction of the trend, as well as signals to exit it, without redrawing and delays. The trend indicator monitors the direction of the medium-term trend, shows the direction and its change. The signal indicator is based on changes in volatility and shows market entries. The indicator is equipped with several types of alerts. Can be applied to various trading ins
Dynamic Forex28 Navigator
Bernhard Schweigert
4.43 (7)
Specials Discount now. The Next Generation Forex Trading Tool. Dynamic Forex28 Navigator is the evolution of our long-time, popular indicators, combining the power of three into one: Advanced Currency Strength28 Indicator (695 reviews) + Advanced Currency IMPULSE with ALERT (520 reviews) + CS28 Combo Signals (recent Bonus) Details about the indicator  https://www.mql5.com/en/blogs/post/758844 What Does The Next-Generation Strength Indicator Offer? Everything you loved about the originals, now
PRO Renko System
Oleg Rodin
5 (30)
PRO Renko System is a highly accurate trading system specially designed for trading RENKO charts. The ARROWS and Trend Indicators DO NOT REPAINT! The system effectively neutralizes so called market noise giving you access to accurate reversal signals. The indicator is very easy to use and has only one parameter responsible for signal generation. You can easily adapt the tool to any trading instrument of your choice and the size of the renko bar. I am always ready to provide extra support to help
FX Power MT4 NG
Daniel Stein
4.95 (21)
FX Power: Analyze Currency Strength for Smarter Trading Decisions Overview FX Power is your go-to tool for understanding the real strength of currencies and Gold in any market condition. By identifying strong currencies to buy and weak ones to sell, FX Power simplifies trading decisions and uncovers high-probability opportunities. Whether you’re looking to follow trends or anticipate reversals using extreme delta values, this tool adapts seamlessly to your trading style. Don’t just trade—trade
Advanced Supply Demand
Bernhard Schweigert
4.91 (298)
Trading Special – 40% OFF Best Solution for any Newbie or Expert Trader! This indicator is a unique, high quality and affordable trading tool because we have incorporated a number of proprietary features and a new formula. With this update, you will be able to show double timeframe zones. You will not only be able to show a higher TF but to show both, the chart TF, PLUS the higher TF: SHOWING NESTED ZONES. All Supply Demand traders will love it. :) Important Information Revealed Maximize the pot
Trading Special – 40% OFF Best Solution for any Newbie or Expert Trader! This indicator is a unique, high quality and affordable trading tool because we have incorporated a number of proprietary features and a secret formula. With only ONE chart it gives Alerts for all 28 currency pairs. Imagine how your trading will improve because you are able to pinpoint the exact trigger point of a new trend or scalping opportunity! Built on new underlying algorithms it makes it even easier to identify and c
Trend indicator AI
Ramil Minniakhmetov
4.53 (83)
Trend Ai indicator is great tool that will enhance a trader’s market analysis by combining trend identification with actionable entry points and reversal alerts.  This indicator empowers users to navigate the complexities of the forex market with confidence and precision Beyond the primary signals, Trend Ai indicator identifies secondary entry points that arise during pullbacks or retracements, enabling traders to capitalize on price corrections within the established trend. Important Advantage
Gold Scalper Super
Aleksandr Makarov
5 (2)
Gold Scalper Super is an easy-to-use trading system. The indicator can be used as a standalone scalping system on the M1 time frame, as well as part of your existing trading system. Bonus: when purchasing an indicator, Trend Arrow Super is provided free of charge, write to us after purchase. The indicator 100% does not repaint!!! If a signal appears, it does not disappear! Unlike indicators with redrawing, which lead to the loss of a deposit, because they can show a signal and then remove it.
Meravith
Ivan Stefanov
5 (3)
Market makers' tool. Meravith will: Analyze all timeframes and display the current trend in force. Highlight liquidity zones (volume equilibrium) where bullish and bearish volumes are equal. Display all liquidity levels across different timeframes directly on your chart. Generate and present text-based market analysis for your reference. Calculate targets, support levels, and stop-loss points based on the current trend. Compute the risk/reward ratio for your trades. Determine position size accor
FX Volume
Daniel Stein
4.63 (38)
FX Volume: Experience Genuine Market Sentiment from a Broker’s Perspective Quick Overview Looking to elevate your trading approach? FX Volume provides real-time insights into how retail traders and brokers are positioned—long before delayed reports like the COT. Whether you’re aiming for consistent gains or simply want a deeper edge in the markets, FX Volume helps you spot major imbalances, confirm breakouts, and refine your risk management. Get started now and see how genuine volume data can
Apollo SR Master is a Support/Resistance indicator with special features which make trading with Support/Resistance zones easier and more reliable. The indicator calculates Support/Resistance zones in real-time without any time lag by detecting local price tops and bottoms. Then to confirm the newly formed SR area, the indicator shows special signal which signalizes that the SR zone can be taken into consideration and used as an actual SELL or BUY signal. In this case the strength of the SR zone
Presenting one-of-a-kind Gann Indicator for XAUUSD IQ Gold Gann Levels is a non-repainting, precision tool designed exclusively for XAUUSD/Gold intraday trading. It uses W.D. Gann’s square root method to plot real-time support and resistance levels, helping traders spot high-probability entries with confidence and clarity. William Delbert Gann (W.D. Gann) was an exceptional market analyst whose trading technique was based on a complex blend of mathematics, geometry, astrology, and ancient calcul
El indicador "MR BEAST ALERTAS DE LIQUIDEZ" es una herramienta avanzada diseñada para proporcionar señales y alertas sobre la liquidez del mercado basándose en una serie de indicadores técnicos y análisis de tendencias. Ideal para traders que buscan oportunidades de trading en función de la dinámica de precios y los niveles de volatilidad, este indicador ofrece una visualización clara y detallada en la ventana del gráfico de MetaTrader. Características Principales: Canal ATR Adaptativo: Calcula
Trading Special –40% OFF Best Solution for any Newbie or Expert Trader! This Indicator is a unique, high quality and affordable trading tool because we have incorporated a number of proprietary features and a new formula. With only ONE chart you can read Currency Strength for 28 Forex pairs! Imagine how your trading will improve because you are able to pinpoint the exact trigger point of a new trend or scalping opportunity? User manual: click here That's the first one, the original! Don't buy a
IQ FX Gann Levels a precision trading indicator based on W.D. Gann’s square root methods . It plots real-time, non-repainting support and resistance levels to help traders confidently spot intraday and scalping opportunities with high accuracy. William Delbert Gann (W.D. Gann) was an exceptional market analyst, whose trading technique was based on a complex blend of mathematics, geometry, astrology, and ancient mathematics which proved to be extremely accurate. Setup & Guide:  Download  MT5 Ver
Introduction Harmonic Patterns are best used to predict potential turning point. Traditionally, Harmonic Pattern was identified manually connecting peaks and troughs points in the chart. Manual harmonic pattern detection is painfully tedious and not suitable for everyone. You are often exposed under subjective pattern identification with manual pattern detection. To avoid these limitations, Harmonic Pattern Plus was designed to automate your harmonic pattern detection process. The functionality
Smart Sweep Sniper MT4
Vincent Georges David Ferrier
#   Smart Sweep Sniper MT4 Version  ( Midnight Pro Edition , specialized for scalping and intraday trading in Prop Firm,  Available here ) ## The Institutional Edge — Detect Where Smart Money Acts, Enter When It Matters If you like it, leave a positive review to support its development. If you encounter a bug, let us know before posting a review. When you complete your challenge, share your certificate in the comments. Happy trading! Smart Sweep Sniper   is a precision-engineered MetaTrader 4 i
More from author
The R Wolfe Wave indicator analyses price action and transforms the accumulated data into a powerful Wolfe Wave chart pattern technical tool. In essence, the R Wolfe Wave chart pattern can be either bullish or bearish and might help traders to open buy and sell trades without any lagging indicators. Key Points Identifies powerful Wolfe Wave patterns For advanced traders Works for any currency pair Well worth adding to your indicator collection This indicator can work together with any existing
FREE
R 2EMA Color
Rwy Ksyby
5 (2)
The R 2EMA Color indicator for MT4 provides solid trading signals based on the crossover of 2 EMA’s. Key Points When price crosses and closes above the two green EMA’s, it creates a buy trade signal. When price crosses and closes above the two red EMA’s, it creates a sell trade signal. The R 2EMA Color Forex indicator makes it even more easy to determine when it’s time to buy and sell A buy signal occurs when the 2 EMA lines turn green . A sell signal occurs when the 2 EMA lines turn red . How
FREE
The R Alligator indicator was introduced by Bill Williams, it follows the trend with the help of 3 smoothed moving averages. By default, the following values are used: The 13-period smoothed moving average (known as the Jaw) The 8-period smoothed moving average (known as the Teeth) The 5-period smoothed moving average (known as the Lips) The R Alligator indicator reduces the number of false trend trades through the use of smoothening moving averages. Basic Trading Signals The R Alligator indic
FREE
The R Var Moving Average Indicator is a trend following indicator designed for die-hard trend followers. It is a quite popular forex trading indicator among stock traders, as well as commodity traders, and its popularity stems from its ability to deliver genuine money making signals to its users. The indicator is comprised of green and red dots that are placed on a sienna line. The green dot is pointing to a bullish signal, while the red dot depicts a bearish signal. Basic Trading Signals Buy S
FREE
The R Silver Trend indicator is a trend following trading indicator that displays the current trend directly on the activity Metatrader 4 chart. It draws two types of candlesticks: Blue ones for bullish price action. Red ones for bearish price action. Trading the R Silver Trend indicator is pretty simple, even for absolute beginners, and it can be used for scalpin g (M1, M5) , day trading (M5, M15, M30) and swing trading (H1, H4, D1) currencies. Basic Trading Signals Signals from the R Silver T
FREE
The R Show Ticks indicator for Metatrader 4 shows the up/down ticks in real-time on the main trading window. Key Takeaways A white arrow is an uptick . A red arrow is a downtick . The indicator works for any currency pair and time frame of your preference. Indicator Specifications Trading Platform: Developed for Metatrader 4 (MT4) Currency pairs: Works for any pair Time frames: Works for any time frame Input Parameters: Input symbol, style, color. Indicator type: Data How to edit the indicator
FREE
The R Wavy Dash indicator transforms price data into an excellent trend-following signals indicator that works for trade entry and exit. It appears in the main chart as a colored signals line and can be used as a standalone trading tool. The R Wavy Dash indicator is very reliable, lightweight, and will not slow down your trading platform. Key Points Trend signal indicator Newbie friendly Non-repaint Well worth adding to your indicator collection This indicator can work together with any existin
FREE
The R Scalper Arrows indicator delivers easy to read buy and sell signal arrows for any forex pair. It works good for short-term trend predictions: Up arrows suggest the pair is short-term trending up. Down arrows suggest the pair is short-term trending down. For long trades, place your stop-loss below the dots. For short trades, place your stop-loss above the dots. Tip You can use this indicator together with a longer term period trend-following forex indicator such as a simple moving average o
The R Chimp Scalper is a great trading tool for both forex scalpers and intraday traders. The signals from this scalper indicator are very clear and easy to read. It paints green and red bars above and below the zero level in a separate trading window: Green bars are aligned above the zero level suggest the scalpers trend is bullish Red bars are aligned below the zero level suggest the scalpers trend is bearish Indicator readings above the zero level suggest the scalp trend is bullish and trader
The R 3MA Cross indicator is a popular trend indicator with alerts based on the crossover of 3 moving averages, it is composed of a faster, medium and slower moving average. Key Points A buy alert will occur when the faster moving average crosses both the medium and slower moving average upwards . A sell alert will occur when the faster moving average crosses both the medium and slower moving average downwards . How to trade with it? Open a buy trade whenever the green colored R 3MA Cross arro
This indicator uses multiple indicators to generate high-winning signal trades The R Signals indicator is a complete FX trading system that prints accurate buy & sell arrows on the chart. The indicator appears in the main MT4 chart window as colored green and red arrows. Using signals generated by a single indicator can be risky while trading. This is because using just one indicator to trade can give more false signals. Thus, many forex traders used three or more indicators to filter out goo
The R Inside Bar indicator for Metatrader 4 provides simple to use price breakout levels based on inside bars. It works on pure price action and does not repaint whatsoever, and pops up in the main MT4 chart window in the form of 2 colored horizontal lines above and below the actual inside bar. The green horizontal line acts as resistance and the red line acts as support. Long & short trade idea Open a buy order if the candlestick closes above the green inside bar line and the overall trend is u
The R Delta RSI indicator draws a buy and sell colored histogram based on the crossover of a fast RSI (period 14) and slow RSI (period 50) together with a signal level. A red colored histogram indicates the trend is bullish (buy signal). A green colored histogram indicates the trend is bearish (sell signal). A gray colored histogram indicates the trend is flat or range-bound (no signal). This forex indicator can be traded as a standalone or together with other trend following indicators. Scalper
The R Ease Of Movement Metatrader 4 forex indicator is a blue colored EMZ trading oscillator. It’s an oscillator type forex indicator that generates a bullish and bearish trading area. Values above the zero level are said to be bullish while values below the zero level are said to be bearish. The R Ease Of Movement oscillator does not produce good results on its own, it needs to be traded in conjunction with a trend following technical indicator. Good forex trend indicators include: SMA, EMA, PS
Filter:
No reviews
Reply to review