Breaker Blocks
- Indicators
-
Navdeep Singh
 The momentum of money is always more potent than the gravity of logic
Free or paid, All tools are coded with intention to help traders
My tools:- - Version: 1.0
- Activations: 10
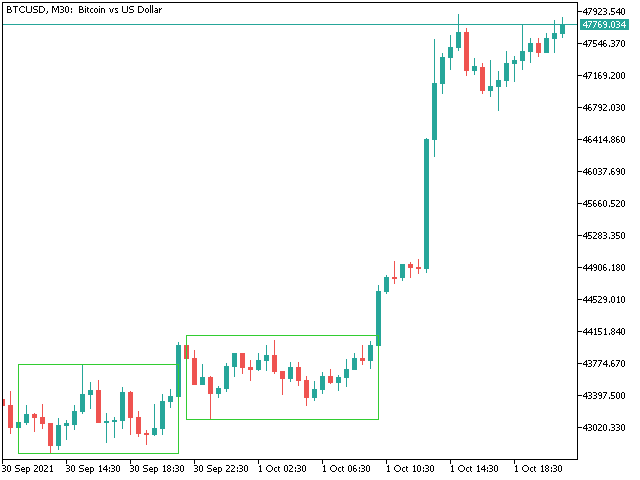
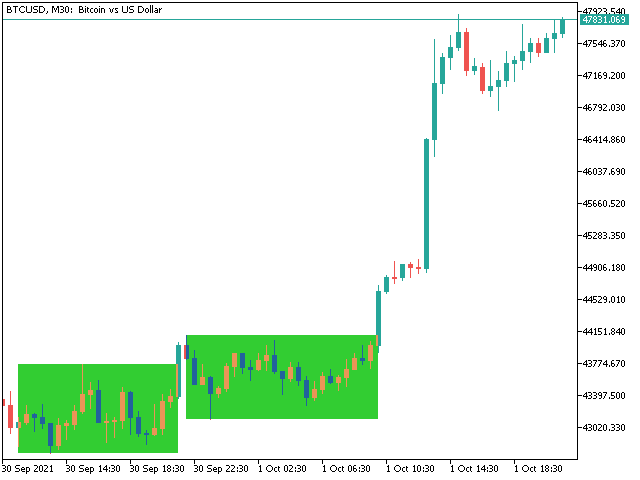
Market structures, Market balance, Range breakouts
This tools helps to identify areas of market ranges, structures and plots colored boxes on breakout of those areas. User is given the option to receive alerts and notifications on the formation of the blocks. The tool has the ability to become an essential part of a technical trading system or even pure price action trading.
Usage:-
An essential tool for price action or technical traders.
| More information in the blog |
|---|