• Aperçu
  • Avis
  • Commentaires
  • Nouveautés

Market Shaver

Rasoir de marché
 
Scalpeur de marché
Cet indicateur fait partie des systèmes RPTrade Pro Solutions.

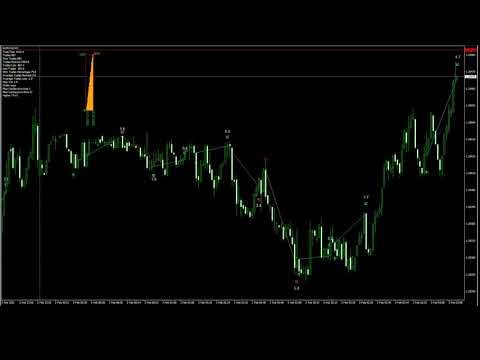
Market Scalper est un indicateur de tendance quotidien utilisant Price Action, Dynamic Support et Resistances.
Il est conçu pour être utilisé par n'importe qui, même le débutant absolu en trading peut l'utiliser.
Ne JAMAIS repeindre.
Les indications sont données de près à près.
Conçu pour être utilisé seul, aucun autre indicateur n'est requis.
Vous donne des indications claires et simples


Comment ça marche
Market Shaver utilise le système Dual TimeFrames.
La tendance principale est prise par le TF le plus élevé tandis que le plus rapide est utilisé pour fermer le commerce
Les métiers sont indiqués un par un, il n'y a jamais deux métiers en même temps.

Market Shaver indique :
Quand prendre un métier
Quand l'arrêter, en profit ou en perte.
Les récompenses commerciales
De nombreuses statistiques pour vous aider à définir le bon TF de fin de période
Market Shaver fonctionne
Avec n'importe quel instrument comme les paires de devises, les indices, les métaux, les contrats à terme ou tout autre.
De M1 à H1.
Avec n'importe quel courtier. (Une propagation plus faible vous laissera plus de pépins)


Caractéristiques du rasoir du marché
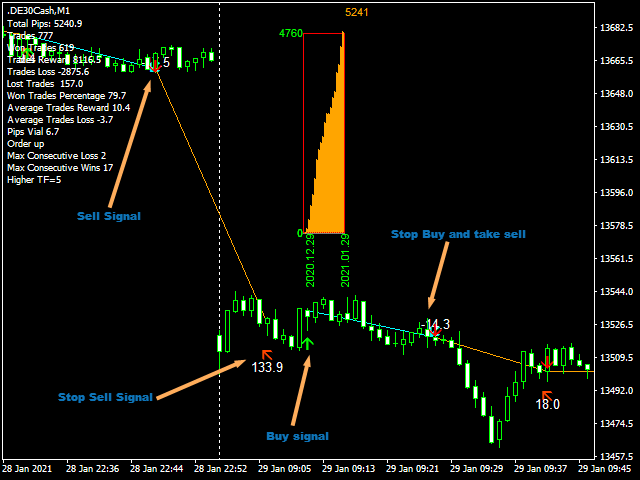
Signaux d'achat / vente fiables.
Entrées très simples. (Ceux par défaut devraient fonctionner pour presque tous les instruments)
Alerte à l'écran + notifications push + notifications par e-mail
Toutes les notifications sont très détaillées et donnent également Take Profit, cela permet de trader depuis un appareil mobile.
Un tableau des bénéfices pour vous aider dans les réglages corrects


Comment utiliser Market Shaver
Mettez-le simplement sur votre (vos) tableau(x).
Suivez simplement les flèches.


Contributions
Période : [Entier] Période de l'indicateur ; de 2 à .....
Période 2 : [Entier] Période de l'indicateur ; de 1 à ..... La valeur la plus basse = plus de multi trades
TF supérieur : [TIME FRAME] Choisissez le TF le plus lent utilisé pour entrer dans les transactions. Entrez toujours un TF supérieur à celui de l'indicateur.
Afficher le graphique des bénéfices : [Bool] true affichera le graphique des bénéfices, false le masquera.
UsePush : [bool] true enverra des notifications Push
SendAlert : [bool] true enverra des alertes
Garantie SPÉCIALE de preuve :
Le rasoir de marché fonctionne sans boucle ni stockage de données. Signifie qu'aucun calcul préalable n'est effectué. Cela ne fonctionne qu'en direct ou dans le testeur, lorsque vous le mettez sur votre graphique, vous ne verrez aucune indication avant le moment même où vous l'avez démarré.
C'est la garantie ultime de preuve que le logiciel n'utilise pas de données connues et ne peut pas tricher.
Produits recommandés
Noize Absorption Index MT4
Ekaterina Saltykova
5 (1)
Noize Absorption Index - is the manual trading system that measures the difference of pressure between bears forces and bulls forces. Green line - is a noize free index that showing curent situation. Zero value of index shows totally choppy/flat market.Values above zero level shows how powerfull bullish wave is and values below zero measures bearish forces.Up arrow appears on bearish market when it's ready to reverse, dn arrow appears on weak bullish market, as a result of reverse expectation. S
Daily Candle Predictor est un indicateur qui prédit le cours de clôture d'une bougie. L'indicateur est principalement destiné à être utilisé sur les graphiques D1. Cet indicateur convient à la fois au trading forex traditionnel et au trading d'options binaires. L'indicateur peut être utilisé comme un système de trading autonome, ou il peut servir de complément à votre système de trading existant. Cet indicateur analyse la bougie actuelle, calcule certains facteurs de force à l'intérieur du corps
Blahtech Market Profile
Blahtech Limited
4.61 (18)
Was: $249  Now: $99   Market Profile defines a number of day types that can help the trader to determine market behaviour. A key feature is the Value Area, representing the range of price action where 70% of trading took place. Understanding the Value Area can give traders valuable insight into market direction and establish the higher odds trade. It is an excellent addition to any system you may be using. Blahtech Limited presents their Market Profile indicator for the MetaTrader community. Ins
The Th3Eng PipFinite indicator is based on a very excellent analysis of the right trend direction with perfect custom algorithms. It show the true direction and the best point to start trading. With StopLoss point and Three Take Profit points. Also it show the right pivot of the price and small points to order to replace the dynamic support and resistance channel, Which surrounds the price. And Finally it draws a very helpful Box on the left side on the chart includes (take profits and Stop loss
Forex Gump
Andrey Kozak
2.83 (6)
Forex Gump is a fully finished semi-automatic trading system. In the form of arrows, signals are displayed on the screen for opening and closing deals. All you need is to follow the instructions of the indicator. When the indicator shows a blue arrow, you need to open a buy order. When the indicator shows a red arrow, you need to open a sell order. Close orders when the indicator draws a yellow cross. In order to get the most effective result, we recommend using the timeframes H1, H4, D1. There
Owl smart levels
Sergey Ermolov
4.63 (54)
Version MT5  |  FAQ L' indicateur Owl Smart Levels   est un système de trading complet au sein d'un seul indicateur qui comprend des outils d'analyse de marché populaires tels que   les fractales avancées de Bill Williams , Valable ZigZag qui construit   la structure d'onde correcte   du marché et   les niveaux de Fibonacci   qui marquent les niveaux exacts d'entrée. sur le marché et les endroits où prendre des bénéfices. Description détaillée de la stratégie Mode d'emploi de l'indicateur Conse
Gold Bricks FX USES THE TREND WAVE INDICATOR AND IT CAN IDENTIFY THE BEGINNING AND THE END OF A NEW WAVE TREND MOVEMENT. AS AN OSCILLATOR, THE INDICATOR IDENTIFIES THE OVERBOUGHT AND OVERSOLD ZONES. IT WORKS GREAT TO CATCH THE SHORT TERM PRICE REVERSALS AND USES A MARTINGALE STRATEGY TO CLOSE ALL TRADES IN PROFIT. USE DEFAULT SETTINGS ON H1 OR HIGHER TIME FRAME ON ANY PAIR FOR MORE ACCURATE TRADES WHY THIS EA : Smart entries calculated by 4 great strategies The EA can be run on even a
Fibonacci retracement and extension line drawing tool Fibonacci retracement and extended line drawing tool for MT4 platform is suitable for traders who use  golden section trading Advantages: There is no extra line, no too long line, and it is easy to observe and find trading opportunities Trial version: https://www.mql5.com/zh/market/product/35884 Main functions: 1. Multiple groups of Fibonacci turns can be drawn directly, and the relationship between important turning points
Cosmic Diviner X Planet
Olena Kondratenko
4 (2)
This unique multi-currency strategy simultaneously determines the strength of trends and market entry points, visualizing this using histograms on the chart. The indicator is optimally adapted for trading on the timeframes М5, М15, М30, Н1. For the convenience of users, the indicator renders the entry point (in the form of an arrow), recommended take profit levels (TP1, TP2 with text labels) and the recommended Stop Loss level. The take profit levels (TP1, TP2) are automatically calculated for
Master Scalping M1 est un indicateur innovant qui utilise un algorithme pour déterminer rapidement et avec précision la tendance. L'indicateur calcule le temps d'ouverture et de fermeture des positions, les algorithmes de l'indicateur vous permettent de trouver les moments idéaux pour entrer dans une transaction (acheter ou vendre un actif), ce qui augmente le succès des transactions pour la plupart des commerçants. Avantages de l'indicateur : Facile à utiliser, ne surcharge pas le graphique ave
Intraday Levels shows intraday levels grid for intraday trading Shows a grid for the day levels, gives you a guide to know the trend and to measure intraday trades (stop-loss and take-profit). Parameters are: Levels Mode: Basic mode: Shows highest, lowest and middle levels. Advanced mode: Shows highest, lowest, middle and intermediate levels. Fibonacci mode: Shows session Fibonacci retracements levels. Momentum mode: Shows delayed Advanced levels to identify momentum. Smooth Period (Momentum
Heiken Ashi candle chart is an improved version of The Japanese candle chart, which can effectively filter the market "noise" of the Japanese candle chart. It is favored by many traders for its simplicity and intuition. For trend traders, the HA candle chart is a magic tool. Unlike the traditional Japanese candle chart, Heikenashi does not reflect the opening price, high price, low price and closing price of the market. Instead, Heikenashi calculates the value of a single K line in the dominant
For sure, this indicator has become very popular amongst traders. Through coding this indicator will give you the most accurate levels possible for your trading analysis. We have also added in the ability for you to receive alerts when the price breaks above or below a Support or Resistance lines! HOW TO USE The red rectangles represent your resistance/supply zone. The green rectangles represent your support/demand zone.  BONUS FEATURES We coded this indicator with the ability to switch between
Point61 Indicator
Evgeniy Machok
5 (1)
The Point61 indicator is the result of many years of monitoring of price behavior of currency pairs and metals. It is not a secret, that in times of uncertainty, traders are looking for possible levels of support and resistance - the point, where price should stop its movement. There are 2 possible scenarios at these points: 1. Reverse (correction) to the opposite direction; 2. Breakthrough to continue movement. Very often these points are used to set stop orders - TakeProfit or
Title : Market Bias Indicator - Oscillator-Based Trading Tool Introduction : Discover the potential of the "Market Bias Indicator," a revolutionary oscillator-based trading tool designed for precise market analysis. If you're in search of a robust alternative to traditional bias indicators, your quest ends here. Market Bias Indicator offers unparalleled accuracy in identifying market sentiment and is your gateway to confident trading decisions. Recommended Trading Pairs : Market Bias Indicator i
VR Cub
Vladimir Pastushak
VR Cub est un indicateur permettant d'obtenir des points d'entrée de haute qualité. L'indicateur a été développé pour faciliter les calculs mathématiques et simplifier la recherche de points d'entrée dans un poste. La stratégie de trading pour laquelle l'indicateur a été rédigé prouve son efficacité depuis de nombreuses années. La simplicité de la stratégie de trading est son grand avantage, qui permet même aux traders débutants de négocier avec succès avec elle. VR Cub calcule les points d'ouve
PZ Trend Trading
PZ TRADING SLU
4.75 (4)
Trend Trading is an indicator designed to profit as much as possible from trends taking place in the market, by timing pullbacks and breakouts. It finds trading opportunities by analyzing what the price is doing during established trends. [ Installation Guide | Update Guide | Troubleshooting | FAQ | All Products ] Trade financial markets with confidence and efficiency Profit from established trends without getting whipsawed Recognize profitable pullbacks, breakouts and early reversals The ind
L'indicateur calcule et trace automatiquement les niveaux de support et de résistance de Fibonacci - l'un des outils les plus efficaces pour l'analyse de marché. Le calcul utilise les données de prix moyennes pour la période et la période sélectionnées. Le minimum et le maximum pour cette période sont considérés comme le début et la fin du mouvement. Les niveaux de Fibonacci vous permettent de voir des points de référence potentiels, autour desquels le mouvement des prix peut ralentir ou s'inver
This is the FXTraderariel-TakeProfit - Stop Loss Indicator . It provides you 3 potential Take Profits and 1 Stop Loss. These potential targets are computed based on several methods . The indicator can be used on every time frame, but we advise to use it on H1, H4 and D1. Especially if you are a novice trader. Pro Traders can also you use it for scalping in smaller time frames (M1, M5 and M15). This indicator is not a complete trading system. It doesn't provide you a Signal nor can predict the m
Infinity Trend Pro
Yaroslav Varankin
1 (1)
This is a trend indicator without redrawing Developed instead of the binary options strategy (by the color of the Martingale candlestick) Also works well in forex trading When to open trades (binary options) A signal will appear in the place with a candle signaling the current candle It is recommended to open a deal for one candle of the current timeframe M1 and M5 When a blue dot appears, open a deal up When a red dot appears, open a trade down. How to open trades on Forex. When a signal is rec
Shark Deal Book
Philip Pankaj Suthagar
4 (3)
Term  "shark"  in the business world denotes a high volume investor who just made a good investment in a highly Potential business deal.So, sharks are the ones who make the market move. In our case, if an American shark bought a Japanese company, he/she has to convert American dollars into Japanese yen to make the deal. So, the demand for the Japanese yen will increase sharply. Thus USD/JPY will go short rapidly if the deal was from the shark. Another example, In the case of forex, if fed increa
HMA Trend Professional MT4
Pavel Zamoshnikov
4.63 (8)
Improved version of the free HMA Trend indicator (for MetaTrader 4) with statistical analysis. HMA Trend is a trend indicator based on the Hull Moving Average (HMA) with two periods. HMA with a slow period identifies the trend, while HMA with a fast period determines the short-term movements and signals in the trend direction. The main differences from the free version: Ability to predict the probability of a trend reversal using analysis of history data. Plotting statistical charts for analyz
The indicator displays the data of the Stochastic oscillator from a higher timeframe on the chart. The main and signal lines are displayed in a separate window. The stepped response is not smoothed. The indicator is useful for practicing "manual" forex trading strategies, which use the data from several screens with different timeframes of a single symbol. The indicator uses the settings that are identical to the standard ones, and a drop-down list for selecting the timeframe. Indicator Parame
Trade with Gann on your side!! MASTER CIRCLE 360 CIRCLE CHART, originally created by Gann admitted that this is “The Mother of all charts”. It is one of the last studies that this great trader left for us. The numeric tab le is apparently quite simple like all the tables and is based on square numbers, the SQUARE OF 12 and is by evolution, one of the most important square numbers. Here we can find CYCLE, PRICE AND TIME thanks to angles and grades, to show past and future support and resistance.
TWO PAIRS SQUARE HEDGE METER INDICATOR Try this brilliant 2 pairs square indicator It draws a square wave of the relation between your two inputs symbols when square wave indicates -1 then it is very great opportunity to SELL pair1 and BUY Pair2 when square wave indicates +1 then it is very great opportunity to BUY pair1 and SELL Pair2 the inputs are : 2 pairs of symbols         then index value : i use 20 for M30 charts ( you can try other values : 40/50 for M15 , : 30 for M30 , : 10 for H1 ,
How to use Pair Trading Station Pair Trading Station is recommended for H1 time frame and you can use it for any currency pairs. To generate buy and sell signal, follow few steps below to apply Pair Trading Station to your MetaTrader terminal. When you load Pair Trading Station on your chart, Pair Trading station will assess available historical data in your MetaTrader platforms for each currency pair. On your chart, the amount of historical data available will be displayed for each currency pai
What are Heiken Ashi Candles? Heiken Ashi, derived from the Japanese term 'Heikin Ashi,' translates to average price bars. It's an indicator depicting price bars on a chart. Formula for Heiken Ashi candles: - Heiken Ashi opening price: (previous candle's opening + closing price) / 2 - Closing price Heiken Ashi: (opening + high + low + closing) / 4 - Heiken Ashi peak: Max of high, opening, or closing price - Heiken Ashi bottom price: Min of low, opening, or closing price How to Read Heik
Advanced Trend Regime
Shellard Securities (Pty) Ltd
The indicator has been designed to function on any time-frame and any pair.   This regime filter will help the trader better evaluate whether the current market is trending, and in which direction. It quickly reacts to changes in market dynamics using a series of advanced calculations. The user is able to select whether the calculation remains standard, or if a further filter constraint is added to the calculation.   A Yellow moving average of the signal has been included for the trader to smoot
Atomic Analyst
Issam Kassas
5 (1)
Tout d'abord, il convient de souligner que cet indicateur de trading n'est ni repainting, ni redrawing et ne présente aucun délai, ce qui le rend idéal à la fois pour le trading manuel et automatisé. L'Analyste Atomique est un indicateur d'action sur les prix PA qui utilise la force et le momentum du prix pour trouver un meilleur avantage sur le marché. Équipé de filtres avancés qui aident à éliminer les bruits et les faux signaux, et à augmenter le potentiel de trading. En utilisant plusieur
Price Breakout pattern Scanner is the automatic scanner for traders and investors. It can detect following patterns automatically from your chart. Head and Shoulder - Common tradable pattern. Reverse Head and Shoulder - This pattern is the reverse formation of the Head and Shoulder. Double Top - When the price hits resistance level twice and decline toward the support level, the trader can anticipate sudden bearish breakout through the support level. Double Bottom - The double bottom pattern is
Les acheteurs de ce produit ont également acheté
Présentation de l'indicateur miraculeux Forex : Libérez la puissance du trading précis En avez-vous assez de chercher le meilleur indicateur Forex qui fournisse réellement des résultats exceptionnels sur tous les délais ? Ne cherchez plus ! L'indicateur miraculeux Forex est là pour révolutionner votre expérience de trading et propulser vos gains vers de nouveaux sommets. Basé sur une technologie de pointe et des années de développement minutieux, l'indicateur miraculeux Forex se positionne comme
TrendMaestro
Stefano Frisetti
5 (2)
note: this indicator is for METATRADER4, if you want the version for METATRADER5 this is the link: TRENDMAESTRO recognizes a new TREND in the bud, he never makes mistakes. The certainty of identifying a new TREND is priceless. DESCRIPTION TRENDMAESTRO identifies a new TREND in the bud, this indicator examines the volatility, volumes and momentum to identify the moment in which there is an explosion of one or more of these data and therefore the moment in which prices have strong probability of f
Indicator : RealValueIndicator Description : RealValueIndicator is a powerful tool designed specifically for trading on the EURUSD pair. This indicator analyzes all EUR and USD pairs, calculates their real currency strength values, and displays them as a single realistic value to give you a head start on price. This indicator will tell you moves before they happen if you use it right. RealValueIndicator allows you to get a quick and accurate overview of the EURUSD currency pair tops and bottoms,
PZ Day Trading
PZ TRADING SLU
3.67 (3)
This indicator detects price reversals in a zig-zag fashion, using only price action analysis and a donchian channel. It has been specifically designed for short-term trading, without repainting or backpainting at all. It is a fantastic tool for shrewd traders aiming to increase the timing of their operations. [ Installation Guide | Update Guide | Troubleshooting | FAQ | All Products ] Amazingly easy to trade It provides value on every timeframe It provides suitable SL and TP levels It impl
Please send me Direct message on MQL5 CHAT after purchasing the Indicator for Training and Installation Support There are some additional files that is important to use with the Indicator . So be sure to contact me after purchasing the Indicator So that I can add you for training and support . If you find any difficulty with installation then send me Direct message here So that I can connect with you via Anydesk or Teamview for the product installation. " Smart Order Block Indicator " to find
Gann Signal
Kirill Borovskii
Gann Signal is a very simple indicator at first glance, but hidden inside is many years of experience in studying W.D.Ganna methods. The indicator gives accurate BUY/SELL signals, without redrawing. The indicator is very easy to use. All you need to do is attach it to your chart and follow its recommendations. The indicator constantly analyzes the market for entry opportunities. When such an opportunity appears, the indicator gives a signal in the form of an arrow. I repeat, all signals are NOT
Présentation de l'indicateur astronomique pour MT4 : Votre compagnon de trading céleste ultime Êtes-vous prêt à élever votre expérience de trading à des hauteurs célestes ? Ne cherchez pas plus loin que notre indicateur astronomique révolutionnaire pour MT4. Cet outil innovant transcende les indicateurs de trading traditionnels en exploitant des algorithmes complexes pour vous fournir des aperçus astronomiques inégalés et des calculs de précision. Un univers d'informations à portée de main : Con
Candle Power Pro
Thushara Dissanayake
4.33 (6)
Libérez la puissance des informations de volume réel avec l'indicateur   Candle Power Pro   . Cet outil dynamique capture les données de volume réelles pour chaque bougie et les présente sous forme de pourcentage du volume total. Ce faisant, cela vous permet de discerner la lutte en cours entre acheteurs et vendeurs sur le marché. Le Candle Power Pro affiche la bataille entre les acheteurs et les vendeurs sous forme de pourcentage du volume total, vous donnant des informations précieuses sur la
Market Breaker Updated version 3
Allistair Kabelo Mandow
1 (1)
Features for software Main functions: Accurate entry signals WITHOUT REPAINTING! Once a signal appears, it remains valid! This is a significant distinction from repainting indicators that might provide a signal and then alter it, potentially leading to deposit losses. Now, you can enter the market with higher probability and precision. There's also a function to colour candles after an arrow appears until the target (take profit) is reached or a reversal signal appears . Display of STOP LOSS
Weis Wave with Alert
Trade The Volume Waves Single Member P.C.
4.79 (19)
Rental/Lifetime Package Options and Privileges' * For optimum results the yearly or lifetime package is suggested due to live training and Discord  channel trading with the  creator! Rent Monthly Six Months   Yearly/Lifetime Weis Wave with Speed with Alert+Speed Index x x x Manual  x x x Quick Set up Video x x x Blog x x x Lifetime Updates x x x Setup and Training Material x x Free Rectangle Break Alert Tool      x Discord Access Channel "The SI traders" x 2-hour live methodology traini
System Trend Pro - This is the best trend trading indicator!!! The indicator no repaint!!!   The indicator has   MTF   mode, which adds confidence to trading on the trend (   no repaint   ). How to trade? Everything is very simple, we wait for the first signal (big arrow), then wait for the second signal (small arrow) and enter the market in the direction of the arrow. (See screens 1 and 2.) Exit on the opposite signal or take 20-30 pips, close half of it, and keep the rest until the oppo
Full STO
Roman Smoroda
Indicateur STO complet (inclut toutes les versions des trois indicateurs STO : Premium, Gold, Silver) - STABLE TRADE OPTION est conçu pour le trading automatique d'options binaires.  À LIRE ATTENTIVEMENT !!!!! IMPORTANT Dans un terminal, créez deux modèles avec des expirations différentes, un modèle pour 18:01, 18:02 avec des expirations de 1 à 15 minutes et un modèle pour 22:00 avec des expirations de 10 à 20 minutes. Taux de réussite : 71% sur les 5 dernières années Money management :
Connect Indicator
Sukunthakan Ngernbamrung
Connect Indicator is a tool used for connecting indicators between the MQL market and MT4. The connected indicators are made by our group and can be used for other applications, such as sending messages to the Line application or Telegram application. If you have any questions, please don't hesitate to ask us to receive support. Function and indicator buffer Buffer one is the high price of the previous candle. Buffer two is the high price of the previous candle. Usage To connect indicators to fu
Idea: RSI ( Relative Strength Index) and CCI ( Commodity Channel Index ) are powerfull to solved the market.  This indicator has Smoothed Algorithmic signal of RSI and CCI. So that, it separates the market into buy and sell zones, these areas are marked with arrows, red for downtrend, green for uptrend. This algorithm has the effect of predicting the next trend based on the historical trend, so users need to be cautious when the trend has gone many candles. Please visit screenshots
DESCRIPTION The CHAOS INDICATOR has been developed to be used for the TRADING STRATEGY OF CHAOS, as described in the book. The book is in italian language only and can be obtained only on my website indicated below. DATAS COLLECTED AND SHOWN ON GRAPHS The CHAOS INDICATOR apply easily to any graph and any asset, and it is a TRADING FACILITATOR, as it identify immediately the following items on any graph: - The GP (= RIGHT PRICE) i.e. the price to which the asset should be attracted within 24
Gann Swing Structure
Kirill Borovskii
5 (1)
This indicator is based on the mathematics of the great trader W.D. Ganna. With its help, you can easily find strong levels by analyzing swings to find the optimal entry point. The indicator works on all instruments and all timeframes. The indicator is fully manual and has control buttons. All you need to do is press the NEW button, a segment will appear, which you can place on any movement, swing or even 1 candle that you want to analyze. By placing the segment, press the OK button. A grid (th
Tricky to find and scarce in frequency, divergences are one of the most reliable trading scenarios. This indicator finds and scans for regular and hidden divergences automatically using your favourite oscillator. [ Installation Guide | Update Guide | Troubleshooting | FAQ | All Products ] Easy to trade Finds regular and hidden divergences Supports many well known oscillators Implements trading signals based on breakouts Displays suitable stop-loss and take-profit levels Configurable oscill
PZ Swing Trading
PZ TRADING SLU
5 (4)
Swing Trading is the first indicator designed to detect swings in the direction of the trend and possible reversal swings. It uses the baseline swing trading approach, widely described in trading literature. The indicator studies several price and time vectors to track the aggregate trend direction and detects situations in which the market is oversold or overbought and ready to correct. [ Installation Guide | Update Guide | Troubleshooting | FAQ | All Products ] Profit for market swings with
A. Qu'est-ce que l'A2SR ?   * C'est un indicateur technique avancé (pas de peinture, pas de retard). -- Conseils : -- sur https://www.mql5.com/en/blogs/post/734748/page4#comment_16532516 -- et https://www.mql5.com/en/users/yohana/blog A2SR a une technique spéciale pour déterminer les niveaux de Support (demande) et de Résistance (offre). Contrairement à la manière ordinaire que nous avons vue sur le net, A2SR a un concept original pour déterminer les niveaux réels de SR. La technique origin
Le système de négociation technique des flèches de renversement de BB a été développé pour prédire les points inversés pour prendre des décisions de vente au détail. La situation actuelle du marché est analysée par l'indicateur et structurée pour plusieurs critères: l'attente des moments d'inversion, des tournants potentiels, des signaux d'achat et de vente. L'indicateur ne contient pas d'informations excédentaires, a une interface visuelle compréhensible, permettant aux commerçants de prend
Gold Channel is a volatility-based indicator, developed with a specific timing algorithm for the XAUUSD pair, which consists of finding possible corrections in the market. This indicator shows two outer lines, an inner line (retracement line) and an arrow sign, where the theory of the channel is to help identify overbought and oversold conditions in the market. The market price will generally fall between the boundaries of the channel. If prices touch or move outside the channel it is a tra
Gann Zone Pro
Kirill Borovskii
This indicator identifies and displays zones, as it were areas of strength, where the price will unfold. The indicator can work on any chart, any instrument, at any timeframe. The indicator has two modes. The indicator is equipped with a control panel with buttons for convenience and split into two modes. Manual mode: To work with manual mode, you need to press the NEW button, a segment will appear. This segment is stretched over the movement and the LVL button is pressed. The level is displayed
Full Forex Market View Dashboard
Opengates Success International
5 (2)
Indicateur de tableau de bord FULL FOREX MARKET VIEW Il s'agit d'un indicateur personnalisé créé pour donner aux commerçants une vue complète de ce qui se passe sur le marché. Il utilise des données en temps réel pour accéder au marché et afficher toutes les informations nécessaires pour effectuer des transactions réussies. INSTALLATION: Avant de joindre cet indicateur à votre graphique de fenêtre, accédez au panneau Market Watch de votre MT4 et MASQUEZ toutes les paires de devises dont
The indicator is designed to work on any trading platform. The program is based on proprietary algorithms and W.D.Ganna's mathematics, allowing you to calculate target levels of price movement based on three points with the highest degree of certainty. It is a great tool for stock trading. The indicator has three buttons: NEW - call up a triangle for calculation. DEL - delete the selected triangle. DELS - completely remove all constructions. The probability of achieving the goals is more than 80
EZT Trend
Tibor Rituper
4 (1)
L'indicateur de tendance EZT vous montrera la tendance, le retrait et les opportunités d'entrée. Un filtrage optionnel et tous types d'alertes sont disponibles. Des alertes par e-mail et par notification push sont ajoutées. Nous développons également une évaluation environnementale basée sur cet indicateur, qui sera bientôt disponible. Il s'agit d'un indicateur multifonctionnel composé de deux histogrammes de couleurs et d'une ligne. Il s'agit d'une représentation visuelle de la direction et
IA Trendx3 PRO
Marco Aurelio Santos Costa
What if God Created a Trade System? No miracles... Just see how mathematics can be effective in the market. We managed to combine technical analysis / price action into indicators, creating the best setup for trading, be it in Forex, Indices, or stocks. It took us 2 years to create something that really works, and now it's time for you to discover it. TrendX3 is a revolution in trend analysis. Based on advanced algorithms and real-time data, it provides valuable insights so that you can make inf
The 5X target indicator is an indicator that plots the optimal entry zone and the target for the trading day. It also plots a level where the stoploss can be moved to breakeven for a risk free trade which is 2X. This indicator has time window inputs. The default settings are from 02:00 to 19:00 CET+1 time zone. This indicator is based used with a direction bias for the day. I post the direction bias for several pairs in the comments section. Added a new feature Time Zone to help trade the highes
The breakout algorithm is a technique based on price, price features, to shape a breakout strategy. The strategy in this indicator will not be redrawn (none-repaint indicator), it is suitable for short or long term traders In the screenshot is the EURUSD pair, these currency pairs, commodities or stocks, it have similar strength *Non-Repainting (not redrawn) *For Metatrader4 Only *Great For Scalping *Great For Swing Trading *Arrow Entry, Green is Long, Red is Short *Works On Any Timeframe *Work
This is the finest structure marking you will ever find in any market. indicator is coded considering the actual structure any trader would use. indicator is coded based on actual candle breaks and not coded based on any pivot or predefined values or specific number of candles high and low. please check out the screenshot. if you want me to fine tune it according to your needs then i am open for it.
'Zoro PRO' is a reversal strategy based MT4 indicator with advance pre-alert system. Its an 100% non repaint indicator with an average accuracy of about 70-95% in any kind of market. (EXCEPT BAD MARKET AND NEWS TIME) MT5 version:   https://www.mql5.com/en/market/product/90934  (MT5 version not recommended)  Recommended Broker: Alpari, Amarkets, tickmill. Recommended pairs for M1: EURUSD AUDJPY GBPUSD EURJPY NZDJPY CADJPY EURGBP  USDCAD GBPCHF GBPCAD EURNZD AUDNZD ---------
Plus de l'auteur
Netting Scalper
Remi Passanello
5 (2)
Ce robot fait partie des systèmes RPTrade Pro Solutions. Netting Scalper est un robot de trading rapide utilisant la dynamique des ticks et le système de compensation. Il est conçu pour être utilisé par n'importe qui, même le débutant absolu en trading peut l'utiliser. Conçu pour M1 UNIQUEMENT Utilise Take Profit, Stop Loss et Trailing stop. Peut également fonctionner comme interrupteur sans SL/TP Fonctionne avec toutes les paires Comment ça marche Netting Scalper est un scalpeur M1 rapide. I
TrendSwift
Remi Passanello
TendanceSwift Il est conçu pour être utilisé par n’importe qui, même le débutant absolu en trading peut l’utiliser. NE repeint JAMAIS   . Les indications sont données de Close à Close. Conçu pour être utilisé seul, aucun autre indicateur n’est requis. Comment ça marche TrensSwift utilise un indicateur de tendance interne combiné à une action sur les prix et au système Fibonacci. La stratégie est strictement appliquée sans aucun post-recalcul, lissage ou interpolation. Le « succès » de la st
PipsMinerFast
Remi Passanello
3 (2)
PipsMinerFast is mainly a trend follower with a bit of price action. At first sight, you will think: "Oh well, one more indi showing everything I've missed today but not giving a clue about what will happen..." Okay, you can believe this when just looking at it but start a test it and you will see that PipsMinerFast: Shows you the trend immediately Is not repainting Has minimum lagging Counts pips immediately Adapts to your spread level Works from M1 to H1 Is heading in the right direction 90% o
Scalp Tool
Remi Passanello
5 (1)
Scalp Tool est un indicateur de contre-tendance très efficace. Il est conçu pour être utilisé par n'importe qui, même les débutants en trading peuvent l'utiliser. Scalp Tool ne repeint pas. Les indications sont données de près à près ou de près à un niveau visible. L'outil Scalp peut être utilisé seul, aucun autre indicateur n'est requis. L'outil Scalp indique Où ouvrir vos trades. Quand les fermer. Où placer les ordres stop. Avec une précision supérieure à 80% lors des tests en direct.
Trend Wave
Remi Passanello
5 (5)
Trend Wave est un outil de trading avancé ; indicateur de tendance et de contre-échange basé sur les supports et les résistances. Trend Wave est conçu pour avoir un trading actif à tout moment Trend Wave n'est pas à la traîne Des indications sont données au début d'une nouvelle bougie Trend Wave indique La fenêtre de l'indicateur vous montre le nombre réel de S et R pour obtenir la tendance globale La ligne blanche montre la tendance instantanée. Sur la fenêtre principale du graphique, de
Trend Compound
Remi Passanello
3 (2)
Trend Compound is a trend indicator using a mix of 3 internal other indicators. Please have a look at "how to test in the tester" at the bottom of this page before to test. It's designed to be used by anyone, even the complete newbie in trading can use it. Trend Compound does not repaint . Indications are given from close to close. Trend Compound can be used alone , no other indicators are required. Trend Compound indicates Where to open your trades. When to close them. The potential quantity
Conçu pour être utilisé seul, aucun autre indicateur n'est requis. Vous donne la tendance et le potentiel de Take Profit en début de journée. Un graphique spécifique vous montre le gain potentiel en fonction des données historiques. Comment ça marche Breakout Pro Scalper Solution utilise une stratégie d'évasion combinée à une action sur les prix et à un support et des résistances dynamiques. La tendance nocturne et la volatilité sont analysées pour être utilisées le jour suivant. A partir d
Waxter D1
Remi Passanello
WAXTER est un EA Trend-Wise, ce qui signifie que sa stratégie consiste à négocier dans le sens de la tendance. WAXTER utilise une stratégie de tendance combinée à une action sur les prix et à un support et des résistances dynamiques. L'indicateur WAX intégré spécifique est utilisé pour déterminer la tendance Les échanges sont arrêtés soit par TP/SL/TS, soit par le prochain échange opposé à venir. Un trade doit se terminer avant que le suivant puisse commencer. WAXTER contrôle uniquement l'ouver
BPSPanel
Remi Passanello
BPS Panel Breakout Pro Scalper Solution Panel This indicator is part of the   RPTrade Pro Solutions  systems. BPS Panel   is a daily trend indicator using Price Action, Dynamic Support and Resistances. It's designed to be used by anyone, even the absolute beginner in trading can use it. NEVER repaints . Indications are given   from close to close . Designed to   be used alone , no other indicators are required. Gives you the trend and potential Take Profit at the beginning of the day. How
DTS est un indicateur de tendance quotidien utilisant Price Action, Dynamic Support et Resistances. Il est conçu pour être utilisé par n'importe qui, même le débutant absolu en trading peut l'utiliser. Ne JAMAIS repeindre. Les indications sont données de près à près. Conçu pour être utilisé seul, aucun autre indicateur n'est requis. Vous donne la tendance et le potentiel de Take Profit en début de journée. Comment ça marche DTS utilise une stratégie d'évasion combinée à une action des prix
Le commerçant quotidien   Cet indicateur fait partie des systèmes RPTrade Pro Solutions. Le Trader journalier est un indicateur journalier utilisant uniquement des statistiques. Il est conçu pour être utilisé par n'importe qui, même le débutant absolu en trading peut l'utiliser. Ne JAMAIS repeindre. Les indications sont données de près à près. Conçu pour être utilisé seul, aucun autre indicateur n'est requis. Vous donne des indications claires et simples Comment ça marche Le système statist
GannRS Trend Scalper   GannRS is an advanced trading tool based on Gann Law and Supports and Resistances. designed to have an   active trading at any time not lagging Indications are given at the beginning of a new candle Please watch the full tutorial video. How to use GannRS Very easy to set up... Put it on your chart Adjust inputs Inputs Show Resistance and support : [bool]  true = Shows R/S on chart false = does not show Show Levels :[bool]  true = Shows levels on the chart false = doe
Trendy Scalper est un indicateur de tendance courte utilisant Price Action. Il est conçu pour être utilisé par n'importe qui, même le débutant absolu en trading peut l'utiliser. Un graphique spécifique vous montre le profit et le prélèvement éventuel en fonction des données historiques. Comment ça marche TS utilise un indicateur de tendance interne combiné à un système d'action sur les prix. Au démarrage, le système analyse les 10000 premières barres de l'historique pour trouver les meilleu
UniversalTrader
Remi Passanello
4.64 (11)
Universal Trader (UT) This EA is part of the  RPTrade Pro Solutions  systems. UT  is a trading robot using a trend and oscillator indicators.  It's designed to be used by anyone, even the absolute beginner in trading can use it. Designed for every TimeFrames Uses Takes Profit, Stop Loss and Trailing stop. Can also work as a switch without SL/TP Works with any pairs How does it work UT is a trend follower.  It's using A build in Supertrend Indicator to find trades entries and Parabolic SAR to
GannRS Trend Scalper   GannRS is an advanced trading tool based on Gann Law and Supports and Resistances. designed to have an   active trading at any time not lagging Indications are given at the beginning of a new candle Please watch the full tutorial video. How to use GannRS Very easy to set up... Put it on your chart Adjust inputs Inputs Show Resistance and support : [bool]  true = Shows R/S on chart false = does not show Show Levels :[bool]  true = Shows levels on the chart false = doe
Straddle Scalper
Remi Passanello
Aperçu: Le scalpeur à cheval est une ouverture EA à cheval à des heures et / ou des jours particuliers. Le Take Profit est généré dynamiquement à l'aide du ratio ATR. Conditions: Un compte de couverture est nécessaire pour ouvrir des chevauchements. Une optimisation stricte (en prix ouverts) est obligatoire. Qu'est-ce qu'un chevauchement ? Un chevauchement est l'action d'ouvrir un achat et une vente en même temps. Comment fonctionne cet EA ? Après avoir été optimisé avec succès, l
Filtrer:
Aucun avis
Répondre à l'avis
Version 3.0 2021.06.15
Bug solved.
New Multi trades feature added.
Version 2.0 2021.05.27
Arrows Bug Fixed