Market Shaver
- 指标
-
Remi Passanello
 你好,
你好,
在过去的15年里,我是机器人行业的建设者和代码开发。
作为业界和这么多其他的事情都转向噩梦,因为法国落入极权共产主义共和国,我决定停止这项工作,并启动其他东西。
我从去年年底(2012年),并开始人工交易,那么我现在用我的知识来开发EA MT5.. - 版本: 3.0
- 更新: 15 六月 2021
- 激活: 10
市场剃须刀
市场黄牛
该指标是 RPTrade Pro Solutions 系统的一部分。
Market Scalper 是使用价格行为、动态支撑和阻力的每日趋势指标。
它旨在供任何人使用,即使是绝对的交易初学者也可以使用它。
从不重新粉刷。
指示是从接近到接近给出的。
设计为单独使用,无需其他指标。
为您提供清晰简单的指示
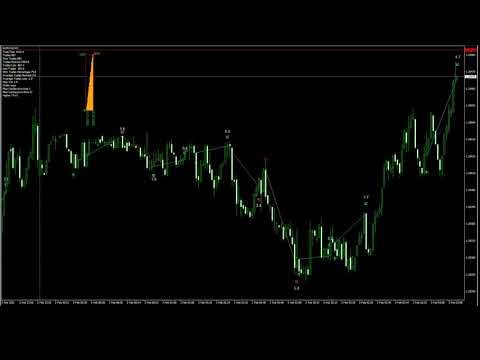
它是如何工作的
Market Shaver 正在使用 Dual TimeFrames 系统。
主要趋势由较高的 TF 采取,而较快的 TF 用于关闭交易
交易是一一指示的,永远不会同时进行两笔交易。
市场剃须刀表示:
何时进行交易
何时停止它,盈利或亏损。
交易奖励
许多统计数据可帮助您设置正确的 Period end TF
市场剃须刀工作
使用任何工具,如外汇对、指数、金属、期货或任何其他工具。
从 M1 到 H1。
与任何经纪人。 (较低的点差会给您带来更多的点数)
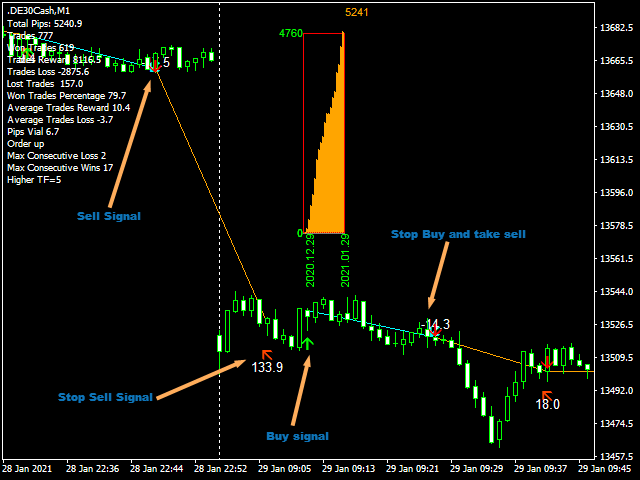
市场剃须刀功能
可靠的买入/卖出信号。
非常简单的输入。 (默认的应该适用于几乎所有的乐器)
屏幕提醒 + 推送通知 + 电子邮件通知
所有通知都非常详细,并且还提供获利,它允许从移动设备进行交易。
帮助您进行正确设置的利润图表
如何使用市场剃须刀
只需将其放在您的图表上即可。
只需按照箭头。
输入
Period: [Integer] 指标的周期;从2到......
Period 2: [Integer] 指标周期;从 1 到 ..... 较低的值 = 更多的多笔交易
更高的 TF:[TIME FRAME] 选择用于进入交易的较慢的 TF。始终输入比指标更高的 TF。
显示利润图表:[Bool] true 将显示利润图表,false 将隐藏。
UsePush: [bool] true 将发送推送通知
SendAlert: [bool] true 将发送警报
特殊证明保证:
Market Shaver 无需循环和数据存储即可工作。意味着没有进行预先计算。它仅在现场或在测试仪中有效,当您将其放在图表上时,在您启动它之前您不会看到任何指示。
这是证明该软件不使用已知数据且不能作弊的最终保证。