Yearly Levels

This indicator automatically plots Yearly High, Yearly Low and Yearly Average price levels from the previous year.

It also builds two additional equidistant parallel levels (Extended Highs R2, R3 /Extended Lows S2, R3) extended from previous Year High / Low.

Extended High R3 / Low S3 is 100 percent Low-to-High extension (as in Fibonacci 100 % extensions) above / below the previous Year H/L and is the final reversal level with a sure reaction. 

Extended High/Low R3/S3 represent the ultimate yearly Resistance/Support.

The tool also plots Middle Yearly levels (MS1 and MR1) between the Yearly Average and the Yearly High / Low, as well as the Middles  (MR2, MR3, MS2, MS3) between the Extended HL levels.

Typically, price stalls at the Middle Yearly Levels or does their retest as the break. Yearly Extended MS2 became the ultimate bottom of EURUSD 2020 March drop.

Monthly Close above the Yearly High / below the Yearly Low confirms yearly breakout / breakdown and sets the yearly trend.

At each Yearly level we observe major price reactions that last for days. After the break of the Yearly level price usually goes for its retest.


USAGE AND ADVANTAGES:


I believe "Yearly Highs and Lows" along with the average yeary price is a must-have tool of any trader as those reprsent crucial support and resistance where we see reversals, stalls, congestions, or retests.

To avoid key reversals, any trend trader must be aware of Yearly Lows and Highs, which one can not detect with a naked eye.

Trading the Yearly Levels removes all subjectivity, as they stay the same across all timeframes. 

Use Yearly Levels as Targets and Exits as typically price surely reaches them or as Reversals (after a retest or rejection) for Entries.

Use the Yearly Levels aong with the static MTF moving averages (that do not change when you flip charts) or other trend detecting tools (i.e. Ichimoku, MACD). 

For trend detection, I prefer adding "multitimeframe 8 EMA (Trigger Line)" - 8 EMA 4hrs, 8 EMA daily, 8 EMA weekly and 8 EMA monthly. This is an effective and non-subjective trading system alltogether.

Its is possible to change the levels' colour to silver or gray not to clutter the chart.


EXAMPLES:


  • 2020 CRUDE OIL: After UKOIL broke 2019 low, it reversed at extended low S3 returning to the 2019 Low at 52.28 (with immediate reaction when hitting it) in December - SEE SCREENSHOT.
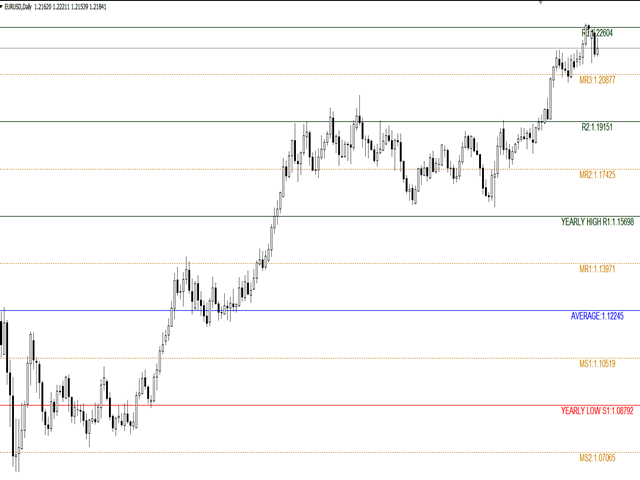
  • 2020 EURUSD: Yearly extended high R3 (100 percent Low to High extension from 2019 High) became the top in EURUSD bullish rally of 2020 (the rally started after the break and retest of 2019 low to the upside) - SEE SCREENSHOT.
  • 2020 EURUSD: March candle failed to close below 2019 low - devalidating the breakdown (multiple piercing on lower timeframes).
  • 2020 SP500: US500 did a double retest of 2019 high after breaking it to the upside - SEE SCREENSHOT.
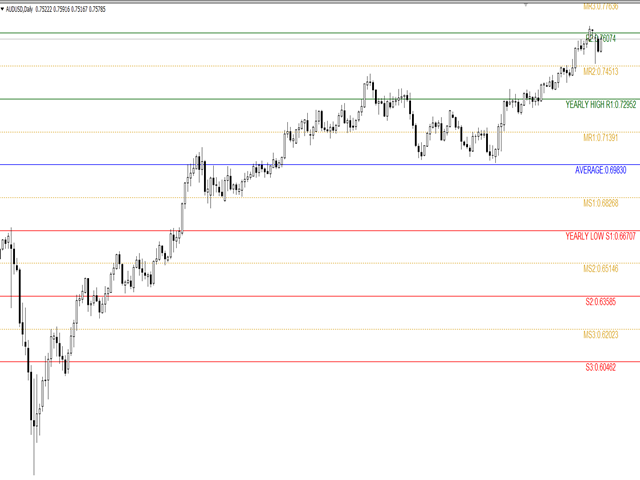
  • 2020 AUDUSD: AUDUSD showed major reactions at every yearly level. March bearish run started from 2019 low. Price made a swing below extended yearly low S3 returning back to 2019 low (S1) with a stall below it. After AUD was rejected from the 2019 high it returned back to 2019 average price, from where it went for another breakout attempt - SEE SCREENSHOT.
  • 2020 BTCUSD: Bitcoin saw a congestion along 2019 the average price. The bullish rally started from 2019 high and stalled at Yearly extended high R2. After congestion and break of R2 the second bullish rally was again from R2 stalling at R3 (maximal bitcoin price in 2020) - SEE SCREENSHOT.


    Recommended products
    FIBO Price Alert Indicator is very simple but powerful indicator. This is a very well-known indicator that allows you to see and exploit Fibonacci's retracements. This indicator can be used in any currency pairs and on any time frame, but preferably on higher time frames. Moreover, it's relatively easy to trade with FIBO Price Alert Indicator. This indicator produces two signals: BUY Signal: When the price crosses over the virtual line. SELL Signal: When the price crosses under the virtual line.
    The indicator allows you to trade binary options. The recommended time frame is М1 and the expiration time is 1,2,3 minutes. The indicator suitable for auto and manual trading. A possible signal is specified as a arrows above/under a candle. You should wait until the candle closes! Arrows are not re-painted Trade sessions: TOKYO section (Half-end) Currency pairs: USD/JPY Working time frame: M1 Expiration time: 1,2,3 minutes. The indicator also shows good results when using the martingale strateg
    FREE
    This indicator shows the latest untouched support and resistance as horizontal lines. The indicator can show support/resistance from higher timeframes. With this indicator you can e.g. easily see the support/resistance of the timeframes H4, D1 and W1 on a H1 chart, which can be a big advantage while time your entry on H1. This is the FREE version of the indicator: Support Resistance Multi Time Frame The free version works only on EURUSD and GBPUSD! Parameters referenceTF: the timeframe from whi
    FREE
    Candle Probability Scalper
    Martin Alejandro Bamonte
    User Guide for Candle Probability Scalper This indicator makes scalping easy and 100% intuitive. Candle Probability Scalper will show you at a glance the strength percentages of buyers and sellers in REAL TIME , and on the current candle. The percentages update with every tick, which means that second by second, you'll know what most buyers and sellers are doing without any delay. This will greatly help you determine or confirm the strength of each side, and therefore where the price might move.
    PZ Mean Reversion MT4
    PZ TRADING SLU
    3 (4)
    Outperform traditional strategies: effective mean reversion for savvy traders Unique indicator that implements a professional and quantitative approach to mean reversion trading. It capitalizes on the fact that the price diverts and returns to the mean in a predictable and measurable fashion, which allows for clear entry and exit rules that vastly outperform non-quantitative trading strategies. [ Installation Guide | Update Guide | Troubleshooting | FAQ | All Products ] Clear trading signals Am
    Pivot Point Fibo RSJ is an indicator that traces the support and resistance lines of the day using Fibonacci rates. This spectacular indicator creates up to 7 levels of support and resistance through Pivot Point using Fibonacci rates. It is fantastic how the prices respect each level of this support and resistance, where it is possible to perceive possible entry/exit points of an operation. Features Up to 7 levels of support and 7 levels of resistance Set the colors of the levels individually
    FREE
    KT Horizontal Lines MT4
    KEENBASE SOFTWARE SOLUTIONS
    In MetaTrader, plotting multiple   horizontal lines   and then tracking their respective price levels can be a hassle. This indicator automatically plots multiple horizontal lines at equal intervals for setting price alerts, plotting support and resistance levels, and other manual purposes. This indicator is suitable for Forex traders who are new and looking for chances to make quick profits from buying and selling. Horizontal lines can help traders find possible areas to start trading when the
    Daily Candle Predictor is an indicator that predicts the closing price of a candle. The indicator is primarily intended for use on D1 charts. This indicator is suitable for both traditional forex trading and binary options trading. The indicator can be used as a standalone trading system, or it can act as an addition to your existing trading system. This indicator analyzes the current candle, calculating certain strength factors inside the body of the candle itself, as well as the parameters of
    My Point MT4
    Claudia Ramona Angerer
    4 (1)
    Diagnosis of major and minor pivot Trend detection with many signals Can be used in all symbols Can be used in all time frames Settings: Back Show: The number of candles it displays If you need any adjustments, or have any questions or suggestions, message me How to trade: Blue: sell signal Red: buy signal Blue and red at the same time: no signal Exit signal: Opposite signal
    Virtual Targets
    Hoang Van Dien
    3.83 (6)
    This indicator is very useful for day traders or short term traders. No need to calculate the number of pips manually, just look at the chart and you will see the Virtual Take Profit / Virtual Stop Loss target line and evaluate whether the entry point is feasible to reach the intended target or not. Enter the intended Take Profit / Stop Loss pips for your trade. The indicator will display Virtual Take Profit / Virtual Stop Loss lines for you to easily see if the target is feasible or not.
    FREE
    Ska ZigZag BuySell
    NKATEKO VUKOSI LEROY MASANGO
    Ska ZigZag BuySell indicator determines the overbought and oversold regions within a trend. The indicator determines the overbought region by the candlestick high and the oversold region by the candlestick low. This indicator only gives signals with arrow and audible alerts each and every time when a new candlestick appear. To utilize the full strategy i recommend using "Ska ZigZag BuySell" together with "Ska ZigZag Line". The Ska ZigZag Line indicator is available for free. NOTE: Indicator is h
    a novel indicator by the maker of velvet.                                                                                                                                                                                                                                                                                                                                                                                                                                                                           
    FREE
    The indicator allows you to trade binary options. The recommended time frame is М1 and the expiration time is 1 minutes. The indicator suitable for auto and manual trading. A possible signal is specified as a arrows above/under a candle. You should wait until the candle closes! Arrows are not re-painted Trade sessions: London and New York section Currency pairs: AUD/CAD Working time frame: M1 Expiration time: 1 minute The indicator also shows good results when using the martingale strategy - "Ma
    FREE
    The UzFx-Total TP'SL & Timer-MT4 indicator is designed to provide real-time tracking of total   Take Profit (TP)   and   Stop Loss (SL)   values across all open and pending trades. Additionally, it includes a candle countdown timer to indicate the remaining time for the current candle to close. Key Features: Automatically calculates the total expected profit and loss from all active trades and pending orders. Displays the remaining time for the current candle to close, helping traders manage e
    FREE
    If you are good at trading at levels This indicator is all you need levels to manage your trades Market is usually follow current trend when break out some levels or reverse Trade at the Institutional traders level with the best supply and demand zone indicator available in MT4 and MT5 The Secret Profit Levels Signals indicator for MT4 is a complete trading system that provides traders with the entry price and 2 take profit levels. Technical analysts use support and resistance levels to identi
    Auto Fibo Pro m
    DMITRII GRIDASOV
    "Auto FIBO Pro"   Crypto_Forex  indicator  - is great auxiliary tool in trading! Indicator automatically calculate and place on chart Fibo levels and local trend lines (red color). Fibonacci levels indicate key areas where price can reverse. Most important levels are 23.6%, 38.2%, 50% and 61.8%. You can use it   for reversal scalping  or for zone grid trading. There are plenty of opportunities to  improve your current system using Auto FIBO Pro indicator as well. It has Info Spread Swap Displa
    Trend Ray
    Andriy Sydoruk
    The indicator shows the potential trend direction by cyclical-wave dependence. Thus, all the rays of the intersection will be optimal rays, in the direction of which the price is expected to move, taking into account the indicator period. Rays can be used as a direction for potential market movement. But we must not forget that the approach must be comprehensive, the indicator signals require additional information to enter the market.
    Candle Pattern Finder Candle Pattern Finder is a powerful MT4 indicator designed to help traders easily detect key candlestick patterns in real-time. Whether you're trading trends, reversals, or consolidations, this tool highlights important price action signals directly on the chart — helping you make faster and more confident trading decisions. Detects popular candlestick patterns: Bullish/Bearish Engulfing Hammer & Inverted Hammer Shooting Star & Hanging Man Three White Soldiers Three Black
    FREE
    Stealth Sar Alert
    Kyle Travis Mowery
    Parabolic SAR Alert – Adaptive Trend Reversal Indicator An upgraded Parabolic SAR with intelligent flip detection and smart volatility control. This indicator detects confirmed SAR reversals (true trend flips) and provides real-time alerts via popup, push notification, or email. Built-in ATR-based auto adjustment dynamically adapts the SAR Step and Maximum settings to current market volatility. Optional features include: • ATR volatility filter (reduces chop) • EMA trend confirmation • Confirmat
    SX Supply Demand Zones accurately identifies and draws high-probability Supply and Demand zones using a sophisticated algorithm. Unlike traditional indicators that clutter your chart, this indicator is designed with a focus on performance and a clean user experience. New Unique Feature: Interactive Legend System What truly sets this indicator apart from everything else is the Interactive Control Legend. You have a professional dashboard directly on your chart that allows you to: Show/Hide: Ins
    FREE
    Necessary for traders: tools and indicators Waves automatically calculate indicators, channel trend trading Perfect trend-wave automatic calculation channel calculation , MT4 Perfect trend-wave automatic calculation channel calculation , MT5 Local Trading copying Easy And Fast Copy , MT4 Easy And Fast Copy , MT5 Local Trading copying For DEMO Easy And Fast Copy , MT4 DEMO Easy And Fast Copy , MT5 DEMO The homeopathic indicator is also called the CCI indicator. The CCI indicator was proposed
    FREE
    VR Cub
    Vladimir Pastushak
    VR Cub is an indicator for getting high-quality entry points. The indicator was developed to facilitate mathematical calculations and simplify the search for entry points into a position. The trading strategy for which the indicator was written has been proving its effectiveness for many years. The simplicity of the trading strategy is its great advantage, which allows even novice traders to successfully trade with it. VR Cub calculates position opening points and Take Profit and Stop Loss targe
    Rule-based MT4 indicator combining multi-timeframe flow with validated supply and demand. Displays clear WAIT, ARMED, TRIGGER, and RESET states to support disciplined trade decisions. Overview Combined 3-Flow + Supply & Demand Trigger is a rule-based MT4 indicator designed to align multi-timeframe market flow with validated supply and demand zones, then present clear, state-based trigger conditions on the execution timeframe. The indicator guides the trader through a structured decision proce
    Indicator. "Indicator wave or Indicator Ma". Using 23 standard indicators and the author's algorithm, the levels of purchases (from 0 to +100) and sales (from 0 to -100) are calculated. Then, using the calculated levels, the "Wave Indicator" draws a wave with 21 moving averages. The wave number is equal to the averaging period of the calculated levels. Waves # 1 - 7 Fast Moving Averages Waves from No. 8 -14 moving averages Waves from No. 15-21 slow moving averages Looking at the figures drawn
    Sentinel Arrow
    Dmytro Kasianov
    1 (1)
    Sentinel Arrow Key Features: ⊗An exclusive algorithm for quickly and accurately identifying trends, reversals, and momentum changes. ⊗Designed for professional use, it features robust signal logic that eliminates delays or false updates. ⊗Suitable for various timeframes. ⊗Does not redraw, delete, or modify past signals. ⊗All BUY and SELL signals are generated on the candlestick itself and remain fixed. ⊗In real trading, there is no redrawing—signals appear instantly on the candlestick itself.
    FREE
    Super Reversal Pattern
    Parfait Mujinga Ndalika
    Super Reversal Pattern Indicator Unlock the power of advanced pattern recognition with our Super Reversal Pattern Indicator. Designed for traders seeking precision and reliability, this indicator identifies one of the most effective reversal patterns in technical analysis, offering a significant edge in your trading strategy. Key Features: Non-Repainting Accuracy: Enjoy the confidence of non-repainting technology. Once a Super Reversal Pattern is detected, it remains static, providing consiste
    TMA AI Bands
    Monique Ellen Miranda Dos Santos
    The TMA AI Bands indicator is based on the Triangular Moving Average (TMA) with dynamic upper and lower bands and clear buy/sell arrows plotted directly on the chart. It features integrated AI for adaptive optimization and guarantees no repaint, providing precise reversal signals when price touches the bands. Pairs: works with all currency pairs Recommended timeframes: D1 / W1 / MN Configurable external variables: TimeFrame – calculation period HalfLength – smoothing of the average BandsDeviatio
    Market Structure Zig Zag
    Lesedi Oliver Seilane
    4.66 (29)
    Free Market structure zig zag to assist in price action trading the screenshots describe how to use and how to spot patterns new version comes with alerts, email alert and  push notification alert can be used on all pairs  can be used on all timeframes  you can add additional confirmation indicators the indicator shows you your higher high and low highs as well as your lower lows and lower highs  the indication makes price action analysis easier to spot.
    FREE
    PZ Trendlines
    PZ TRADING SLU
    4.27 (11)
    Tired of plotting trendlines? The PZ TrendLines indicator applies a mechanical approach to the construction of trend lines for you! [ Installation Guide | Update Guide | Troubleshooting | FAQ | All Products ] It can draw up to 18 trendlines Trendlines can be optionally based on fractals Each line represents a breakout level Each trendline can be broken or rejected Configurable amount of lines Configurable colors Author Arturo López Pérez, private investor and speculator, software engineer and
    FREE
    Buyers of this product also purchase
    Gann Made Easy
    Oleg Rodin
    4.83 (156)
    Gann Made Easy is a professional and easy to use Forex trading system which is based on the best principles of trading using the theory of W.D. Gann. The indicator provides accurate BUY and SELL signals including Stop Loss and Take Profit levels. You can trade even on the go using PUSH notifications. PLEASE CONTACT ME AFTER PURCHASE TO GET TRADING  INSTRUCTIONS AND GREAT EXTRA INDICATORS   FOR FREE! Probably you already heard about the Gann trading methods before. Usually the Gann theory is a ve
    Scalper Inside PRO
    Alexey Minkov
    4.74 (69)
    An exclusive indicator that utilizes an innovative algorithm to swiftly and accurately determine the market trend. The indicator automatically calculates opening, closing, and profit levels, providing detailed trading statistics. With these features, you can choose the most appropriate trading instrument for the current market conditions. Additionally, you can easily integrate your own arrow indicators into Scalper Inside Pro to quickly evaluate their statistics and profitability. Scalper Inside
    M1 Sniper
    Oleg Rodin
    5 (20)
    M1 SNIPER is an easy to use trading indicator system. It is an arrow indicator which is designed for M1 time frame. The indicator can be used as a standalone system for scalping on M1 time frame and it can be used as a part of your existing trading system. Though this trading system was designed specifically for trading on M1, it still can be used with other time frames too. Originally I designed this method for trading XAUUSD and BTCUSD. But I find this method helpful in trading other markets a
    Atomic Analyst
    Issam Kassas
    5 (4)
    First of all Its worth emphasizing here that this Trading Indicator is   Non-Repainting , Non Redrawing and Non Lagging Indicator   Indicator, Which makes it ideal from both manual and robot trading.  User manual: settings, inputs and strategy . The Atomic Analyst  is a PA Price Action Indicator that uses Strength and Momentum of the price to find a better edge in the market. Equipped with Advanced filters which help remove noises and false signals, and Increase Trading Potential. Using Multiple
    Linear Trend Predictor - A trend indicator that combines entry points and direction support lines. It works on the principle of breaking through the High/Low price channel. The indicator algorithm filters market noise, takes into account volatility and market dynamics. Indicator capabilities Using smoothing methods, it shows the market trend and entry points for opening BUY or SELL orders. Suitable for determining short-term and long-term market movements by analyzing charts on any timeframes.
    The " Dynamic Scalper System " indicator is designed for the scalping method of trading within trend waves. Tested on major currency pairs and gold, compatibility with other trading instruments is possible. Provides signals for short-term opening of positions along the trend with additional price movement support. The principle of the indicator. Large arrows determine the trend direction. An algorithm for generating signals for scalping in the form of small arrows operates within trend waves.
    Trend Screener
    STE S.S.COMPANY
    4.79 (95)
    Trend Screener Indicator --Professional Trend Trading & Market Scanning System for MetaTrader Unlock the true power of trend trading with Trend Screener Indicator — a complete multi-currency, multi-timeframe trend analysis solution   powered by Fuzzy Logic,Trend Pulse Technology  and advanced market structure algorithms.   Trend Screener transforms your MetaTrader platform into a professional-grade Trend Analyzer and Market Scanner, helping you identify high-probability trend opportunities, ear
    Trend Lines PRO
    Roman Podpora
    5 (1)
    TREND LINES PRO    helps understand where the market is truly changing direction. The indicator shows real trend reversals and points where major players re-enter. You see   BOS lines   Trend changes and key levels on higher timeframes — without complex settings or unnecessary noise. Signals don't repaint and remain on the chart after the bar closes. VERSION MT 5     -     Reveals its maximum potential when paired with the   RFI LEVELS PRO  indicator What the indicator shows: Real shifts   tren
    NAM Order Blocks
    NAM TECH GROUP, CORP.
    3.67 (3)
    MT4 Multi-timeframe Order Blocks detection indicator. Features - Fully customizable on chart control panel, provides complete interaction. - Hide and show control panel wherever you want. - Detect OBs on multiple timeframes. - Select OBs quantity to display. - Different OBs user interface. - Different filters on OBs. - OB proximity alert. - ADR High and Low lines. - Notification service (Screen alerts | Push notifications). Summary Order block is a market behavior that indicates order collection
    GOLD Impulse with Alert
    Bernhard Schweigert
    4.67 (12)
    This indicator is a super combination of our 2 products  Advanced Currency IMPULSE with ALERT  and  Currency Strength Exotics . It works for all time frames and shows graphically impulse of strength or weakness for the 8 main currencies plus one Symbol! This Indicator is specialized to show currency strength acceleration for any symbols like Gold, Exotic Pairs, Commodities, Indexes or Futures. Is first of its kind, any symbol can be added to the 9th line to show  true currency strength accelerat
    MTF Supply Demand Zones
    Georgios Kalomoiropoulos
    4.82 (22)
    Next Generation Of Automated Supply And Demand Zones. New and Innovative Algorithm that Works At Any Chart. All Zones Are Being Created Dynamically According To Price Action Of The Market. AMAZING OFFER --> Activations from 5 to 20 for "MTF Supply Demand Zones" and "Automated Trendlines" If you get the MTF Supply Demand Zones you can join the " Trade Like Me " Video Series. It contains 14 Live Sessions where  i am placing trades on Forex, Stocks, Indices and Metals. You will be able to see ho
    MetaForecast M4
    Vahidreza Heidar Gholami
    5 (2)
    MetaForecast predicts and visualizes the future of any market based on the harmonics in price data. While the market is not always predictable, if there is a pattern in the price, MetaForecast can predict the future as accurately as possible. Compared to other similar products, Metaforecast can generate more accurate results by analyzing market trends. Input Parameters Past size Specifies the number of bars that MetaForecast uses to create a model for generating future predictions. The model is
    Introducing the Delta Volume Profile Indicator - Unleash the Power of Institutional Precision!  Technical Indicator: Are you ready to trade like the pros? The Delta Volume Profile Indicator is no ordinary tool. It’s a high-precision, cutting-edge indicator that puts the power of institutional-grade trading in your hands. This unique indicator analyses delta volume distribution in real-time, revealing the market's hidden buy/sell imbalances that the biggest financial institutions rely on to antic
    RFI levels PRO
    Roman Podpora
    5 (1)
    The indicator accurately shows the reversal points and price return zones where the   Major players . You see where new trends are forming and make decisions with maximum precision, maintaining control over every trade. VERSION MT5     -     Reveals its maximum potential when combined with the   TREND LINES PRO   indicator What the indicator shows: Reversal structures and reversal levels with activation at the beginning of a new trend. Display of   TAKE PROFIT   and   STOP LOSS   levels with mi
    TPSpro RFI Levels
    Roman Podpora
    4.86 (28)
    INSTRUCTIONS RUS   /   INSTRUCTIONS   ENG   -   VERSION  MT5 Main functions: Displays active zones of sellers and buyers! The indicator displays all the correct first impulse levels/zones for purchases and sales. When these levels/zones are activated, where the search for entry points begins, the levels change color and are filled with certain colors. Arrows also appear for a more intuitive perception of the situation. LOGIC AI - Display of zones (circles) for searching entry points when activa
    Adaptive Volatility Range [AVR] is a powerful tool for identifying key trend reversal points. AVR accurately reflects the Average True Range (ATR) of volatility, taking into account the Volume-Weighted Average Price (VWAP). The indicator adapts to any market volatility by calculating the average volatility over a specific period, ensuring a stable rate of profitable trades. You receive not just an indicator but a professional automated trading system , AVR-EA . Advantages: Automated Trading Sys
    Dynamic Forex28 Navigator
    Bernhard Schweigert
    4.43 (7)
    Specials Discount now. The Next Generation Forex Trading Tool. Dynamic Forex28 Navigator is the evolution of our long-time, popular indicators, combining the power of three into one: Advanced Currency Strength28 Indicator (695 reviews) + Advanced Currency IMPULSE with ALERT (520 reviews) + CS28 Combo Signals (recent Bonus) Details about the indicator  https://www.mql5.com/en/blogs/post/758844 What Does The Next-Generation Strength Indicator Offer? Everything you loved about the originals, now
    Super Reversal Indicator with Alert Overview Super Reversal Indicator with Alert is a multi timeframe trading tool designed to identify high probability market reversal opportunities using a combination of stochastic momentum, supply and demand zones, and price rejection signals. The indicator helps traders detect potential turning points in the market with clear visual signals and real time alerts. Key Features Multi Timeframe Stochastic Analysis Uses stochastic oscillator from a higher timefra
    Free Test Drive Available (EURUSD & AUDUSD) Access via the official BlueDigitsFx Discord Server Test the indicator before upgrading to the full version BlueDigitsFx Easy 123 System — Powerful Reversal and Breakout Detection for MT4 All-In-One Non-Repaint System for Spotting Market Reversals and Breakouts – Built for Newbie and Expert Traders The BlueDigitsFx Easy 123 System is a visual and alert-based MT4 indicator that helps you detect market structure shifts, breakouts, and trend reversals w
    Advanced Supply Demand
    Bernhard Schweigert
    4.91 (299)
    Trading Special – 40% OFF Best Solution for any Newbie or Expert Trader! This indicator is a unique, high quality and affordable trading tool because we have incorporated a number of proprietary features and a new formula. With this update, you will be able to show double timeframe zones. You will not only be able to show a higher TF but to show both, the chart TF, PLUS the higher TF: SHOWING NESTED ZONES. All Supply Demand traders will love it. :) Important Information Revealed Maximize the pot
    LIMITED TIME SALE - 30% OFF! WAS $50 - NOW JUST $35! Profit from market structure changes as price reverses and pulls back. The market structure reversal alert indicator identifies when a trend or price move is approaching exhaustion and ready to reverse. It alerts you to changes in market structure which typically occur when a reversal or major pullback are about to happen. The indicator identifies breakouts and price momentum initially, every time a new high or low is formed near a po
    Currency Strength Wizard is a very powerful indicator that provides you with all-in-one solution for successful trading. The indicator calculates the power of this or that forex pair using the data of all currencies on multiple time frames. This data is represented in a form of easy to use currency index and currency power lines which you can use to see the power of this or that currency. All you need is attach the indicator to the chart you want to trade and the indicator will show you real str
    Volatility Trend System - a trading system that gives signals for entries. The volatility system gives linear and point signals in the direction of the trend, as well as signals to exit it, without redrawing and delays. The trend indicator monitors the direction of the medium-term trend, shows the direction and its change. The signal indicator is based on changes in volatility and shows market entries. The indicator is equipped with several types of alerts. Can be applied to various trading ins
    Super Signal Market Slayer No Repaint | High Accuracy | Multi-Market Intelligent Trend Indicator In trading, the real challenge is not placing an order, but clearly seeing when a trend has truly begun amid market noise. Market Slayer was created for this purpose. It is a no-repaint intelligent indicator designed specifically for intraday trading. Through multi-layer confirmation and trend-filtering logic, it delivers clear and reliable Buy / Sell signals only at key moments. Key Advantages No r
    TrendLine PRO MT4
    Evgenii Aksenov
    4.83 (167)
    The Trend Line PRO indicator is an independent trading strategy. It shows the trend change, the entry point to the transaction, as well as automatically calculates three levels of Take Profit and Stop Loss protection. Trend Line PRO is perfect for all Meta Trader symbols: currencies, metals, cryptocurrencies, stocks and indices. The indicator is used in trading on real accounts, which confirms the reliability of the strategy. Robots using   Trend Line PRO   and real Signals can be found here:   
    Stratos Pali
    Michela Russo
    4.43 (7)
    Stratos Pali Indicator   is a revolutionary tool designed to enhance your trading strategy by accurately identifying market trends. This sophisticated indicator uses a unique algorithm to generate a complete histogram, which records when the trend is Long or Short. When a trend reversal occurs, an arrow appears, indicating the new direction of the trend. Important Information Revealed Leave a review and contact me via mql5 message to receive My Top 5 set files for Stratos Pali at no cost! Dow
    FX Power MT4 NG
    Daniel Stein
    4.95 (21)
    FX Power: Analyze Currency Strength for Smarter Trading Decisions Overview FX Power is your go-to tool for understanding the real strength of currencies and Gold in any market condition. By identifying strong currencies to buy and weak ones to sell, FX Power simplifies trading decisions and uncovers high-probability opportunities. Whether you’re looking to follow trends or anticipate reversals using extreme delta values, this tool adapts seamlessly to your trading style. Don’t just trade—trade
    Matrix Arrow Indicator MT4
    Juvenille Emperor Limited
    5 (3)
    Matrix Arrow Indicator MT4  is a unique 10 in 1 trend following 100% non-repainting  multi-timeframe indicator that can be used on all symbols/instruments: forex, commodities, cryptocurrencies, indices, stocks.  Matrix Arrow Indicator MT4 will determine the current trend at its early stages, gathering information and data from up to 10 standard indicators, which are: Average Directional Movement Index (ADX) Commodity Channel Index (CCI) Classic Heiken Ashi candles Moving Average Moving Avera
    Scalper Vault
    Oleg Rodin
    5 (36)
    Scalper Vault is a professional scalping system which provides you with everything you need for successful scalping. This indicator is a complete trading system which can be used by forex and binary options traders. The recommended time frame is M5. The system provides you with accurate arrow signals in the direction of the trend. It also provides you with top and bottom signals and Gann market levels. The indicator provides all types of alerts including PUSH notifications. PLEASE CONTACT ME AFT
    After purchase, contact me privately to receive 7 days of free testing with EA Forex Proton. This advanced MT4 trading robot automatically executes signals from any MT4 indicator, including Market Makers. The latest version also includes AI integration, allowing each trade signal to be analyzed using Artificial Intelligence. Market Makers is a powerful price action trading system designed to identify high-probability Buy and Sell opportunities based on market momentum, volatility, and price po
    More from author
    MTF Kijun
    Kristmundur Roman Zakharii
    4 (1)
    The indicator plots higher timeframe Kijun-sen (of Ichimoku ) on lower timeframes. To change timeframes, in the timeframe field enter the number: M1    PERIOD_M1 1 1 minute. M5    PERIOD_M5 5 5 minutes. M15  PERIOD_M15 15 15 minutes. M30  PERIOD_M30 30 30 minutes. H1    PERIOD_H1 60 1 hour. H4    PERIOD_H4 240 4 hour. D1    PERIOD_D1 1440 Daily. W1   PERIOD_W1 10080 Weekly. MN1  PERIOD_MN1 43200 Monthly. By default, the Kijun is shifted 3 periods forward but if you wish to have it exactly as
    Master Candle
    Kristmundur Roman Zakharii
    Master Candle (MC) Indicator automatically detects "Master Candles", also known as "Mother Candles", i.e. candle that engulf several candles that follow them. See screenshots. You can choose how many candles Master Candle should engulf. By default it is set to 4. Feel free to change colour and thickness of lines as it suites you. I find this indicator to be very useful to identify congestions and breakouts, especially on 60 minutes charts. Usually if you see candle closing above or below "Maste
    FREE
    MACD Platinum
    Kristmundur Roman Zakharii
    This version of the MACD named MACD Platinum is the   MACD indicator calculated with ZeroLag moving averages (ZLEMA) .   ZLEMA is an abbreviation of   Zero Lag   Exponential   Moving Average . It was developed by John Ehlers and Rick Way. ZLEMA is a kind of Exponential   moving average   but its main idea is to eliminate the lag arising from the very nature of the   moving averages   and other trend following indicators.
    Japanese Candle Patterns
    Kristmundur Roman Zakharii
    This indicator (translated from the Japanese source) automatically identifies authentic Japanese candlepatterns (Japanese Sakata Gohou rules) and displays with arrows the following Japanese candlestick patterns: BEARISH AND BULLISH ENGULFING CANDLES (known as Tsutsumi in Japanese) BULLISH THREE WHITE SOLDIERS BEARISH THREE BLACK CROWS BEARISH EVENING STARS BULLISH MORNING STARS THREE LINES THREE INSIDE DOWN (marks with a box) THREE INSIDE UP (marks with a box) You can switch off or on to have
    Hurst Channel
    Kristmundur Roman Zakharii
    This tool is known as the Hurst Channel  or Hurst Bands . At first sight, it might resemble the  Bollinger Bands  because it consist of three bands, upper, lower and middle band.  So how do you trade this? If the asset is in a downtrend , you will see lower highs . If these lower highs retrace up to the upper band, you go with the main trend and take a sell. If you are in an uptrend , you should see higher lows that bounce off of the lower band. Stay concentrated on the highs and lows! For targ
    Filter:
    No reviews
    Reply to review