Yearly Levels
- Indikatoren
- Version: 1.0
- Aktivierungen: 15

Dieser Indikator zeichnet automatisch die Jahreshöchst-, Jahrestiefst- und Jahresdurchschnittskurse des vergangenen Jahres auf.
Er bildet außerdem zwei zusätzliche äquidistante parallele Niveaus (Erweiterte Hochs R2, R3 / ErweiterteTiefs S2, R3), die sich vom vorherigen Jahreshoch / -tief ausdehnen.
Erweitertes Hoch R3 / Tief S3 ist eine 100-prozentige Tief-zu-Hoch-Erweiterung(wie bei Fibonacci 100 %-Erweiterungen) über / unter dem Vorjahreshoch/-tief und ist die endgültige Umkehrebene mit einer sicheren Reaktion.
Erweiterte Hoch-/Tiefpunkte R3/S3 stellen den ultimativen jährlichen Widerstand/Unterstützung dar .
Das Tool zeigt auch diemittleren Jahresniveaus (MS1 und MR1) zwischen dem Jahresdurchschnitt und dem Jahreshoch/-tief sowie die mittleren Niveaus (MR2, MR3, MS2, MS3) zwischen den erweiterten HL-Niveaus an.
In der Regel bleibt der Kurs an den mittleren Jahresniveaus stehen oder testet sie erneut, um sie zu durchbrechen. Das erweiterte MS2-Jahresniveau wurde im März 2020 zum ultimativen Tiefpunkt des EURUSD-Kurses.
Der monatliche Schlusskurs über dem Jahreshoch bzw. unter dem Jahrestief bestätigt den jährlichen Ausbruch bzw. Zusammenbruch und legt den jährlichen Trend fest.
Auf jedem Jahresniveau beobachten wir größere Preisreaktionen, die mehrere Tage andauern. Nach dem Durchbruch des Jahresniveaus geht der Preis in der Regel zu einem erneuten Test über.
ANWENDUNG UND VORTEILE:
Ich bin der Meinung, dass "Jahreshöchst- und -tiefststände" zusammen mit dem Jahresdurchschnittspreis ein unverzichtbares Instrument für jeden Händler sind, da sie wichtige Unterstützungs- und Widerstandsmarken darstellen, an denen wirUmkehrungen, Staus, Stauungen oder Wiederholungsprüfungen beobachten können.
Um wichtige Umkehrungen zu vermeiden, muss jeder Trendhändler die Jahrestiefs und -hochs kennen, die man mit bloßem Auge nicht erkennen kann.
Der Handel mit den Jahrestiefs und -hochs beseitigt jegliche Subjektivität, da sie über alle Zeitrahmen hinweg gleich bleiben.
Nutzen Sie dieJahresschwellen alsZiele und Ausstiege, da der Preis sie in der Regel sicher erreicht, oder alsUmkehrpunkte (nach einem erneuten Test oder einer Ablehnung) für Einstiege.
Verwenden Sie die Yearly Levels zusammen mit den statischen gleitenden MTF-Durchschnitten (die sich nicht ändern, wenn Sie die Charts umdrehen) oder anderen Trenderkennungsinstrumenten (z. B. Ichimoku, MACD).
Für die Trenderkennung bevorzuge ich den Zusatz "multitimeframe 8 EMA (Trigger Line)". - 8 EMA 4hrs, 8 EMA daily, 8 EMA weekly und 8 EMA monthly. Dies ist ein effektives und nicht-subjektives Handelssystem insgesamt.
Es ist möglich, die Farbe der Levels auf Silber oder Grau zu ändern, um das Diagramm nicht zu überladen.
BEISPIELE:
- 2020 ROHÖL: Nachdem UKOIL das 2019er-Tief durchbrochen hatte, kehrte es zum erweiterten Tief S3 zurück und erreichte im Dezember das 2019er-Tief bei 52,28 (mit sofortiger Reaktion bei dessen Erreichen) - SIEHE SCREENSHOT.
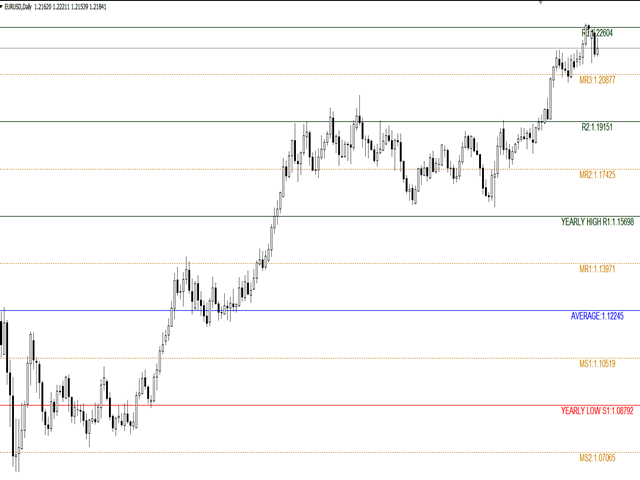
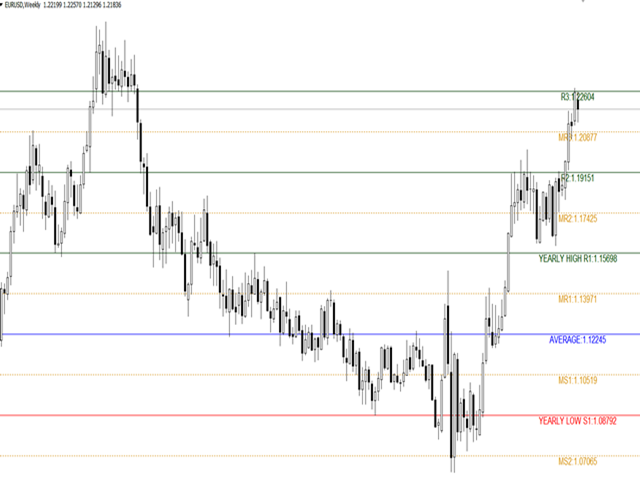
- 2020 EURUSD: Das erweiterte Jahreshoch R3 (100-prozentige Tief-Hoch-Erweiterung vom 2019er-Hoch) wurde zur Spitze der EURUSD-Aufwärtsrallye 2020 (die Rallye begann nach dem Bruch und dem erneuten Test des 2019er-Tiefs nach oben) - SIEHE SCREENSHOT.
- 2020 EURUSD: Die März-Kerze schloss nicht unter dem 2019er-Tief und entkräftete damit den Durchbruch (mehrfaches Durchstoßen auf niedrigeren Zeitskalen).
- 2020 SP500: US500 hat einen doppelten Retest des 2019er Hochs durchgeführt, nachdem es nach oben durchbrochen wurde - SIEHE SCREENSHOT.
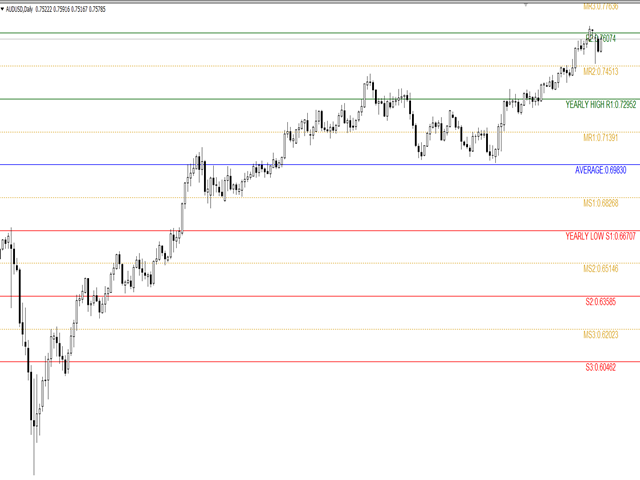
- 2020 AUDUSD: AUDUSD zeigte größere Reaktionen auf allen Jahresebenen. Der Abwärtstrend im März begann mit dem Tief von 2019. Der Preis machte einen Swing unter das ausgedehnte Jahrestief S3 und kehrte zum 2019er-Tief (S1) zurück und blieb darunter stehen. Nachdem der AUD vom 2019er-Hoch zurückgewiesen wurde, kehrte er zum 2019er-Durchschnittspreis zurück, von wo aus er einen weiteren Ausbruchsversuch unternahm - SIEHE BILDFOTOGRAPHIE.
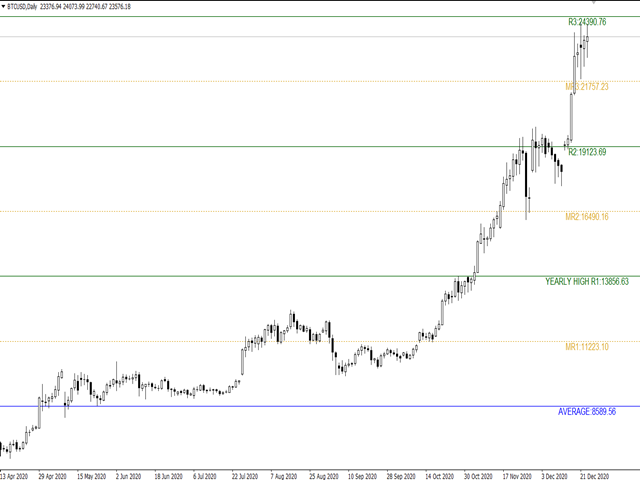
- 2020 BTCUSD: Bitcoin sah eine Stauung entlang des 2019er Durchschnittspreises. Die zinsbullische Rallye startete vom 2019er Hoch und kam am erweiterten Jahreshoch R2 zum Stillstand. Nach der Stauung und dem Bruch von R2 begann die zweite Aufwärtsrallye wieder bei R2 und endete bei R3 (maximaler Bitcoin-Preis im Jahr 2020) - SIEHE SCREENSHOT.