KT Asian Breakout Indicator MT5
- 지표
-
KEENBASE SOFTWARE SOLUTIONS
 Keenbase Trading은 트레이더가 더욱 정확하고 신뢰할 수 있는 거래 결정을 내릴 수 있도록 MetaTrader 4 및 MetaTrader 5용 전문 지표와 Expert Advisor(EA)를 개발합니다.
당사의 제품은 실전에서 활용할 수 있는 거래 로직과 직관적인 사용자 경험을 결합하여 안정성, 사용 편의성, 그리고 체계적인 리스크 관리에 중점을 두고 설계되었습니다. 모든 도구는 철저한 테스트를 거쳐 실제 시장 환경에서도 일관되고 안정적인 성능을 제공할 수 있도록 개발됩니다. - 버전: 1.1
- 업데이트됨: 28 5월 2020
- 활성화: 5
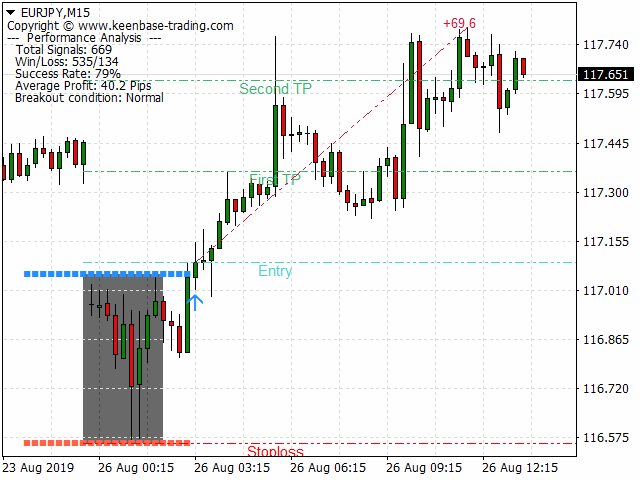
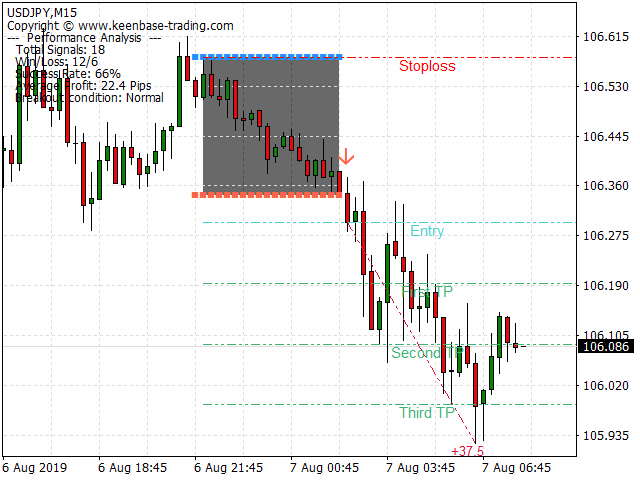
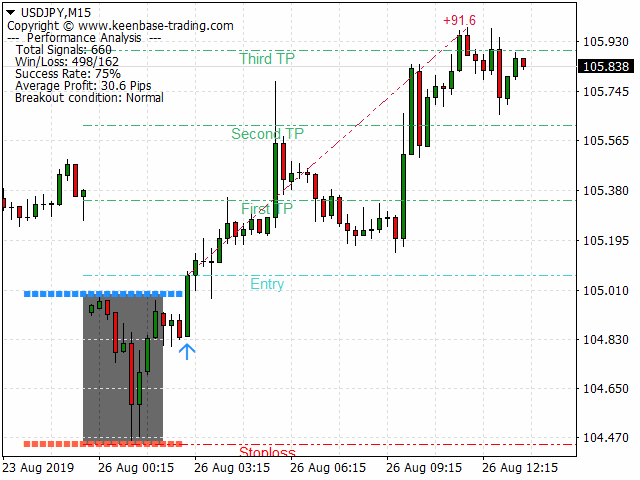
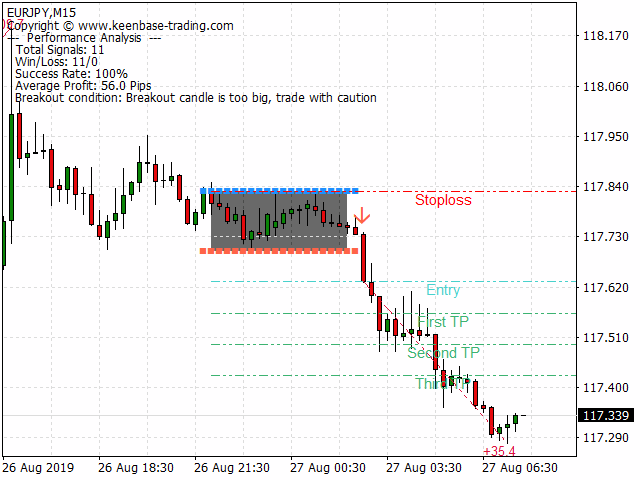
KT Asian Breakout 지표는 아시아 세션의 중요한 부분을 분석하여 가격 돌파 방향에 따라 매수 및 매도 신호를 생성합니다. 가격이 세션 최고점을 돌파하면 매수 신호가 발생하며, 가격이 세션 최저점을 돌파하면 매도 신호가 발생합니다.
유의 사항
- 세션 박스의 높이가 너무 넓다면, 대부분의 가격 움직임이 이미 세션 내에서 발생했기 때문에 새로운 거래를 피하는 것이 좋습니다.
- 돌파 캔들이 너무 크면, 가격이 신호 방향으로 계속 진행하기 전에 일시적인 되돌림이 발생할 가능성이 높습니다.
기능
- 매수/매도 신호에 스톱로스 및 목표 이익 수준이 포함됩니다.
- KT Asian Breakout 지표는 첫 번째, 두 번째 또는 세 번째 목표 이익을 기준으로 성과를 지속적으로 확인합니다.
- 승/패 신호 수, 성공률, 신호당 평균 핍스와 같은 세 가지 주요 성과 지표를 표시합니다.
- 돌파 캔들이 너무 크면 차트에 경고 메시지가 표시됩니다.
추천 설정
- 시간 프레임: 15분.
- 통화쌍: 모든 JPY 쌍.
입력 매개변수
- 세션 박스 표시: true/false
- 스톱로스 및 목표 이익 표시: true/false
- 성과 분석: true/false
- 텍스트 분석 표시 (왼쪽 상단): true/false
- 성공률 기준: 첫 번째 목표 | 두 번째 목표 | 세 번째 목표
- 색상 및 스타일 설정: 사용자 지정 가능
- 알림 설정: 사용자 지정 가능
개발자용
// 배열 정의
double Buy_Signal[];
double Sell_Signal[];
double Buy_Stoploss[];
double Sell_Stoploss[];

// 인디케이터 핸들 정의
int indicator_handle = iCustom(_Symbol,0,"Market/KT Asian Breakout Indicator");

// 버퍼를 배열에 복사
CopyBuffer(indicator_handle,0,1,1,Buy_Signal);
CopyBuffer(indicator_handle,1,1,1,Sell_Signal);
CopyBuffer(indicator_handle,2,1,1,Buy_Stoploss);
CopyBuffer(indicator_handle,3,1,1,Sell_Stoploss);

if(Buy_Signal[0]!=0) // 매수 조건 충족
if(Sell_Signal[0]!=0) // 매도 조건 충족
Buy_SL[0]; // 매수 스톱로스
Sell_SL[0]; // 매도 스톱로스

// 차트에서 목표값 가져오기
double Quick_Profit = NormalizeDouble(ObjectGetDouble(0,"KT_FTP",OBJPROP_PRICE),_Digits);
double First_Target  = NormalizeDouble(ObjectGetDouble(0,"KT_STP",OBJPROP_PRICE),_Digits);
double Final_Target  = NormalizeDouble(ObjectGetDouble(0,"KT_TTP",OBJPROP_PRICE),_Digits);