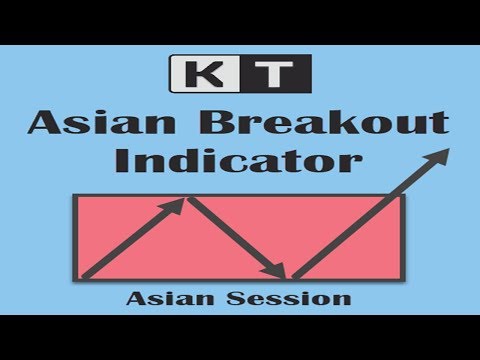
KT Asian Breakout Indicator MT5
- Indicatori
-
KEENBASE SOFTWARE SOLUTIONS
 Keenbase Trading sviluppa indicatori professionali ed Expert Advisor per MetaTrader 4 e MetaTrader 5, progettati per aiutare i trader a prendere decisioni di trading più consapevoli.
 - Versione: 1.1
- Aggiornato: 28 maggio 2020
- Attivazioni: 5
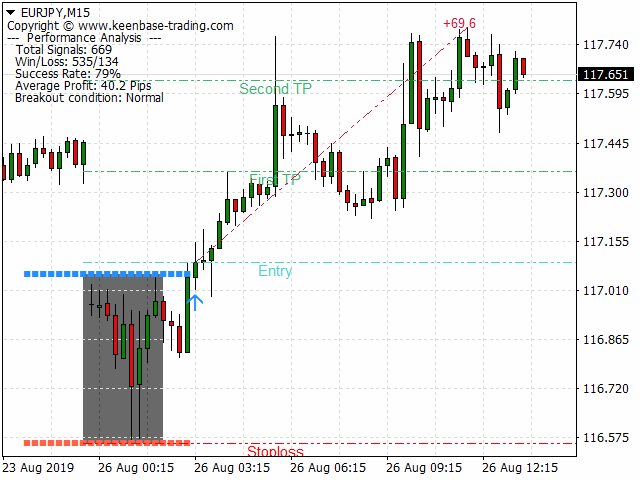
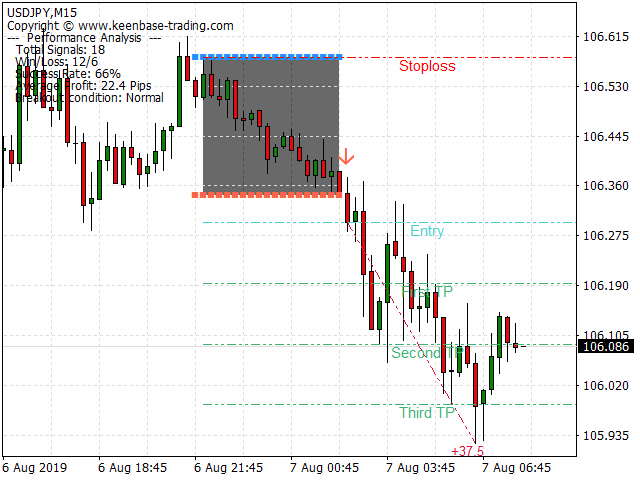
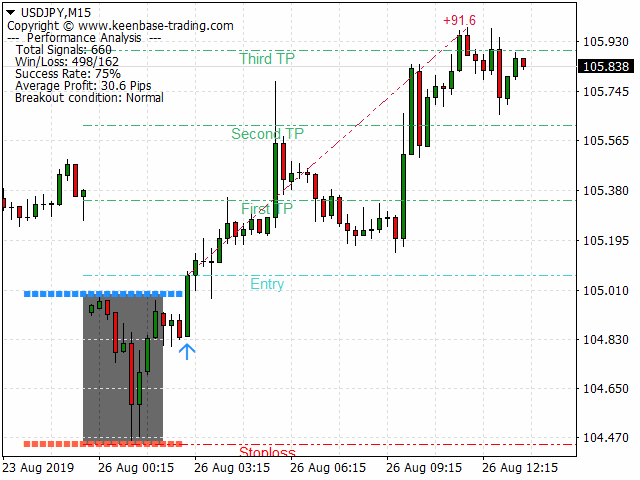
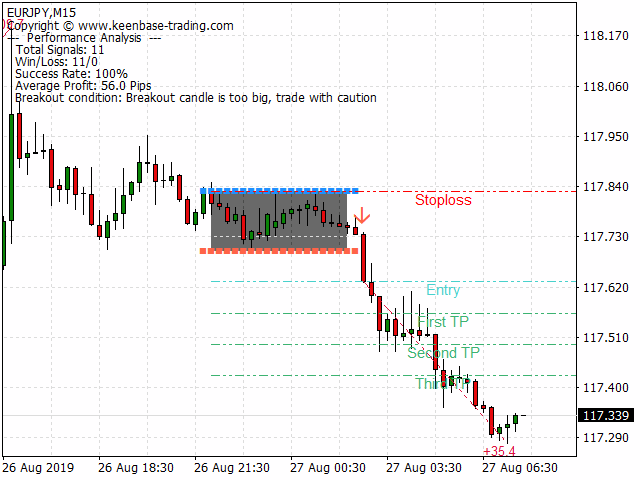
L'indicatore KT Asian Breakout analizza una parte cruciale della sessione asiatica per generare segnali di acquisto e vendita in entrambe le direzioni, in base alla rottura del prezzo. Un segnale di acquisto si verifica quando il prezzo supera il massimo della sessione, mentre un segnale di vendita si verifica quando il prezzo scende al di sotto del minimo della sessione.
Cose da ricordare
- Se la scatola della sessione è troppo ampia verticalmente, è consigliabile evitare di entrare in nuovi trade, poiché la maggior parte del movimento dei prezzi si è già verificata all'interno della scatola.
- Se la candela di breakout è troppo grande, il prezzo spesso effettua una correzione temporanea prima di proseguire nella direzione del segnale.
Caratteristiche
- I segnali di acquisto/vendita includono livelli di stop-loss e obiettivi di profitto.
- L’indicatore KT Asian Breakout monitora costantemente le sue prestazioni utilizzando il primo, il secondo o il terzo obiettivo di profitto come criterio di successo.
- Mostra tre metriche di prestazione essenziali: numero di segnali vincenti/perdenti, tasso di successo e pip medi per segnale.
- Se la candela di breakout è troppo grande, viene visualizzato un messaggio di avviso sul grafico.
Raccomandazioni
- Timeframe: 15 minuti.
- Coppie di valute: Tutte le coppie in JPY.
Parametri di ingresso
- Mostra la scatola della sessione: true/false
- Mostra stop-loss e obiettivi di profitto: true/false
- Analisi delle prestazioni: true/false
- Mostra analisi testuale (in alto a sinistra): true/false
- Criterio del tasso di successo: primo obiettivo | secondo obiettivo | terzo obiettivo
- Impostazioni colore e stile: personalizzabile
- Impostazioni di avviso: personalizzabile
Sviluppatori
// Definizione degli array
double Buy_Signal[];
double Sell_Signal[];
double Buy_Stoploss[];
double Sell_Stoploss[];

// Definizione dell'handle dell'indicatore
int indicator_handle = iCustom(_Symbol,0,"Market/KT Asian Breakout Indicator");

// Copia dei buffer negli array
CopyBuffer(indicator_handle,0,1,1,Buy_Signal);
CopyBuffer(indicator_handle,1,1,1,Sell_Signal);
CopyBuffer(indicator_handle,2,1,1,Buy_Stoploss);
CopyBuffer(indicator_handle,3,1,1,Sell_Stoploss);

if(Buy_Signal[0]!=0) // Condizione di acquisto attivata
if(Sell_Signal[0]!=0) // Condizione di vendita attivata
Buy_SL[0]; // Stop-loss per acquisto
Sell_SL[0]; // Stop-loss per vendita

// Recupero degli obiettivi dal grafico
double Quick_Profit = NormalizeDouble(ObjectGetDouble(0,"KT_FTP",OBJPROP_PRICE),_Digits);
double First_Target  = NormalizeDouble(ObjectGetDouble(0,"KT_STP",OBJPROP_PRICE),_Digits);
double Final_Target  = NormalizeDouble(ObjectGetDouble(0,"KT_TTP",OBJPROP_PRICE),_Digits);