KT Asian Breakout Indicator MT5
- Indicadores
-
KEENBASE SOFTWARE SOLUTIONS
 A Keenbase Trading desenvolve indicadores profissionais e Expert Advisors para MetaTrader 4 e MetaTrader 5, ajudando traders a tomar decisões de negociação mais informadas.
 - Versão: 1.1
- Atualizado: 28 maio 2020
- Ativações: 5
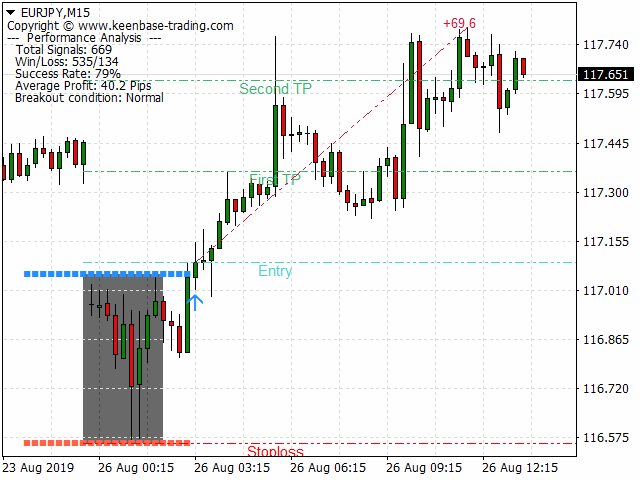
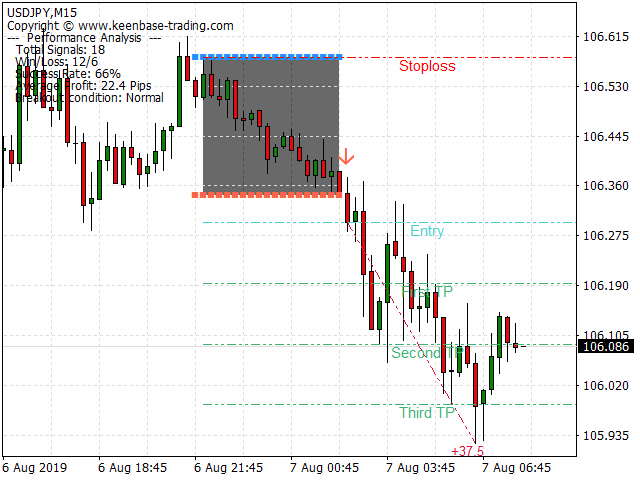
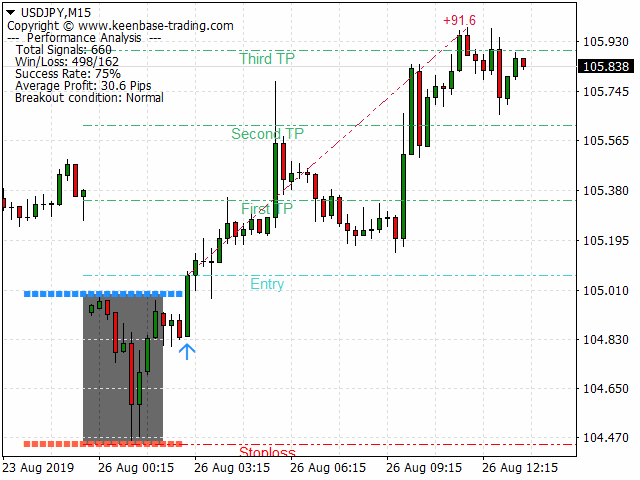
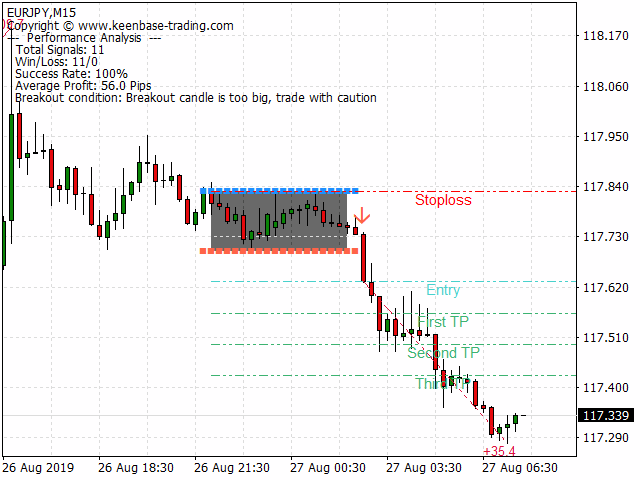
O indicador KT Asian Breakout analisa uma parte crítica da sessão asiática para gerar sinais de compra e venda em ambas as direções, com base na quebra de preço. Um sinal de compra ocorre quando o preço rompe acima da máxima da sessão, enquanto um sinal de venda ocorre quando o preço rompe abaixo da mínima da sessão.
Coisas para lembrar
- Se a caixa da sessão for muito ampla verticalmente, deve-se evitar uma nova negociação, pois a maior parte da ação do preço já ocorreu dentro da sessão.
- Se a vela de rompimento for muito grande, o preço frequentemente faz uma reversão temporária antes de continuar na direção do sinal.
Características
- Os sinais de compra/venda incluem níveis de stop-loss e metas de lucro.
- O indicador KT Asian Breakout monitora constantemente seu desempenho usando o primeiro, segundo ou terceiro alvo de lucro como critério de sucesso.
- Exibe três métricas essenciais de desempenho: número de sinais vencedores/perdedores, taxa de sucesso e pips médios por sinal.
- Se a vela de rompimento for muito grande, uma mensagem de aviso será exibida no gráfico.
Recomendações
- Período de tempo: 15 minutos.
- Pares: Todos os pares JPY.
Parâmetros de entrada
- Desenhar caixa da sessão: true/false
- Desenhar stop-loss e metas de lucro: true/false
- Análise de desempenho: true/false
- Mostrar análise de texto (no canto superior esquerdo): true/false
- Critério de taxa de sucesso: primeiro alvo | segundo alvo | terceiro alvo
- Configuração de cores e estilos: personalizável
- Configuração de alertas: personalizável
Para Desenvolvedores
// Definir arrays
double Buy_Signal[];
double Sell_Signal[];
double Buy_Stoploss[];
double Sell_Stoploss[];

// Definir identificador do indicador
int indicator_handle = iCustom(_Symbol,0,"Market/KT Asian Breakout Indicator");

// Copiar buffer para os arrays
CopyBuffer(indicator_handle,0,1,1,Buy_Signal);
CopyBuffer(indicator_handle,1,1,1,Sell_Signal);
CopyBuffer(indicator_handle,2,1,1,Buy_Stoploss);
CopyBuffer(indicator_handle,3,1,1,Sell_Stoploss);

if(Buy_Signal[0]!=0) // Condição de entrada para compra
if(Sell_Signal[0]!=0) // Condição de entrada para venda
Buy_SL[0]; // Stop-loss de compra
Sell_SL[0]; // Stop-loss de venda

// Obter metas do gráfico
double Quick_Profit = NormalizeDouble(ObjectGetDouble(0,"KT_FTP",OBJPROP_PRICE),_Digits);
double First_Target  = NormalizeDouble(ObjectGetDouble(0,"KT_STP",OBJPROP_PRICE),_Digits);
double Final_Target  = NormalizeDouble(ObjectGetDouble(0,"KT_TTP",OBJPROP_PRICE),_Digits);