Correlation Matrix and Open Position Exposure MT4

  • Indicators
  • Kazuma Uezono
    Kazuma Uezono
    MQL5 / MQL4 / Pine Script v6 developer and active trader.
    Seller on the MQL5 Market (indicators for MT4/MT5).
    Services:
    - TradingView Pine Script to MT5/MT4 conversion (bar-by-bar matching, with tester report)
    - MT4 to MT5 migration
  • Version: 1.0
  • Activations: 5
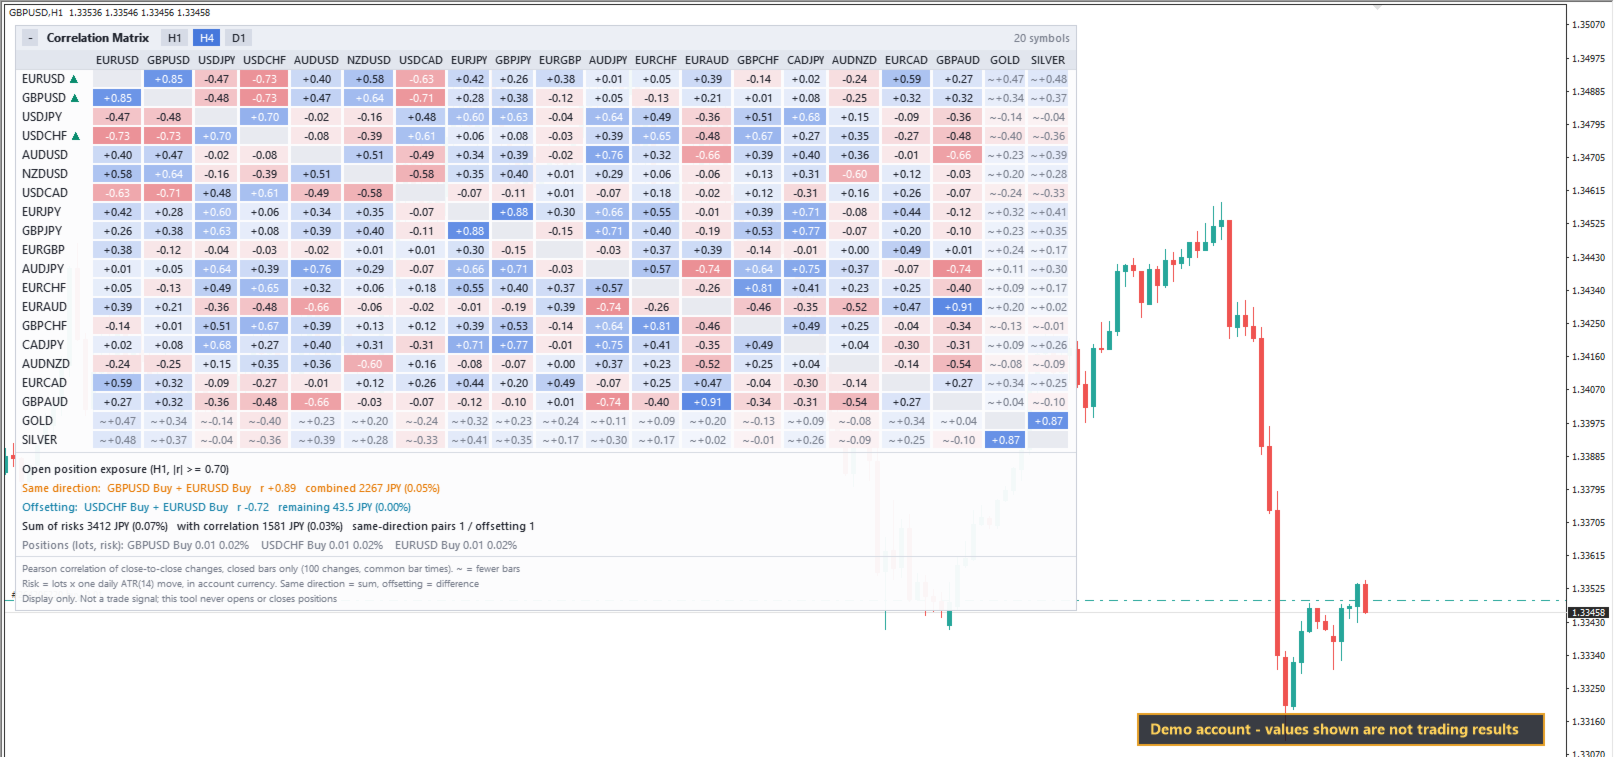
Do several of your open trades really add up to one larger bet? Correlation Matrix and Open Position Exposure MT4 answers this on your MetaTrader 4 chart. One panel combines a correlation heat map of up to 20 symbols with a check of your open market orders: each highly correlated pair of held symbols is labelled "Same direction" (the risks stack) or "Offsetting" (one tends to cancel the other).
The indicator only displays information. It sends no signals and it never opens, changes or closes an order. Correlation values come from past prices and are not a forecast.

Features
- Exposure check of your open buy and sell orders on one timeframe of your choice (H1 by default): net lots per symbol, where buy is plus, sell is minus and opposite orders on one symbol are netted; an estimated risk per symbol; and all held pairs whose |r| reaches the threshold (0.70 by default), with the combined risk of a same-direction pair or the remaining risk of an offsetting pair.
- Two totals: risks simply added together, and an estimate that uses the correlations. Both are also shown as a share of equity.
- Heat map of up to 20 symbols, taken from the top of Market Watch or from a list you type (separated by commas; broker prefix and suffix are found automatically or can be entered). Symbols you hold are always included unless you switch this off.
- Any of M15, M30, H1, H4 and D1 can be calculated (H1, H4 and D1 by default); tabs on the panel switch between them.
- Magic number filter, if you want to check only the orders of one EA.
- Click a row to load that symbol on the chart. The panel can be collapsed, comes in three sizes, picks light or dark colors from the chart background, sits in any corner and stacks with other copies in the same corner.
- Optional alert (off by default) when a new same-direction pair reaches a combined risk of a chosen percentage of equity, by pop-up and/or push notification.
- Two indicator buffers that other programs can read with iCustom.
- Panel text in English or Japanese, chosen automatically from the terminal language unless you set it.

How It Is Calculated
- The forming bar is ignored; only closed bars count. Two symbols are compared only on bars that opened at the same time on both. The last "period + 1" shared bars give a series of close-to-close returns (close divided by the previous close, minus 1), and r is their Pearson correlation.
- When the shared bars are fewer than the period, r uses what is available and is drawn faded with "~"; it is a reference value only. Below 10 returns the cell shows "-".
- Estimated risk of a symbol: its net lots multiplied by what one daily ATR(14) move is worth in the deposit currency. It describes a typical day, not a stop loss and not the most you can lose.
- Pair type: the sign of (direction of A) x (direction of B) x r. Plus means same direction and the two risks are added; minus means offsetting and the difference remains.
- The correlation-aware total is sqrt(E'CE), with E the signed risks and C the correlation matrix of the exposure timeframe. Treat it as a rough guide, not as a statistical prediction.
- Calculation, inputs and alert rules are the same as in the MetaTrader 5 edition; the differences below come from MetaTrader 4 itself.

Main Inputs
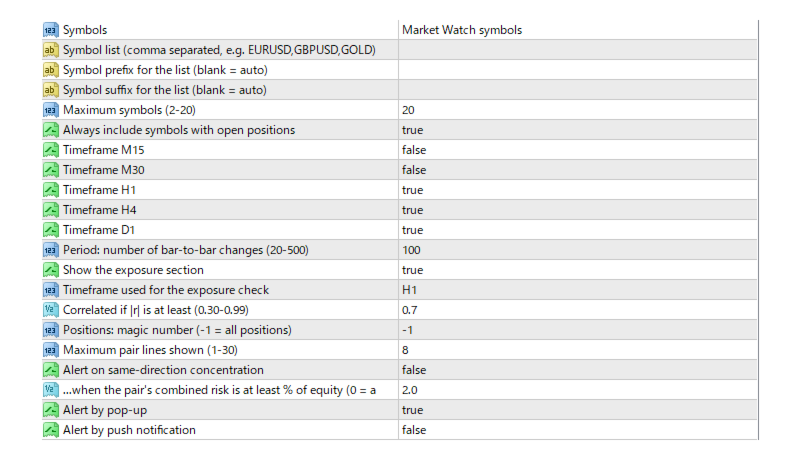
- Symbols group: source (Market Watch or list), symbol list, prefix, suffix, how many symbols (2-20), add held symbols.
- Correlation group: one switch per timeframe and the period, i.e. the number of returns (20-500, default 100).
- Open position exposure group: section on or off, timeframe of the check, |r| threshold (0.30-0.99), magic number (-1 for all orders), how many pair lines (1-30).
- Alerts group: switch, minimum combined risk as % of equity (0 for any pair), pop-up, push.
- Panel group: language, corner, X and Y offset, size, color scheme, notes line, collapsed at start.
- In total 30 inputs, arranged in 6 groups.

Notes and Limits
- Only market orders (buy and sell) are counted. Pending orders such as limits and stops are ignored. A held symbol that is missing from the heat map gets a * because its correlation cannot be judged.
- MetaTrader 4 redraws the panel when a tick arrives or when you click or scroll. New values may therefore appear only with the next tick. On a weekend or any time without ticks, the loading message shown right after you attach the indicator can stay until you touch the chart.
- Bar times depend on the broker. On some MT4 servers, metal and index H4 bars start one hour later than forex H4 bars, so H4 pairs between them have few shared bars and show "~". An index whose H1 and H4 bars start at a quarter past the hour shares no bars with forex symbols on those timeframes and shows "-" (D1 is normal). The calculation itself does not change; it always uses bars with identical times.
- A correlation is a description of the chosen past period. It shifts over time, can fall apart quickly (for example around big news) and does not predict anything. Heat map colors show the sign and strength of r, never a buy or sell. Past values do not guarantee future results, and every trade decision is yours.
- The risk numbers estimate one ordinary daily move. Real moves can be far larger, and gaps, slippage and spread are not included, so they never cap your loss.
- Market Watch mode takes the first 20 symbols listed there; use list mode to choose them yourself. In list mode, symbols missing from Market Watch are added so that data arrives, and removed again when you remove the indicator, unless a chart or an order still needs them.
- Panel height: about 560 pixels for 20 symbols at size Medium, and roughly 630 to 800 pixels when you hold many symbols. On a shorter chart the panel scales down (text to 75% at the smallest), folds extra exposure lines into "+N more lines" while keeping the risk total visible, and as a last step shows only its upper part with a mark in the title. Size Small, fewer symbols, notes off, fewer pair lines or the collapse button make it smaller.
- One-click trading panel: when the indicator sits in the top-left or bottom-left corner, it keeps clear of that panel and follows within about a second when you show or hide it. The right-hand corners never meet it.
- Alerts: one message per pair per 30 minutes at most, nothing for pairs that already existed when the indicator started, and none in the Strategy Tester or from iCustom. Push needs the terminal's notification settings.
- iCustom: read shift 0. Buffer 0 holds the number of same-direction pairs and buffer 1 the largest combined risk among them, in % of equity. The values advance only with ticks; the first time many symbols are loaded it can take from a few seconds to more than a minute. Buffer 1 stays EMPTY until daily ATR data is ready and whenever no same-direction pair exists. Pass inputs within their valid ranges: with an invalid input MetaTrader 4 writes an initialization error to the log every time it is called. In the Strategy Tester without visual mode the indicator stays idle (EMPTY).
- Leave the "Debug" input off; it is only for writing a development check file.

Compatibility and Support
- For MetaTrader 4. The MetaTrader 5 edition is a separate product. Usable on any chart and with the forex, metal, index and other symbols your broker offers.
- No DLL calls and no internet connection.
- Questions are answered through MQL5 messages within 3 business days, for installation, settings and bug reports. Market opinions, trade decisions and advice on which positions to hold are outside the support.


Recommended products
VN Trade Panel II
Vyacheslav Nekipelov
4 (1)
The new version of the trading panel, which now has the ability to separately close Buy and Sell orders, display targets for all orders on the chart, as well as the ability to use the panel to trade with brokers working on the FIFO rule. Also, the new version adds option buttons for separate management of open orders. It has a convenient visualized interface and intuitive control without a lot of additional tabs to which traders have to be distracted and switch their attention. Thanks to this,
Virtual Exchange Reserve Equity Monitor In an environment where exchanges offer increasingly high leverage ratios, it is all the more important for traders to tightly regulate their level of equity .  This software is designed to be run in the background on any virtual private server that can run Meta Trader 4/5.  It implements basic equity control functions ahead of the broker---allowing users to set their own equity trailing stop, an equity limit to lock-in a certain profit margin, and a unive
FREE
The Pairs Spread indicator has been developed for the popular strategy known as pairs trading, spread trading, or statistical arbitrage. This indicator measures the distance (spread) between prices of two directly (positively) correlated instruments and shows the result as a curve with standard deviations. So, traders can quickly identify when the instruments are too far apart and use this information for trade opportunities.  How to use the Pairs Spread indicator Best results are attained whe
The indicator builds current quotes, which can be compared with historical ones and on this basis make a price movement forecast. The indicator has a text field for quick navigation to the desired date. Options: Symbol - selection of the symbol that the indicator will display; SymbolPeriod - selection of the period from which the indicator will take data; IndicatorColor - indicator color; Inverse - true reverses quotes, false - original view; Next are the settings of the text field, in w
HFT Fast Scalping EA
Sami George Saba Zeidan
HFT FAST SCALPING EA the High Frequency Trading which use stop orders to enter the trades when market is trending. best use for 1- Low slippage brokers for us30 and DE40 . 2- LOW OR ZERO COMMISSION BROKERS FOR EUR AND GOLD. 3-Prop firms like ftmo ,tff,.......etc This EA UNLIKE Other HFT EAs , You can see that in the parameters ,, CHOOSE LOT SIZE , MAX LOT , CHOOSE TIME , COMMENT AND OTHERS . IT STOPS 3 MINUTES AUTOMATICALLY EVERY 15 MINUTES TO PROTECT THE EQUITY FROM A BIG UNWANTED SLIPPAGE .
Currency Strength Meter is the easiest way to identify strong and weak currencies. This indicator shows the relative strength of 8 major currencies + Gold: AUD, CAD, CHF, EUR, GBP, JPY, NZD, USD, XAU. Gold symbol can be changed to other symbols like XAG, XAU etc. By default the strength value is normalised to the range from 0 to 100 for RSI algorithm: The value above 60 means strong currency; The value below 40 means weak currency; This indicator needs the data of all 28 major currency pairs a
Spread Control is a compact indicator for MetaTrader 4 that allows you to monitor the current spread and its dynamics directly on the instrument chart. Features Real-time spread monitoring Spread change chart with a history of recent values Calculation of LOW / AVG / HIGH for the displayed period Spread status color indication: normal level; warning level; critical level Visual scale of the current spread value Display of current Bid and Ask Market activity indicator: LIVE — quotes are changing;
VSA Histogram
Richard Bystricky
VSA - P (Volume Spread Analysis) Period-Based Histogram is a tool that visually represents market volume dynamics using Volume Spread Analysis principles, with a focus on highlighting key volume changes over specific time periods. The histogram captures changes in volume and price spread relationships in real-time, enabling traders to detect early signals of accumulation, distribution, and shifts in buying or selling pressure. Indicator is non repainting and working with real-time on tick data.
Like the logic of this tool? Explore the full ecosystem of professional indicators and utilities, built by a trader for traders: All author's products in MQL5 Market: https://www.mql5.com/en/users/musa1994/seller Trading philosophy and details: https://developer-mql4-mql5.netlify.app/ LiquidityVolumePro (MT4) — Smart Money Liquidity & Volume Analysis A professional indicator for MetaTrader 4 that combines liquidity analysis (Smart Money) and volume into a single system. Detects level sw
Currency Strength Meter Pro for MT4
ALEKSANDR SHUKALOVICH
4.3 (10)
Currency Strength Meter is the easiest way to identify strong and weak currencies. This indicator shows the relative strength of 8 major currencies + Gold: AUD, CAD, CHF, EUR, GBP, JPY, NZD, USD, XAU. Gold symbol can be changed to other symbols like XAG, XAU etc. By default the strength value is normalised to the range from 0 to 100 for RSI algorithm: The value above 60 means strong currency; The value below 40 means weak currency; This indicator needs the data of all 28 major currency pairs a
VR Grid
Vladimir Pastushak
5 (3)
The VR Grid indicator is designed to create a graphical grid with user-defined settings. Unlike the standard grid , VR Grid is used to build circular levels . Depending on the user's choice, the step between the round levels can be arbitrary. In addition, unlike other indicators and utilities, VR Grid maintains the position of the grid even when the time period changes or the terminal is rebooted. You can find settings, set files, demo versions, instructions, problem solving, at [blog] You can
FREE
Double Win
Yu Zheng Wang
Introducing the OrderManager: A Revolutionary Utility for MT4 Manage your trades like a pro with the all-new Order Manager utility for MetaTrader 4. Designed with simplicity and ease-of-use in mind, the Order Manager allows you to effortlessly define and visualize the risk associated with each trade, enabling you to make informed decisions and optimize your trading strategy.  Key Features: Risk Management: Define the risk of your trades quickly and easily, allowing you to make better decisio
IceFX VelocityMeter Mini is a very unique indicator on MetaTrader 4 platform which measures the speed of the Forex market . It is not a normal volume or other measurement indicator because IceFX VelocityMeter Mini is capable to understand market speed movements which are hidden in ticks and those valuable information cannot be read in an ordinary way from the candles. The software monitors the received ticks (frequency, magnitude of change) within a specified time range, analyzes these info and
TPSpro Risk Manager
Roman Podpora
3.67 (3)
TPSpro Risk Manager       – is a unique system of professional risk control for traders of any level and any capital. Allows you to avoid losses in trading and serious mistakes in transactions. TPSpro Risk Manager is a must have for risk management and is primarily used by scalpers and day traders, but is successfully used by traders of any trading style. The panel has 3 columns, each of which contains useful information. The first column displays information about the account as of the beginn
Tradegram Pro MT4
Florian Pierre Bonnet
TradeGram Pro MT 4 – Trading Monitoring & Telegram Assistant Launch Price: 49 USD (Limited to the first 30 buyers) Regular Price: 149 USD Your 24/7 Trading Control Center TradeGram Pro connects your MetaTrader 4 to Telegram for  real‑time monitoring  and  automatic alerts when the drawdown reaches thresholds you have defined . Ideal for algorithmic trading on a VPS and for manual traders who need instant alerts on mobile. Conceived to  facilitate the monitoring of your challenge‑style accoun
King Grid
Luis Mariano Vazquez Marcos
King Gold Grid Presentamos con orgullo el revolucionario Asesor Experto de Sistema Grid, una obra maestra creada por  Mr Beast. Este excepcional producto se distingue como uno de los mejores en su categoría, destacando por su magnífica gestión de riesgos y especialización en el trabajo con el oro. Diseñado meticulosamente para optimizar la eficiencia y maximizar los beneficios, este asesor experto se erige como un líder indiscutible en el mundo de los sistemas de rejilla. Su capacidad para adapt
Candle Pattern Engine MT4
Tshidiso Ephraim Mpakanyane
Candle Pattern Engine is a multi-timeframe candlestick pattern recognition indicator. It scans price action across several timeframes simultaneously, detects up to 41 classic candlestick patterns, and can filter signals using a selectable trend indicator to reduce noise from counter-trend patterns. Key Features 1. Multi-Timeframe Pattern Scanning Scans a configurable, comma-separated list of timeframes (e.g. M5, M15, H1) in a single instance. Configurable lookback period controls how many bars
FREE
MarketProfile EForex
Veridiana Adorno Kendrick
Market Profile Shows where the price has spent more time, highlighting important levels that can be used in trading. It is a powerful tool which is designed to take the fundamental components which comprise every market; price/volume/time, and visually display their relationship in real-time as the market develops for a pre-determined time period. Very powerful tool!
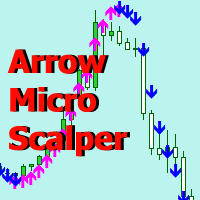
Arrow Micro Scalper - an indicator designed for scalping and short-term trading, integrated into any chart and financial instrument (currency, crypto, stocks, metals). In its work, it uses wave analysis and a trend direction filter. It is recommended to use on time frames from M1 to H4. How to work with the indicator. The indicator contains 2 external parameters for changing the settings, the rest are already configured by default. Large arrows indicate a change in trend direction, blue - the
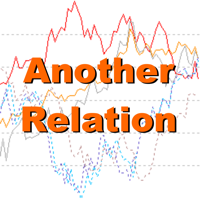
Another Relation displays the relative movement of the other symbols (up to 5) in a separate chart window. The indicator works currency pairs, indices and other quotes. Another Relation allows to visually estimate the symbol correlation and their relative amplitude. Thus, the trader is able to compare the movement of the current instrument to others, identify correlations, delays and make decisions based on their general movement. Indicator usage The window displays the data on all the symbols
Auto Fibo Pro m
DMITRII GRIDASOV
"Auto FIBO Pro"   Crypto_Forex  indicator  - is great auxiliary tool in trading! Indicator automatically calculate and place on chart Fibo levels and local trend lines (red color). Fibonacci levels indicate key areas where price can reverse. Most important levels are 23.6%, 38.2%, 50% and 61.8%. You can use it   for reversal scalping  or for zone grid trading. There are plenty of opportunities to  improve your current system using Auto FIBO Pro indicator as well. It has Info Spread Swap Displa
MQL5 Blogs : https://www.mql5.com/en/blogs/post/761446 MT4 Version : https://www.mql5.com/en/market/product/136790 MT5 Version : https://www.mql5.com/en/market/product/136791 Time Wizard is a professional trading assistant built for traders who need speed, timing, and execution control in one clean dashboard. This Expert Advisor is designed for event-based trading, scheduled execution, and fast semi-automatic order management. It allows you to prepare your orders in advance, define the exact e
Calculate your account's consistency rule in one click! Works for all HFT Prop Firms: - Nova Funding - Infinity Forex Funds - KortanaFx - Next Step Funded - Quantec And many more! --------------------------------------------------- Settings: profitConsistencyPercentage = Max profit limit per order (%) according to your prop firm.  lowerRangePercentage - Lowest range for lot size (%) according to your prop firm. upperRangePercentage - Upper range for lot size (%) according to your prop firm. ---
Dollar Mint Indicator
David Mwaniki Mbugua
Dollar mint indicator is a special workmanship with years of experience in forex.   Dollar mint ea is a fully non repaint indicator optimised with price action data such that once it gives you a signal t . The indicator   can be used to trade anything on the mt4 with much ease. Benefits ; Fully non repaint Use in any timeframe Use in all the available tradable assets on mt4 Best to use on h4. It generates fully analysed buy and sell signals based on trend and also filters out retracements and
Chart Local Time
Rider Capital Group
4.86 (14)
Display your Local Time on your charts Display your local time   instead of (or along with) MT4 server time. Display crosshair   which highlights current candle time. Automatically adjusts based on chart zoom (zooming in or out). Displays on every timeframe (M1 – Month), and auto-adjusts as chart timeframe is changed. Handles special ½ hour time zones , such as India.  Renders   fast   (no lag) as you scroll charts. Customize the font family, font size, background color, and crosshair col
CCI Dashboard for MT4
Taras Slobodyanik
5 (3)
Multicurrency and multitimeframe modification of the Commodity Channel Index (CCI) indicator. You can specify any desired currencies and timeframes in the parameters. Also, the panel can send notifications when crossing overbought and oversold levels. By clicking on a cell with a period, this symbol and period will be opened. This is MTF Scanner. The key to hide the dashboard from the chart is "D" by default. Parameters CCI Period — averaging period. CCI Applied price — price type. Clear the
The Winner of Balance indicator is based on the author's method of detecting market sentiment. designed to understand what the mood is in the market, who wins-bears or bulls. Input parameters: 1. Settings for setting levels: 1.1. ATR Period - the period of the standard ATR indicator 1.2. K Lower Order, ATR-coefficient for setting the lower threshold in ATR (hotpink color) 1.3. KUpper Border, ATR - coefficient for setting the upper threshold in ATR (the Aqua color) 2. Settings for calculatio
Extremes Day
Aleksey Maltsev
v. 1.0 This indicator can show with maximum accuracy up to 1 bar the presence of a Maximum/minimum on the chart, regardless of the timeframe. It has a flexible configuration. You can use either one value on all TF, or you can use your own value on each TF individually. This indicator is already being improved and those who purchase it receive all updates for free. Next, it is planned to display an indication of the strength of the pivot point at each extremum (in % or in color drawing). It wi
Indicator MTF Qristalium Arrows is a semi - automatic trading system. It works on all currency pairs.  The indicator uses three rules: 1) we trade only on the trend, 2)"buy when everyone sells and sell when everyone buys", 3) the Price always goes against the crowd.  Indicator MTF Arrows Qristalium filter rules across multiple time frames using the built-in indicators. If the trend matches on the selected time intervals, the indicator will give an arrow to enter the market. Then you make yo
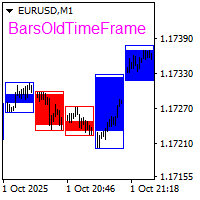
The BarsOldTimeFrame indicator is designed to analyze bar formation on a higher timeframe, projecting bars from it onto the current timeframe. The indicator draws higher timeframe bars on the current chart as rectangles with filled candlestick bodies and transparent shadows. The higher timeframe and fill colors for bullish and bearish bar bodies are selected in the settings.
Buyers of this product also purchase
Trend SniperX MT4
Sarvarbek Abduvoxobov
5 (5)
Trend Sniper X is a multi-timeframe trend-following indicator for MetaTrader 5 that helps traders identify trend direction and potential reversal points with clarity and precision. For MT5: https://www.mql5.com/en/market/product/181101 Price Information: The current price is promotional and is subject to change as upcoming updates and new features are released. Code2Profit Channel Master the Market with Multi-Timeframe Analysis! How to Maximize Your Win Rate with Trend Sniper X: Key Rules & Sess
Currency Strength Wizard is a very powerful indicator that provides you with all-in-one solution for successful trading. The indicator calculates the power of this or that forex pair using the data of all currencies on multiple time frames. This data is represented in a form of easy to use currency index and currency power lines which you can use to see the power of this or that currency. All you need is attach the indicator to the chart you want to trade and the indicator will show you real str
SR Liquidity
Oleg Rodin
5 (2)
SR Liquidity is a trading indicator designed to reveal the hidden zones where market liquidity concentrates and price reacts most strongly. These special liquidity areas act as powerful support and resistance levels, giving you a clear map of where the market is most likely to reverse. Instead of drawing ordinary Support/Resistance lines, SR Liquidity analyzes real price behavior to detect the zones where buying and selling pressure accumulate. These are actually the pools of liquidity that driv
Scalper Vault
Oleg Rodin
5 (40)
Scalper Vault is a powerful, fully-equipped trading system designed for traders who want to achieve consistency in intraday trading . This high-precision indicator serves as a complete, standalone trading system that delivers institutional-grade analysis for both Forex and Binary Options traders. PLEASE CONTACT ME AFTER PURCHASE TO GET MY TRADING TIPS PLUS A GREAT BONUS! By eliminating the guesswork and complex manual analysis, Scalper Vault allows you to focus purely on execution using easy t
PRO Renko System
Oleg Rodin
5 (31)
PRO Renko System is a highly accurate trading system specially designed for trading RENKO charts. The ARROWS and Trend Indicators DO NOT REPAINT! The system effectively neutralizes so called market noise giving you access to accurate reversal signals. The indicator is very easy to use and has only one parameter responsible for signal generation. You can easily adapt the tool to any trading instrument of your choice and the size of the renko bar. I am always ready to provide extra support to help
Trading Special – 30% OFF Best Solution for any Newbie or Expert Trader! This dashboard software is working on 28 currency pairs plus one. It is based on 2 of our main indicators (Advanced Currency Strength 28 and Advanced Currency Impulse). It gives a great overview of the entire Forex market plus Gold or 1 indices. It shows Advanced Currency Strength values, currency speed of movement and signals for 28 Forex pairs in all (9) timeframes. Imagine how your trading will improve when you can watch
PZ Turning Points MT4
PZ TRADING SLU
1 (1)
Identify key turning points with reliable fractal analysis This indicator examines the price structure of fractals of different periods to determine possible reversal points in the market, providing timing to positional traders that already have a fundamental or technical valuation model. Unlike its younger brother, Reversal Fractals , this indicator won't miss reversals because of the period selected, and will find reversal fractals on a zig-zag fashion, ignoring those reversals which do not
Smart Trend Trading System is a chart indicator for MetaTrader 4 that brings trend information, entry and exit signals, and price levels into one workspace. It combines 10+ trading tools into one system, including trend detection, reversal zones, smart cloud, trailing stop logic, support and resistance, candle coloring, alerts, and multi-timeframe analysis. The system is designed to help you trade different market conditions: Trending markets: Identify the main trend, detect pullbacks, follow mo
Quant Direction
Georgios Kalomoiropoulos
Quant Direction is a 3 dimensional market analysis tool. It provides a purely objective, algorithmic view of the market by calculating exact percentage-based biases across multiple dimensions simultaneously. Developed utilizing advanced AI modeling tools and subjected to thorough testing, this algorithm is engineered to read the market with unique precision. It can analyze any currency pair or financial instrument available on your platform.  Quant Direction is the ideal tool whether you are a S
Trend Lines PRO
Roman Podpora
5 (2)
TREND LINES PRO    helps understand where the market is truly changing direction. The indicator shows real trend reversals and points where major players re-enter. You see   BOS lines   Trend changes and key levels on higher timeframes — without complex settings or unnecessary noise. Signals don't repaint and remain on the chart after the bar closes. VERSION MT 5     -     Reveals its maximum potential when paired with the   RFI LEVELS PRO  indicator What the indicator shows: Real shifts   tren
AW Prime Oscillator
AW Trading Software Limited
5 (1)
A combination of two oscillators. The first one displays the entry points, the second shows the current trend . The indicator can display oscillator signals by arrows in two modes, all fast oscillator signals or signals only in the direction of the current trend. It has a multi-timeframe panel and three types of signal notifications. Benefits: Suitable for day and scalping trading Trend filtering Simple and sensitive setup Multi-timeframe panel Suitable for integration into an advisor. Works on
M1 Sniper
Oleg Rodin
4.97 (30)
M1 SNIPER  is an easy to use trading indicator system. It is an arrow indicator which is designed for M1 time frame. The indicator can be used as a standalone system for scalping on M1 time frame and it can be used as a part of your existing trading system. Though this trading system was designed specifically for short-term trading, it still can be helpful for all traders. This trading system can be used with any forex pair and time frame, though lower time frames are recommended from M1 up to M
SIO Oscillator: Self-Optimizing Semivariance Imbalance Oscillator Buy the indicator and get the Expert Advisor based on it for FREE. Most oscillators treat all price movement the same. SIO separates upside and downside market pressure and measures the imbalance between them, showing which side is really in control: buyers or sellers. When the imbalance reaches an extreme, SIO prints a clear signal with entry, Stop Loss and Take Profit levels. What makes SIO different is that it doesn’t rely on f
Hidden Cycles
Lev Vladimirovic Marushkin
5 (1)
The Only 100% Universal Tool! Stop trading against nature! This is your chance to secure the only indicator rooted in the absolute laws that govern the entire universe. Most tools guess—this one reveals the truth. Buy another toy or buy the truth. Your choice... Based on Universal Laws — NOT Some Guy’s Algorithm: Let the market adjust to the Hidden Cycles Geometry — not the other way around. Most indicators are based on a man-made formula. They often lag, fail over time, or need constant re-o
Atomic Analyst
Issam Kassas
5 (14)
Atomic Analyst — MetaTrader 4 For product questions, setup guidance, or technical support, message me directly here on MQL5. The indicator turns complex market calculations into simple visual signals, color-coded candles, trend readings, stop-loss levels, and multiple take-profit zones that traders can understand quickly and use in real market conditions. Main Trading Uses: Scalping and intraday trading: Designed for fast decision-making, clear arrows, alerts, candle colors, and structured entry
Neo Wave PRO
Nikolay Raykov
5 (1)
Price & Time Market Structure Indicator A professional market structure tool that analyzes waves through both price and time — not price alone. Main Description NeoWave PRO is a professional market structure indicator for MetaTrader 4 designed for traders who want to move beyond traditional one-dimensional wave tools such as ZigZag, swing indicators, and basic high/low systems. Most wave indicators analyze only one thing: Price. But a real market wave is not only a price movement. A true wave de
Gann Time Clusters
Martin Eshleman
2.5 (2)
Gann Time Clusters Indicator This indicator is based on W. D. Gann's Square of 9 method for the time axis. It uses past market reversal points and applies the mathematical formula for Gann's Square of 9 and then makes projections into the future. A date/time where future projections line up is called a 'time cluster'. These time clusters are drawn as vertical lines on the right side of the chart where the market has not advanced to yet. A time cluster will result in a market reversal point (ex.
Forex Breath System is a trend based trading system which can be used with any market. You can use this system with currencies, metals, commodities, indices, crypto and even stocks. It can also be used with any time frame. The system is universal. It shows trend and provides arrow signals with the trend. The indicator can also provide you with a special type of alerts when the signals appear in the direction of the trend which makes trend trading an easy task. The indicator is very easy to use a
Trading Special – 40% OFF Best Solution for any Newbie or Expert Trader! This indicator is a unique, high quality and affordable trading tool because we have incorporated a number of proprietary features and a secret formula. With only ONE chart it gives Alerts for all 28 currency pairs. Imagine how your trading will improve because you are able to pinpoint the exact trigger point of a new trend or scalping opportunity! Built on new underlying algorithms it makes it even easier to identify and c
Market Reversal Alerts
Lee Samson
4.19 (114)
Profit from market structure changes as price reverses and pulls back. The Market Reversal Alerts indicator identifies when a trend or extended price move is approaching exhaustion, alerts you the moment market structure shifts, and confirms the entry when price re-tests the reversal zone, so you trade defined areas instead of guesses. How it works As price forms new highs or lows near potential exhaustion points, the indicator identifies the breakout and momentum, then draws a rectangle on the
Super Signal – Skyblade Edition Professional No-Repaint / No-Lag Trend Signal System with Exceptional Win Rate | For MT4 / MT5 It works best on lower timeframes, such as 1-minute, 5-minute, and 15-minute charts. Core Features: Super Signal – Skyblade Edition is a smart signal system designed specifically for trend trading. It applies a multi-layered confirmation mechanism to detect only strong, directional moves supported by real momentum. This system does not attempt to predict tops or bottoms
Tokyo mt4 Indicator
Vasiliy Strukov
5 (9)
Tokyo Indicator provides a clear visual overview of trend direction, potential trading signals, and market conditions. Its colour-coded, stepped trend line distinguishes bullish phases in blue from bearish phases in magenta. Matching directional arrows highlight potential buying and selling opportunities when the displayed trend changes. An integrated dashboard brings together the current signal, market bias, momentum, volatility, and signal quality in one convenient view. This allows traders t
Neuro Poseidon MT4
Daria Rezueva
4.74 (46)
Neuro Poseidon is a new indicator by Daria Rezueva. It combines precise trading signals with adaptive TP/SL levels - creating best possible trades as a result! Message me and get  Neuro Poseidon Assistant  as a gift to automize your trading process! What makes it stand out? 1. Proven profitability on all assets and timeframes 2. Only confirmed BUY and SELL signals present on the chart 3. Adaptive TP & SL levels generated by the software for each trade 4. Easy to understand - suitable for all
Gann Made Easy
Oleg Rodin
4.84 (174)
Gann Made Easy is a professional and easy to use Forex trading system which is based on the best principles of trading using the theory of W.D. Gann. The indicator provides accurate BUY and SELL signals including Stop Loss and Take Profit levels. You can trade even on the go using PUSH notifications. PLEASE CONTACT ME AFTER PURCHASE TO GET TRADING  INSTRUCTIONS   AND GREAT EXTRA INDICATORS  FOR FREE! Probably you already heard about the Gann trading methods before. Usually the Gann theory is a
Liquidity Scalper System: a liquidity-based trading system in indicator form. Most indicators only show an arrow, and the trader then has to decide where the stop goes, where the target is and whether the signal can be trusted at all. Liquidity Scalper System covers the full trade cycle: it finds liquidity pools, gives a signal when they are broken, immediately calculates Entry, Stop Loss and three targets, and shows statistics and out-of-sample test results on the panel. The system picks its o
Gold Channel is a volatility-based indicator, developed with a specific timing algorithm for the XAUUSD pair, which consists of finding possible corrections in the market. This indicator shows two outer lines, an inner line (retracement line) and an arrow sign, where the theory of the channel is to help identify overbought and oversold conditions in the market. The market price will generally fall between the boundaries of the channel. If prices touch or move outside the channel it is a tradi
This indicator shows the relative strength of 8 major currencies: USD, EUR, GBP, AUD, NZD, CAD, CHF and JPY. The strength value is normalized to the range 0-100: The value above 60 means strong. The value below 40 means weak.  The basic principle Given eight currencies, USD,EUR,GBP,AUD,NZD,CAD,CHF,JPY, where each pair of two can be combined, resulting in a total of 28 pairs, a reverse algorithm is used to extract the strength of the eight currencies from these 28 pairs EURUSD,GBPUSD,AUDUSD,NZDU
Italo Volume Indicator
Italo Santana Gomes
4.92 (79)
BUY INDICATOR AND GET EA FOR FREE AS A BONUS + SOME OTHER GIFTS! ITALO VOLUME INDICATOR  is the best volume indicator ever created, and why is that? The Indicator works on all time-frames and assets, indicator built after 7 years of experience on forex and many other markets. You know many volume indicators around the internet are not complete, does not help, and it's difficult to trade, but the Italo Volume Indicator is different , the Italo Volume Indicator shows the wave volume, when market
Non repaint MT4
Yan Zhen Du
5 (1)
This is a professional chart indicator designed for traders focused on stability and clear price action. It helps filter market noise and provides clear visual entry and exit zones for your trading decisions. Core Features: Strictly Non-Repainting: The system is built with strict non-repaint logic. What you see on the chart is the true historical performance. Confirmed Signals: Signals are triggered and confirmed only after the candle closes . Once a trading arrow appears on a closed candle, it
TDI Multi Timeframe Scanner: This Dashboard indicator uses the TDI (Trader's Dynamic Index) Indicator to find best trades. Read detailed How to Use Guide: https://www.mql5.com/en/blogs/post/758252 Extra indicators also available in above post. Checks for: - SharkFin Pattern Free indicator for SharkFin: https://www.mql5.com/en/market/product/42405/ - TDI Trend: Strong/Weak Trend Up/Down - TDI Signal: Strong/Medium/Weak Signal for Buy/Sell - Consolidation - Overbought/Oversold - Volatility Ban
More from author
Elliott Wave Auto Count for MetaTrader 4 labels Elliott waves automatically on four degrees at the same time: the base degree and the three degrees above it. It follows the rules and guidelines of "Elliott Wave Principle" (Frost & Prechter), and for the current wave it shows a price x time target zone and an invalidation level. It is meant for MT4 traders who use Elliott wave analysis and want a rule-based starting count, with the alternate count and the invalidation level always visible. It is
Fibo Price Time Zones combines Fibonacci price levels with Fibonacci time targets and draws them on the chart as boxes (price x time zones). Where boxes from several waves and from up to two higher timeframes overlap, the area is emphasized in three levels. It is meant for traders who already use Fibonacci retracements and extensions and also want to see roughly when a level is worth watching, without drawing every tool by hand. It is a display tool only: it gives no buy or sell signals and doe
Supply & Demand Zones marks supply and demand zones on a MetaTrader 5 chart with one fixed, fully published rule: a strong bar (body at least X times ATR) that leaves a short "base" of small-body bars behind it. The base becomes a demand zone when the strong bar is bullish and closes above it, or a supply zone when the strong bar is bearish and closes below it. Each zone shows its state: fresh, touched with a count, or broken. It is meant for traders who draw these zones by hand and want them d
FREE
RSI AutoScale is a clean, lightweight RSI for traders who use both TradingView and MetaTrader 5 and want the two charts to look the same. WHAT IT SHOWS - RSI (Wilder smoothing): the same values as the standard RSI, with any applied price. - Signal line on the RSI: SMA, EMA, SMMA or LWMA, with its own period. - Levels: upper, middle and lower lines (70 / 50 / 30 by default). They use MT5's native levels, so they reach the right edge and their values appear on the scale. - Zone fills: the middle
FREE
Stoch RSI Band Fill is a Stochastic RSI indicator for MetaTrader 5. MT5 does not include a built-in Stoch RSI, so this indicator adds one. It follows the same calculation steps as the built-in Stoch RSI on TradingView and uses the same layout: K and D lines, 80 / 50 / 20 levels and a shaded band between the upper and lower levels. CALCULATION, STEP BY STEP 1. RSI of the selected price (default: close, length 14), smoothed with Wilder's method (RMA). The first average is the simple average of the
FREE
Pivot Points Six Types with Level Alerts is a TV-compatible pivot point indicator for MetaTrader 5. It uses the same formulas and the same period boundaries as the "Pivot Points Standard" indicator that comes with TradingView, and it draws the levels the same way: short horizontal lines that start at the first bar of each period, with "R1 (price)" style labels in orange (#FB8C00). SIX CALCULATION TYPES The levels are calculated from the high, low and close of the previous period. - Traditional
FREE
Supertrend Trend Fill with Change Alerts is a TV-compatible Supertrend for MetaTrader 5. It uses the same calculation as the "Supertrend" indicator built into TradingView and draws it the same way: a green line below price in an up trend, a red line above price in a down trend, and a light fill between the line and the middle of each candle body. Supertrend shows the direction of the trend. It is a charting aid, not a buy or sell signal, and it does not predict where price will go. HOW IT IS C
FREE
MACD Four Color Histogram is a MACD for MetaTrader 5 that uses the same formula and the same look as the built-in MACD on TradingView. It is made for traders who use both platforms and want the MACD on each chart to read the same way. HOW IT DIFFERS FROM THE MT5 STANDARD MACD - MT5 standard MACD: the histogram is the MACD line itself, and the signal line is an SMA. - This indicator: three parts, as on TradingView. MACD line, signal line, and histogram = MACD - signal. The histogram has 4 colors.
FREE
VWAP Band Fills with Anchored VWAP is a TV-compatible VWAP for MetaTrader 5. It uses the same formula as the built-in "VWAP" indicator of TradingView (Pine ta.vwap), offers the same inputs - anchor period, source, offset, standard deviation or percentage bands #1 to #3 - and draws it the same way: a blue VWAP line, green / olive / teal bands and light fills between them. An optional anchored VWAP starts from a vertical line that you drag to any bar. HOW IT IS CALCULATED For every bar of the cu
FREE
Prior Day Week Month Levels with Touch Alerts draws the previous day, week and month high and low on your MetaTrader 5 chart as clean horizontal lines with labels at the right edge, in the style of TradingView. It can also show the previous day's close and today's open. LEVELS - PDH / PDL: previous day high and low (blue #2962FF, solid) - PWH / PWL: previous week high and low (orange #FF9800, dashed) - PMH / PML: previous month high and low (purple #9C27B0, dash-dot) - PDC: previous day close (
FREE
Candle Countdown Tag with Spread shows how long the current candle has left, in a small colored tag right next to the last candle - the way TradingView shows its bar countdown. The same tag can also show the current spread, the time left of up to two more timeframes and the open time of the next candle. It is a display tool for MetaTrader 5: no alerts, no signals, no trading. WHAT IT SHOWS - Time left of the chart timeframe: mm:ss under one hour, hh:mm:ss under one day, "2d 04:15:30" for longe
FREE
Do you mark supply and demand zones by hand and get a slightly different result every time? This free MetaTrader 4 indicator draws them with one fixed rule that is written out in full below, so you can check every zone yourself. The idea: a strong candle (body at least X times ATR) leaves a "base" of 1 to 10 small candles right before it. A bullish strong candle that closes above the base turns it into a demand zone; a bearish one that closes below it turns it into a supply zone. The indicator
FREE
This is the MetaTrader 4 edition of RSI AutoScale. It draws the standard Wilder RSI with a signal line, a shaded band between the levels, colored areas where the RSI leaves that band, and a choice of three scales. It is meant for traders who use TradingView and MetaTrader 4 side by side and want the RSI pane to look much the same on both. HOW IT LOOKS ON MT4 - RSI line: the same values as MT4's built-in RSI for the same period and applied price. - Signal line: a moving average of the RSI (SMA, E
FREE
Supertrend Trend Fill with Change Alerts MT4 brings a TV-compatible Supertrend to MetaTrader 4. If you also use TradingView, you know its built-in "Supertrend": a green line under price while the trend is up, a red line over price while it is down, and a soft colored band between the line and the candles. This MT4 indicator reproduces that calculation and that look. What it is for: seeing the current trend direction and where it would flip. What it is not: a buy or sell signal or a forecast. A
FREE
A MetaTrader 4 MACD built to read like the MACD you see on TradingView: a MACD line, a signal line, and a histogram of the gap between them, colored in four shades. If you switch between the two platforms during the day, the MACD pane on your MT4 chart will look and behave the way you are used to. WHY NOT THE MT4 BUILT-IN MACD? MT4's own MACD draws the MACD line as gray bars and smooths the signal line with an SMA. There is no separate histogram and no color change. This indicator calculates the
FREE
MetaTrader 4 ships with a Stochastic and an RSI, but not with a Stochastic RSI. This indicator fills that gap for MT4 users and is built to be TV-compatible: it follows the calculation of the Stoch RSI that comes with TradingView, and the pane looks the way TradingView users expect - a blue K line, an orange D line, dashed 80 and 20 levels, a dotted 50 line and a light band between 80 and 20. WHAT APPEARS IN THE SUBWINDOW - K and D lines. The Data Window lists only K and D. - Upper band (80) a
FREE
Pivot Points Six Types with Level Alerts MT4 brings TV-compatible pivot points to MetaTrader 4. If you also chart on TradingView, you know its built-in "Pivot Points Standard". This MT4 indicator reproduces it: the same six calculation methods, the same period choices from one day to ten years, and the same look - an orange (#FB8C00) line for each level, starting at the beginning of each period, labelled like "S2 (1.08345)". WHICH LEVELS EACH METHOD GIVES Method | Levels drawn | Note Tradition
FREE
Prior Day Week Month Levels with Touch Alerts MT4 puts yesterday's, last week's and last month's high and low on your MetaTrader 4 chart, drawn the way TradingView users are used to seeing them: thin horizontal lines with a short label and price at the right edge. Optional extras: previous day close and today's open, and an alert when price touches a line. WHAT YOU SEE Line | Meaning | Default look PDH | previous day high | blue #2962FF, solid PDL | previous day low | blue #2962FF, solid PWH |
FREE
VWAP Band Fills with Anchored VWAP MT4 brings the VWAP of TradingView to MetaTrader 4. If you use TradingView's built-in "VWAP", you will find the same inputs here (Anchor Period, Source, Offset, Bands Calculation Mode, Bands Multiplier #1 to #3, Hide VWAP on 1D or Above), the same formula (Pine ta.vwap) and the same colors - plus an anchored VWAP that starts wherever you drag a vertical line. THE FORMULA Within each anchor period, bar by bar: VWAP = sum(source x tick volume) / sum(tick volume
FREE
Candle Countdown Tag with Spread MT4 puts a TradingView-style countdown on your MT4 chart: a small tag beside the last candle that tells you when the bar closes, together with the current spread. Optional extra lines show the time left of two more timeframes and when the next candle opens. Nothing else - it does not trade, alert or give signals. ONE TAG, UP TO FIVE LINES Line | Example | Setting Chart timeframe | 12:41 | on by default Extra timeframe 1 | H4 02:12:41 | off (choose a timeframe t
FREE
Dow Structure MTF shows the Dow theory trend of five timeframes at once in MetaTrader 4, using the pullback low / rally high method that is common among Japanese traders. For each timeframe it shows whether the trend is up, down or range, which price would change it, and how far the current price is from that price. Only closed bars are used, so a confirmed result does not change afterwards (no repaint). It is meant for traders who check the trend structure of several timeframes by hand and wan
Fibo Price Time Zones for MetaTrader 4 combines Fibonacci price levels with Fibonacci time targets and draws them on the chart as boxes (price x time zones). Where boxes from several waves and from up to two higher timeframes overlap, the area is emphasized in three levels. It is meant for MT4 traders who already use Fibonacci retracements and extensions and also want to see roughly when a level is worth watching. It is a display tool only: it gives no buy or sell signals and does not place ord
Time Average Lines draws four averages measured by time, not by the number of bars, so each line keeps the same length of time when you switch timeframes: a time moving average, a TWAP, a same-time-of-day average and a time-based EMA. For the same-time average, the rest of today is shown as a dotted path that joins the past averages; the path is a summary of the past, not a forecast. It is meant for intraday traders who want averages that mean the same thing on M1 and on M15, and who want to co
Auto Trendline Channel MTF draws trendlines, parallel channels and horizontal support / resistance automatically from confirmed swing highs and lows in MetaTrader 4, and records for each line the touch count, close breaks, wick breaks and retests. A table shows, for the chart timeframe and two higher timeframes, the nearest line above and below the price, the distance to it and the Dow theory direction. It is meant for traders who draw trendlines and levels by hand and want them drawn by fixed,
Currency Strength Meter for MetaTrader 4 combines the 28 pairs of the 8 major currencies (USD, EUR, JPY, GBP, AUD, NZD, CAD, CHF) into one strength line per currency, with a ranking table for the chart timeframe, M15, H1, H4 and D1. The full formula is published below. It is meant for MT4 traders who compare currencies before choosing which pair to look at, and who want to know exactly how the numbers are made. It is an analysis aid: it does not tell you when to buy or sell and does not show fu
Trade History Stats Panel for MetaTrader 4 reads the closed trades in your own account history and sums them up in a panel on the chart: number of trades, win rate, profit factor, average P/L per trade, drawdown of the closed-trade curve, holding time, buy / sell, and tables by month, symbol, weekday and hour. It is meant for traders who want to look back at their own past trades, like a trading journal that fills itself in, and to check the numbers by period, symbol or magic number. It never p
Prop Challenge Loss Tracker for MetaTrader 4 shows, in a panel on the chart, how much room is left before the daily loss limit and the maximum loss limit of a funded-account (prop) challenge are reached, and sends staged alerts as the limits are used up. It is meant for traders taking a prop challenge who want to see their remaining loss room at a glance, set to the rules of their own program. It is a display and alert tool only: it never opens, modifies or closes any order. Whether a limit is
Market Structure Liquidity Map for MetaTrader 4 draws smart money concepts (SMC) style market structure on the chart: swing labels, break of structure (BOS), change of character (CHoCH), equal highs and lows, previous day and week levels, liquidity sweeps and unfilled fair value gaps (FVG), with a small table for the chart timeframe and two higher timeframes. It is meant for MT4 traders who read structure and liquidity by hand and want the same levels drawn the same way every time. It is a disp
Divergence Detector for MetaTrader 4 finds regular and hidden divergences between price swings and one oscillator of your choice (RSI, MACD histogram, Stochastic %K, OBV, CCI or Momentum) and draws them on the price chart and in the indicator window, with a small table for four other timeframes. It is meant for MT4 traders who look for divergences by eye and want them found by fixed, visible rules on closed bars. It is a display tool only: it gives no buy or sell signals and does not place orde
Multi Symbol Market Scanner Panel shows up to 30 symbols in one table on your MT4 chart: trend direction, RSI and ATR% on M15, H1, H4 and D1, plus today's range, distance from yesterday's high or low and a simple H1 / H4 swing structure. Click a symbol name to switch the chart to it. It is meant for MT4 traders who watch many forex pairs, metals or indices and want one overview instead of opening many charts. It is a display tool only: it gives no buy or sell signals, does not rank symbols to t
Filter:
No reviews
Reply to review