Candle Countdown Tag with Spread MT4

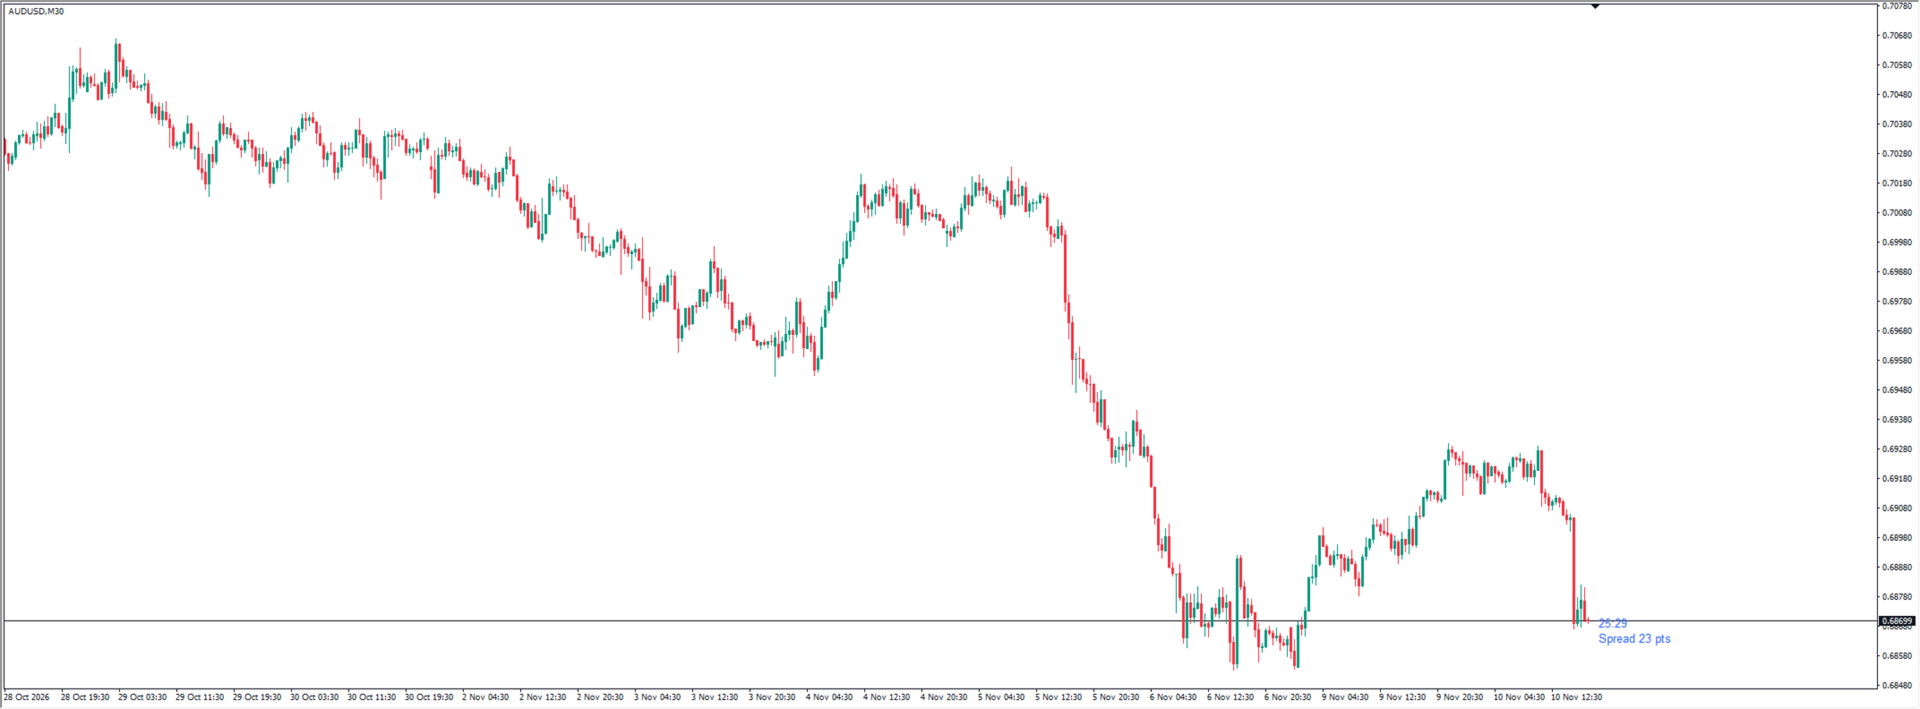
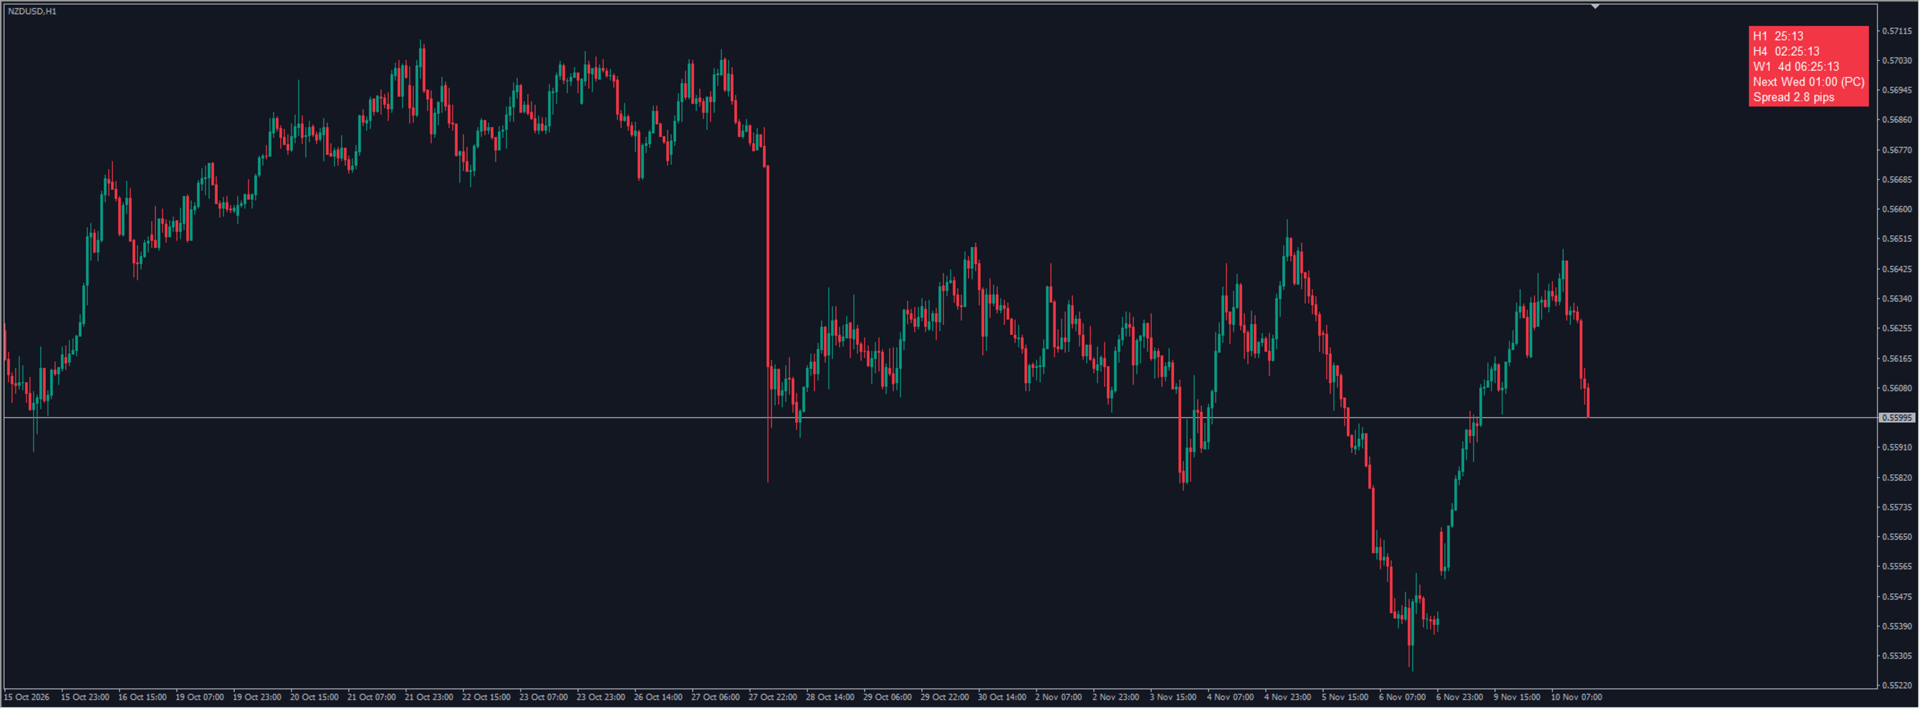
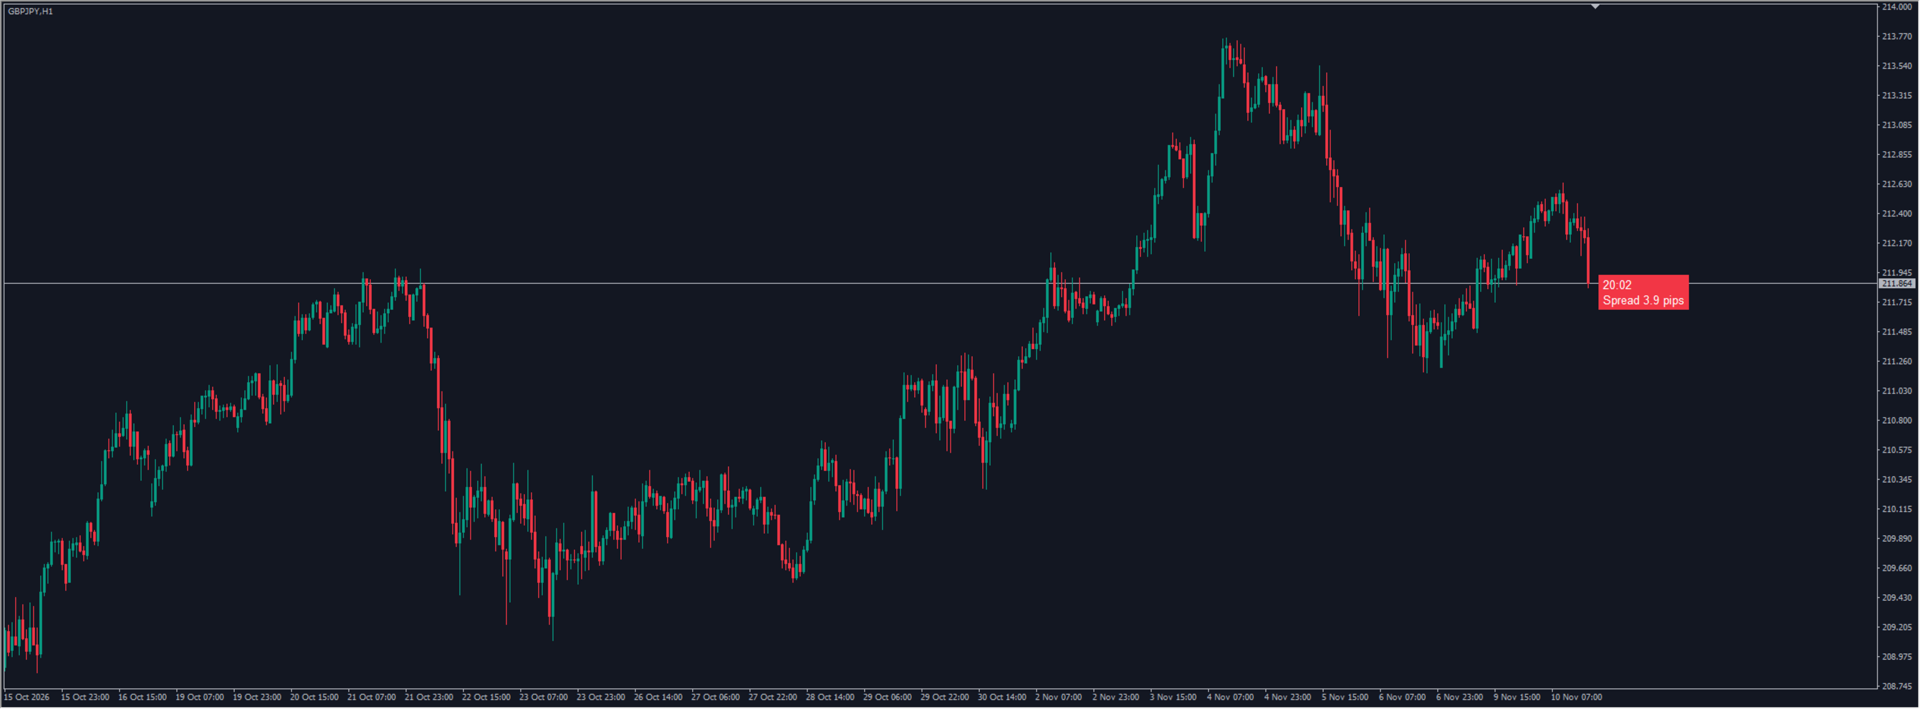
Candle Countdown Tag with Spread MT4 puts a TradingView-style countdown on your MT4 chart: a small tag beside the last candle that tells you when the bar closes, together with the current spread. Optional extra lines show the time left of two more timeframes and when the next candle opens. Nothing else - it does not trade, alert or give signals.

ONE TAG, UP TO FIVE LINES
Line | Example | Setting
Chart timeframe | 12:41 | on by default
Extra timeframe 1 | H4 02:12:41 | off (choose a timeframe to turn it on)
Extra timeframe 2 | D1 13:12:41 | off
Next candle open | Next Tue 08:00 | off; server time or PC time
Spread | Spread 1.2 pips | on; pips, points or price
Time format: mm:ss below one hour, hh:mm:ss below one day, "Nd hh:mm:ss" above.
When the trading session of the symbol is closed, the tag turns gray and reads "Market closed" plus "Opens in ..." until the next session.

PLACEMENT AND COLORS
- Beside the last candle (default, gap 12 px) or as a panel in one of the four corners.
- Tag color follows the current candle (bull #089981, bear #F23645) or uses one fixed color; a separate color for "market closed".
- Filled box with white text, or text only. Font and size 6-30.
- Language: Auto (terminal language), English or Japanese. With Japanese text and the Arial font, the tag switches to Meiryo UI so the characters display correctly.

MT4 NOTES - PLEASE READ
1. The screen moves with ticks. MT4 redraws the chart when a tick arrives or when you scroll or zoom. The values are recalculated every second, but if no tick comes in (quiet market, weekend), the numbers on the screen can look frozen until the next redraw. The buffers of the attached indicator are still updated every second.
2. Server time. MT4 has no server clock function, so the indicator measures the difference between your PC clock and the server time on every new tick and adds it to the PC clock. The last measured difference is remembered, so a chart opened at the weekend still shows server time. Keep your PC clock synchronized.
3. Colors come from the inputs. The tag is made of chart objects, so all colors are set in the Inputs tab.
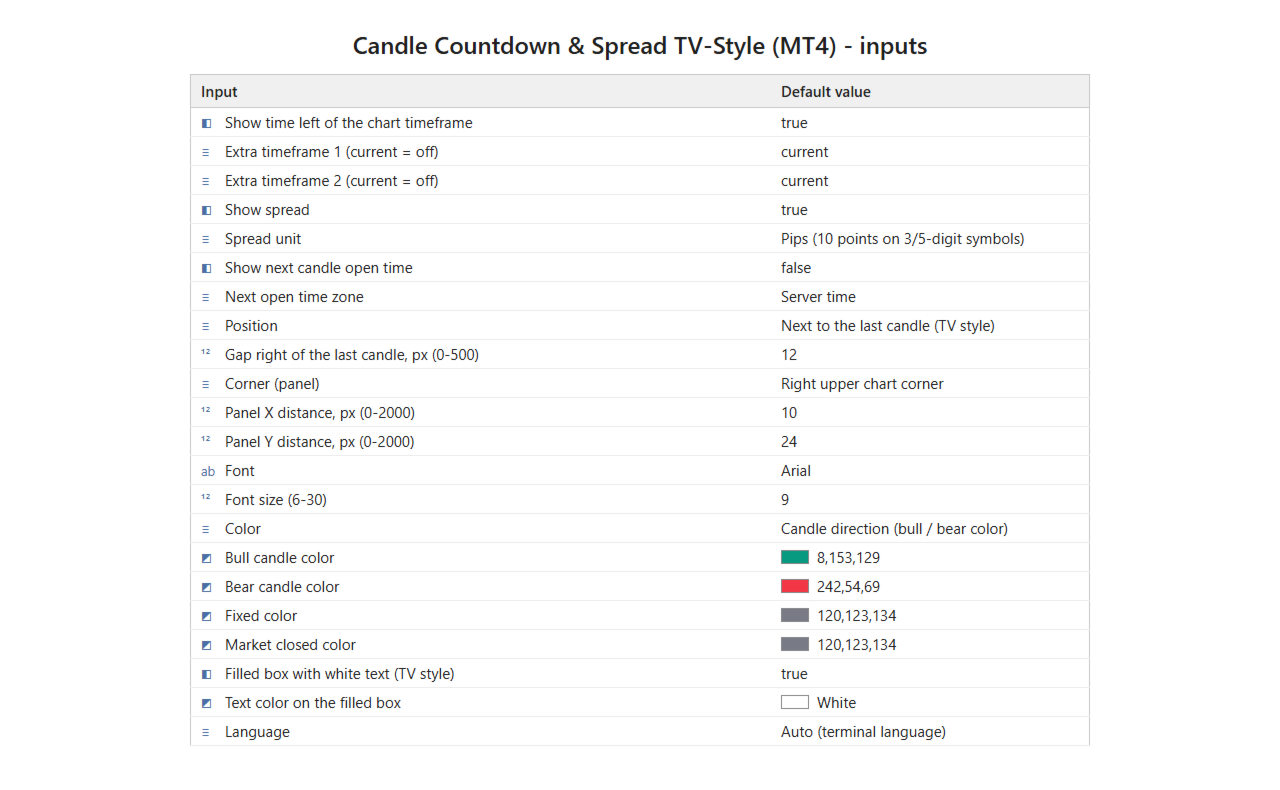
4. Inputs have no group headings in MT4; they are listed in the order shown at the end of this page.

HOW THE END OF A BAR IS FOUND
The indicator takes the real open time of the current bar and adds the bar length (W1 = 7 days, MN1 = to the 1st of next month). Brokers whose H4 bars start at 01:00, 05:00 ... are therefore handled correctly. Open or closed is read from the session table in the symbol specification; holidays or extra closures that are not in that table are not recognized, and the countdown keeps running on those days.

KNOWN LIMITS
- All times are server time (the next-open line can be switched to PC time; the offset is rounded to 15 minutes).
- For a few seconds after attaching, the short name in the indicator list may show "probe#..." while the indicator checks whether it runs on a chart. It returns to normal by itself.
- Called through iCustom from an EA or another indicator, it draws nothing on any chart and starts no timer; it only fills the buffers. Attached to another chart by an EA with ChartIndicatorAdd, it may also draw nothing - attach it by hand or with a template to see the tag.
- Nothing is drawn in the Strategy Tester.
- No DLLs, no files, no internet access.
- This is an information display. It places no trades, and no trading result is promised.

iCUSTOM BUFFERS
5 buffers, not drawn, filled only on the newest bar (EMPTY_VALUE elsewhere):
0 seconds left on the chart timeframe | 1 seconds left on extra timeframe 1 | 2 seconds left on extra timeframe 2 | 3 spread in points | 4 market open = 1, closed = 0.
Buffers 0-2 are EMPTY_VALUE while the market is closed. Same order as the MT5 edition.
Through iCustom the values are recalculated each time your EA calls iCustom (there is no one-second timer in that case).

INPUTS (MT4 ORDER)
Show time left of the chart timeframe = true; Extra timeframe 1 = current (off); Extra timeframe 2 = current (off); Show spread = true; Spread unit = Pips; Show next candle open time = false; Next open time zone = Server time; Position = Next to the last candle; Gap right of the last candle = 12 px (0-500); Corner = right upper; Panel X distance = 10; Panel Y distance = 24; Font = Arial; Font size = 9 (6-30); Color = Candle direction; Bull / Bear / Fixed / Market closed color; Filled box with white text = true; Text color on the filled box = white; Language = Auto.
Out-of-range values stop the indicator from loading, with the reason in the Experts log.

SUPPORT
Help with installation, settings and bug reports via MQL5 messages. I do not answer questions about market direction or specific trades.

The MT5 edition (a separate product) and other tools by the same author are listed on my seller profile.

TradingView is a trademark of TradingView, Inc. This product is not affiliated with, sponsored by or endorsed by TradingView, Inc.
Recommended products
Basic Supply Demand
Mehran Sepah Mansoor
4.33 (3)
Basic supply demand   indicator is a powerful tool designed to enhance your market analysis and help you identify key areas of opportunity on any chart. With an intuitive and easy-to-use interface, this free Metatrader indicator gives you a clear view of supply and demand zones, allowing you to make more informed and accurate trading decisions /   Free MT5 version Dashboard Scanner for this indicator: ( Basic Supply Demand Dashboard ) Features The indicator   automatically   scans the chart for
FREE
BinaryFortune
Andrey Spiridonov
3.83 (6)
The BinaryFortune indicator has been developed and adapted specifically for trading short-term binary options. The algorithm of the indicator analyzes numerous factors before generating a signal. The indicator is installed in the conventional way. The indicator consists of an information window, which displays the name of the trading instrument, support and resistance levels, and the signal itself ( BUY , SELL or WAIT ). A signal is accompanied by a sound and a pop-up Alert. Advantages of the in
FREE
MultiLayer Signal — многоуровневый аналитический индикатор Индикатор MultiLayer Signal объединяет сразу несколько подходов к анализу рынка: Уровни поддержки и сопротивления (на основе экстремумов за заданный период) Паттерны поглощения (бычьи и медвежьи) Сигналы на основе трендовой динамики Встроенный ZigZag с настраиваемой чувствительностью Многоуровневая EMA-фильтрация (микро-, макро- и быстрые/медленные скользящие) ️ Особенности: Возможность выбора режима: ️ “Закрытая свеча”
FREE
Binary fisher fx
Roman Lomaev
1 (1)
Binary Fisher FX is a powerful binary options indicator that works on any timeframe and with any currency pair. This indicator is designed to identify trend movements and indicates entry points in the form of an arrow before the current candle closes. Key features of the indicator: Works on any timeframe (M1, M5, M15, M30, H1, H4, D1) Supports any currency pairs Expiration from 1 to 3 candles (default 1 candle) Indicates entry points in the form of an arrow before the current candle closes Wo
FREE
Wave Entry Alerts In Gold
Azad Amanuel Gorgis Gorgis
Wave Entry Alerts In Gold is a custom indicator developed by Azad Gorgis for MetaTrader 4. This indicator is designed to provide alerts based on ZigZag patterns, specifically tailored for trading on the Gold (XAU/USD) symbol. Key Features: - Chart Window Indicator: The indicator is designed to be displayed on the main chart window. - Arrow Signals: The indicator generates arrow signals on the chart, indicating potential reversal points based on ZigZag patterns. - Customizable Parameters: Trade
FREE
Maltese cross GBP   Универсальный инструмент для определения трендов, флетов и торговли по графическим паттернам. Объединяет техники Гана, Эллиота, Мюррея. Просто разместите его на графике и он покажет направление и скорость движения цены, выделит разворотные моменты. Maltese cross поможет точно определять узловые моменты в истории, планировать торговые действия и сопровождать открытые сделки.  Эта бесплатная демонстрационная версия MalteseCross ограничена GBPUSD и кроссами GBP. Никаких прочих о
FREE
Sentinelle SR
Heritage Finance LTD
Sentinelle SR — structural alerts for the discretionary trader Sentinelle SR is an   alert   indicator, not a robot. It places no orders: it watches market structure and warns you — mobile push, alert window, on-chart panel and CSV log — as soon as a tradable event forms. The final decision stays yours. Designed and field-tested on   XAUUSD M30 . Runs on M15, M30 and H1. What it watches Locked support and resistance on the current and higher timeframe, with a consistency guard (a level can never
FREE
Pin Bars
Yury Emeliyanov
4.83 (6)
Main purpose: "Pin Bars" is designed to automatically detect pin bars on financial market charts. A pin bar is a candle with a characteristic body and a long tail, which can signal a trend reversal or correction. How it works: The indicator analyzes each candle on the chart, determining the size of the body, tail and nose of the candle. When a pin bar corresponding to predefined parameters is detected, the indicator marks it on the chart with an up or down arrow, depending on the direction of
FREE
Iceberg Divergen Indicator
Komang Putra Riswanjaya
5 (3)
Iceberg Divergence Indicator will help traders to find divergent patterns that occur on the charts very easily and simply This indicator will visualize divergences pattern that occur on the chart by combining it with an awesome oscillator indicator Key Features Easy to use : The Iceberg divergent indicator is made as simple as possible so that it is easy to use Pattern Visualization : Divergent patterns will be visualized on the live chart Precision : The indicator detects divergent patterns wi
FREE
SMC Alpha Oracle PRO is a professional technical analysis tool for the MetaTrader 4 platform, fully automating chart разметка based on the Smart Money Concepts (SMC) methodology. The indicator detects market structure shifts, institutional supply/demand areas, and liquidity pools strictly utilizing mathematical Price Action algorithms. Key Analytical Modules and Logic Market Structure (BOS / CHoCH): Tracks Break of Structure (BOS) and Change of Character (CHoCH) based on customized Swing Hig
FREE
SC MTF Rsi MT4
Krisztian Kenedi
5 (1)
Relative Strength Index (RSI) indicator with multi-timeframe support, customizable visual signals, and configurable alert system. Freelance programming services, updates, and other TrueTL products are available on my MQL5 profile . Feedback and reviews are highly appreciated! What is RSI? Relative Strength Index (RSI) is a momentum oscillator that measures the speed and magnitude of price changes. The indicator oscillates between 0 and 100, comparing the magnitude of recent gains to recent lo
FREE
Ppr PA
Yury Emeliyanov
4.75 (4)
"Ppr PA" is a unique technical indicator created to identify "PPR" patterns on the currency charts of the MT4 trading platform. These patterns can indicate possible reversals or continuation of the trend, providing traders with valuable signals to enter the market. Features: Automatic PPR Detection: The indicator automatically identifies and marks PPR patterns with arrows on the chart. Visual Signals: Green and red arrows indicate the optimal points for buying and selling, respectively. Arrow
FREE
Note: this product is a free limited version of the full featured product Currency Timeframe Strength Matrix . It only includes AUD, CAD, CHF currencies instead of all 8 currencies. It includes only 5S, 1M, 5M time frames instead of all 8 (5S, 1M, 5M, 15M, 30M, 1H, 4H, 1D). What is it? The Currency TimeFrame Strength Matrix is a simple and comprehensive Forex map that gives a snapshot of what is happening in the Forex market at the very present time. It illustrates the strength and momentum ch
FREE
In a departure from the conventional approach, traders can leverage the bearish engulfing candlestick pattern as a buy signal for short-term mean reversion trades. Here's how this alternative strategy unfolds: The bearish engulfing pattern, (typically signaling a reversal of bullish momentum) , is interpreted differently in this context. Instead of viewing it as a precursor to further downward movement, we perceive it as an indication of a potential short-term bounce or mean reversion in prices.
FREE
Artem
Artem Konkov
4.5 (2)
I present an effective tool for determining the reversal on the H4 timeframe. The indicator is installed on the M30 chart. All parameters are already set.                                                                                                          Proper use of the indicator: Unfortunately, the test in the tester will not give a correct idea about the indicator, so the rent for one month is as affordable as possible. You do not need to install the file on a remote server. Install it
FREE
Sm Ichimoku Scanner
Steeve Christian Martol
5 (5)
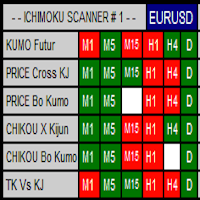
Multi Time Frame Indicator acts as a Scanner based on the Ichimoku Trading System. The outcome is displayed on a board. This helps you to make "at a glance" a mental picture of the System without having to open the chart. Up to 10 Currencies can be watched. Scanned elements And Legend "KUMO Futur" - Green : The Kumo Futur is Bullish. "KUMO Futur" - Red : The Kumo Futur is Bearish. "PRICE Cross KJ" - Green : The Price is Above the Kijun Sen.  "PRICE Cross KJ" - Red : The Price is Below the Kijun
FREE
Candle Countdown — Accurate Time to Close for MT4 Candle Countdown is a simple and precise tool that shows the remaining time until the current candle closes directly on the chart. When your entry depends on the candle close, even a few seconds matter. This indicator helps you see the exact time and make decisions without rushing or guessing. An indicator for precise control over candle closing time. The indicator displays: time remaining until candle close current server time spread Stop Level
FREE
--- FREE VERSION - WORKS ONY ON EURUSD ------------------------------------------------------------------- This is a unique breakout strategy that is used for determination of the next short term trend/move. The full system is available on MQL5 under the name "Forecast System". Here is the link -->  https://www.mql5.com/en/market/product/104166?source=Site Backtest is not possible, because calculations are done based on the data of all timeframes/periods. Therefore I propose you use the technolo
FREE
Binary options tester Trading panel to test your strategies according to the rules of binary options. Scope: Set the percentage of profit from the transaction. Set the expiration time in seconds. Set the bet size Set the Deposit amount. Make several deals in a row. Keep track of the time before expiration. The tick chart with trade levels is duplicated to an additional window for accuracy. It allows you to work both in the testing mode and in the real quotes mode. The program gives an idea of bi
FREE
VELTIS  RegimeScope MT4   RegimeScope is an analysis panel for MetaTrader 4. It shows what kind of market the chart is in, whether the other timeframes agree with it, and how price moved after similar situations in the history of the same symbol and timeframe. The indicator does not open trades and does not give buy or sell signals. It is meant as context for your own trading decisions. A step-by-step user manual with every element of the panel explained is available in the author's MQL5 blog
FREE
Binary Options Assistant (BOA) BURN Signals Indicator provides signals based on Ana Trader Binary Options Strategy. Indicators: MACD & Stochastic Stop missing trades, stop jumping from chart to chart looking for trade set-ups and get all the signals on 1 chart! U se any of the BOA Signals Indicator with the  Binary Options Assistant (BOA) Multi Currency Dashboard .   All BOA Signal Indicator settings are adjustable to give you more strategy combinations. The signals can be seen visually and
FREE
Do you mark supply and demand zones by hand and get a slightly different result every time? This free MetaTrader 4 indicator draws them with one fixed rule that is written out in full below, so you can check every zone yourself. The idea: a strong candle (body at least X times ATR) leaves a "base" of 1 to 10 small candles right before it. A bullish strong candle that closes above the base turns it into a demand zone; a bearish one that closes below it turns it into a supply zone. The indicator
FREE
StrikePin
Mike Pascal Plavonil
1 (1)
The StrikePin indicator is a technical, analytical tool designed to identify trend reversals and find optimal market entries.  The StrikePin indicator is based on the pin bar pattern, which is the Price Action reversal pattern. An entry signal, in a trending market, can offer a very high-probability entry and a good risk to reward scenario. Be careful: the indicator is repainting since it is looking for highest high and lowest lows.  You should avoid to use it in experts but you can use it in
FREE
Extremum Reverse Bar
Yurij Izyumov
2.8 (5)
This indicator has been created for finding the probable reversal points of the symbol price. A small candlestick reversal pattern is used it its operation in conjunction with a filter of extremums. The indicator is not redrawn! If the extremum filter is disabled, the indicator shows all points that have a pattern. If the extremum filter is enabled, the condition works – if the history Previous bars 1 candles back contains higher candles and they are farther than the Previous bars 2 candle, such
FREE
Bar Size MT4
Mikhail Tcvetkov
5 (3)
The technical indicator, in real time, searches for candlesticks that exceed the size set in the settings and gives signals about them. As a rule, such abnormally large candles appear either at the beginning of strong impulses or at the end of a directional price movement. At the beginning of the pulse, the signal can serve as a basis for searching for an entry point, at the end of the movement, it is a sign of a climax and may indicate the near end of the trend. The reference size for filtering
FREE
ZeroOptZigZag
Stanislav Korotky
5 (1)
This is yet another non-parametric ZigZag. Its every upward edge continues until next bar's high is formed below highest low of its bars, and every downward edge continues until next bar's low is formed above lowest high of its bars. In addition to zigzag itself (shown in orange color), the indicator shows signal marks on those bars where zigzag direction changes. The blue arrow up denotes that new bullish edge is started (but not yet completed), whereas the red arrow down denotes that new beari
FREE
Wise Men Indicator demo
Bohdan Kasyanenko
3 (2)
The indicator displays signals according to the strategy of Bill Williams on the chart. Demo version of the indicator has the same features as the paid, except that it can work only on a demo account . Signal "First Wise Man" is formed when there is a divergent bar with angulation.  Bullish divergent bar - with lower minimum and closing price in the upper half. Bearish divergent bar - higher maximum and the closing price at the bottom half. Angulation is formed when all three lines of Alligator
FREE
SMC Traders
Lesedi Oliver Seilane
4 (14)
SMC Traders is a non-repaint indicator that is based on Price Action The indicator uses current market structure to predict future reversals. The indicator can be used with our free Market structure zig zag which can be found here:  https://www.mql5.com/en/market/product/91579 Please note to find the HH AND HL CLINK ON LINK ABOVE Timeframes: 15 minutes for scalping 1 Hour for swing trading Purple Arrow look for sells in conjunction with LL White Arrow look for buys in conjunction with HL
FREE
XMaster Scalping NEW - a simple indicator that determines the beginning and end of a trend. It can be said very well, even ideal for both scalping and medium / long-term trading. When plotted on a chart, it is located in the basement, which gives you the opportunity to draw trend lines / levels on the price and look into the basement at the indicator. How to use: It's simple. Sale yellow, buy green. The colors can be changed in the settings. Additional trading information: Works best on t
FREE
Heiken Ashi Smoothed A two-stage smoothed Heiken Ashi indicator that filters out market noise for clearer trend reading. What it does Heiken Ashi Smoothed applies a two-stage moving average process on top of the classic Heiken Ashi formula. First, the raw price data is smoothed with a moving average; the Heiken Ashi candles are then built from that smoothed price. A second moving average pass smooths the resulting candles again, producing a cleaner, calmer picture of trend direction with fewer f
FREE
Buyers of this product also purchase
Trend SniperX MT4
Sarvarbek Abduvoxobov
5 (5)
Trend Sniper X is a multi-timeframe trend-following indicator for MetaTrader 5 that helps traders identify trend direction and potential reversal points with clarity and precision. For MT5: https://www.mql5.com/en/market/product/181101 Price Information: The current price is promotional and is subject to change as upcoming updates and new features are released. Code2Profit Channel Master the Market with Multi-Timeframe Analysis! How to Maximize Your Win Rate with Trend Sniper X: Key Rules & Sess
Currency Strength Wizard is a very powerful indicator that provides you with all-in-one solution for successful trading. The indicator calculates the power of this or that forex pair using the data of all currencies on multiple time frames. This data is represented in a form of easy to use currency index and currency power lines which you can use to see the power of this or that currency. All you need is attach the indicator to the chart you want to trade and the indicator will show you real str
PRO Renko System
Oleg Rodin
5 (31)
PRO Renko System is a highly accurate trading system specially designed for trading RENKO charts. The ARROWS and Trend Indicators DO NOT REPAINT! The system effectively neutralizes so called market noise giving you access to accurate reversal signals. The indicator is very easy to use and has only one parameter responsible for signal generation. You can easily adapt the tool to any trading instrument of your choice and the size of the renko bar. I am always ready to provide extra support to help
SR Liquidity
Oleg Rodin
5 (2)
SR Liquidity is a trading indicator designed to reveal the hidden zones where market liquidity concentrates and price reacts most strongly. These special liquidity areas act as powerful support and resistance levels, giving you a clear map of where the market is most likely to reverse. Instead of drawing ordinary Support/Resistance lines, SR Liquidity analyzes real price behavior to detect the zones where buying and selling pressure accumulate. These are actually the pools of liquidity that driv
Scalper Vault
Oleg Rodin
5 (40)
Scalper Vault is a powerful, fully-equipped trading system designed for traders who want to achieve consistency in intraday trading . This high-precision indicator serves as a complete, standalone trading system that delivers institutional-grade analysis for both Forex and Binary Options traders. PLEASE CONTACT ME AFTER PURCHASE TO GET MY TRADING TIPS PLUS A GREAT BONUS! By eliminating the guesswork and complex manual analysis, Scalper Vault allows you to focus purely on execution using easy t
Zoryk Gold mt4
Reda El Koutbane
5 (3)
discount ends soon original price 69 $ ZORYK — Advanced XAUUSD Signal System for MetaTrader 4 You know the feeling. You spend time analyzing gold. You wait for the entry. You finally open the trade, and price immediately moves against you. You close too early, move the Stop Loss, or hesitate for a few seconds. Then the market reaches the exact destination you originally expected without you. The direction was not always the problem. The real problem was uncertainty. You did not know exactl
Smart Trend Trading System is a chart indicator for MetaTrader 4 that brings trend information, entry and exit signals, and price levels into one workspace. It combines 10+ trading tools into one system, including trend detection, reversal zones, smart cloud, trailing stop logic, support and resistance, candle coloring, alerts, and multi-timeframe analysis. The system is designed to help you trade different market conditions: Trending markets: Identify the main trend, detect pullbacks, follow mo
Quant Direction
Georgios Kalomoiropoulos
Quant Direction is a 3 dimensional market analysis tool. It provides a purely objective, algorithmic view of the market by calculating exact percentage-based biases across multiple dimensions simultaneously. Developed utilizing advanced AI modeling tools and subjected to thorough testing, this algorithm is engineered to read the market with unique precision. It can analyze any currency pair or financial instrument available on your platform.  Quant Direction is the ideal tool whether you are a S
Trend Lines PRO
Roman Podpora
5 (2)
TREND LINES PRO    helps understand where the market is truly changing direction. The indicator shows real trend reversals and points where major players re-enter. You see   BOS lines   Trend changes and key levels on higher timeframes — without complex settings or unnecessary noise. Signals don't repaint and remain on the chart after the bar closes. VERSION MT 5     -     Reveals its maximum potential when paired with the   RFI LEVELS PRO  indicator What the indicator shows: Real shifts   tren
AW Prime Oscillator
AW Trading Software Limited
5 (1)
A combination of two oscillators. The first one displays the entry points, the second shows the current trend . The indicator can display oscillator signals by arrows in two modes, all fast oscillator signals or signals only in the direction of the current trend. It has a multi-timeframe panel and three types of signal notifications. Benefits: Suitable for day and scalping trading Trend filtering Simple and sensitive setup Multi-timeframe panel Suitable for integration into an advisor. Works on
Atomic Analyst
Issam Kassas
5 (14)
Atomic Analyst — MetaTrader 4 For product questions, setup guidance, or technical support, message me directly here on MQL5. The indicator turns complex market calculations into simple visual signals, color-coded candles, trend readings, stop-loss levels, and multiple take-profit zones that traders can understand quickly and use in real market conditions. Main Trading Uses: Scalping and intraday trading: Designed for fast decision-making, clear arrows, alerts, candle colors, and structured entry
M1 Sniper
Oleg Rodin
4.97 (30)
M1 SNIPER  is an easy to use trading indicator system. It is an arrow indicator which is designed for M1 time frame. The indicator can be used as a standalone system for scalping on M1 time frame and it can be used as a part of your existing trading system. Though this trading system was designed specifically for short-term trading, it still can be helpful for all traders. This trading system can be used with any forex pair and time frame, though lower time frames are recommended from M1 up to M
SIO Oscillator: Self-Optimizing Semivariance Imbalance Oscillator Buy the indicator and get the Expert Advisor based on it for FREE. Most oscillators treat all price movement the same. SIO separates upside and downside market pressure and measures the imbalance between them, showing which side is really in control: buyers or sellers. When the imbalance reaches an extreme, SIO prints a clear signal with entry, Stop Loss and Take Profit levels. What makes SIO different is that it doesn’t rely on f
Hidden Cycles
Lev Vladimirovic Marushkin
5 (1)
The Only 100% Universal Tool! Stop trading against nature! This is your chance to secure the only indicator rooted in the absolute laws that govern the entire universe. Most tools guess—this one reveals the truth. Buy another toy or buy the truth. Your choice... Based on Universal Laws — NOT Some Guy’s Algorithm: Let the market adjust to the Hidden Cycles Geometry — not the other way around. Most indicators are based on a man-made formula. They often lag, fail over time, or need constant re-o
Neo Wave PRO
Nikolay Raykov
5 (1)
Price & Time Market Structure Indicator A professional market structure tool that analyzes waves through both price and time — not price alone. Main Description NeoWave PRO is a professional market structure indicator for MetaTrader 4 designed for traders who want to move beyond traditional one-dimensional wave tools such as ZigZag, swing indicators, and basic high/low systems. Most wave indicators analyze only one thing: Price. But a real market wave is not only a price movement. A true wave de
PZ Turning Points MT4
PZ TRADING SLU
1 (1)
Identify key turning points with reliable fractal analysis This indicator examines the price structure of fractals of different periods to determine possible reversal points in the market, providing timing to positional traders that already have a fundamental or technical valuation model. Unlike its younger brother, Reversal Fractals , this indicator won't miss reversals because of the period selected, and will find reversal fractals on a zig-zag fashion, ignoring those reversals which do not
CRT Multi-Timeframe Market Structure & Liquidity Sweep Indicator Non-Repainting | Multi-Asset | MT5 Version Available MT5 Version:   https://www.mql5.com/en/market/product/162075 Full User Guide — explains what each feature does and why:   https://www.mql5.com/en/blogs/post/767525 Quick Start User Guide  — explains how to configure and in what order:  https://www.mql5.com/en/blogs/post/767540 Indicator Overview CRT Ghost Candle HTF Fractal is a complete institutional-grade market structure too
Gann Time Clusters
Martin Eshleman
2.5 (2)
Gann Time Clusters Indicator This indicator is based on W. D. Gann's Square of 9 method for the time axis. It uses past market reversal points and applies the mathematical formula for Gann's Square of 9 and then makes projections into the future. A date/time where future projections line up is called a 'time cluster'. These time clusters are drawn as vertical lines on the right side of the chart where the market has not advanced to yet. A time cluster will result in a market reversal point (ex.
Non repaint MT4
Yan Zhen Du
5 (1)
This is a professional chart indicator designed for traders focused on stability and clear price action. It helps filter market noise and provides clear visual entry and exit zones for your trading decisions. Core Features: Strictly Non-Repainting: The system is built with strict non-repaint logic. What you see on the chart is the true historical performance. Confirmed Signals: Signals are triggered and confirmed only after the candle closes . Once a trading arrow appears on a closed candle, it
Forex Breath System is a trend based trading system which can be used with any market. You can use this system with currencies, metals, commodities, indices, crypto and even stocks. It can also be used with any time frame. The system is universal. It shows trend and provides arrow signals with the trend. The indicator can also provide you with a special type of alerts when the signals appear in the direction of the trend which makes trend trading an easy task. The indicator is very easy to use a
Advanced Supply Demand
Bernhard Schweigert
4.91 (302)
Trading Special – 30% OFF Best Solution for any Newbie or Expert Trader! This indicator is a unique, high quality and affordable trading tool because we have incorporated a number of proprietary features and a new formula. With this update, you will be able to show double timeframe zones. You will not only be able to show a higher TF but to show both, the chart TF, PLUS the higher TF: SHOWING NESTED ZONES. All Supply Demand traders will love it. :) Important Information Revealed Maximize the pot
Trading Special – 40% OFF Best Solution for any Newbie or Expert Trader! This indicator is a unique, high quality and affordable trading tool because we have incorporated a number of proprietary features and a secret formula. With only ONE chart it gives Alerts for all 28 currency pairs. Imagine how your trading will improve because you are able to pinpoint the exact trigger point of a new trend or scalping opportunity! Built on new underlying algorithms it makes it even easier to identify and c
Super Signal – Skyblade Edition Professional No-Repaint / No-Lag Trend Signal System with Exceptional Win Rate | For MT4 / MT5 It works best on lower timeframes, such as 1-minute, 5-minute, and 15-minute charts. Core Features: Super Signal – Skyblade Edition is a smart signal system designed specifically for trend trading. It applies a multi-layered confirmation mechanism to detect only strong, directional moves supported by real momentum. This system does not attempt to predict tops or bottoms
Tokyo mt4 Indicator
Vasiliy Strukov
5 (9)
Tokyo Indicator provides a clear visual overview of trend direction, potential trading signals, and market conditions. Its colour-coded, stepped trend line distinguishes bullish phases in blue from bearish phases in magenta. Matching directional arrows highlight potential buying and selling opportunities when the displayed trend changes. An integrated dashboard brings together the current signal, market bias, momentum, volatility, and signal quality in one convenient view. This allows traders t
Liquidity Scalper System: a liquidity-based trading system in indicator form. Most indicators only show an arrow, and the trader then has to decide where the stop goes, where the target is and whether the signal can be trusted at all. Liquidity Scalper System covers the full trade cycle: it finds liquidity pools, gives a signal when they are broken, immediately calculates Entry, Stop Loss and three targets, and shows statistics and out-of-sample test results on the panel. The system picks its o
Market Reversal Alerts
Lee Samson
4.19 (114)
Profit from market structure changes as price reverses and pulls back. The Market Reversal Alerts indicator identifies when a trend or extended price move is approaching exhaustion, alerts you the moment market structure shifts, and confirms the entry when price re-tests the reversal zone, so you trade defined areas instead of guesses. How it works As price forms new highs or lows near potential exhaustion points, the indicator identifies the breakout and momentum, then draws a rectangle on the
Gann Made Easy
Oleg Rodin
4.84 (174)
Gann Made Easy is a professional and easy to use Forex trading system which is based on the best principles of trading using the theory of W.D. Gann. The indicator provides accurate BUY and SELL signals including Stop Loss and Take Profit levels. You can trade even on the go using PUSH notifications. PLEASE CONTACT ME AFTER PURCHASE TO GET TRADING  INSTRUCTIONS   AND GREAT EXTRA INDICATORS  FOR FREE! Probably you already heard about the Gann trading methods before. Usually the Gann theory is a
Neuro Poseidon MT4
Daria Rezueva
4.74 (46)
Neuro Poseidon is a new indicator by Daria Rezueva. It combines precise trading signals with adaptive TP/SL levels - creating best possible trades as a result! Message me and get  Neuro Poseidon Assistant  as a gift to automize your trading process! What makes it stand out? 1. Proven profitability on all assets and timeframes 2. Only confirmed BUY and SELL signals present on the chart 3. Adaptive TP & SL levels generated by the software for each trade 4. Easy to understand - suitable for all
Break and Retest Hunter MT4 is a powerful MetaTrader 5 indicator designed to automatically identify support and resistance levels, breakout structures, and potential retest opportunities in real time. Bonus Indicator: After purchasing Break and Retest Hunter , contact me to receive Trade Indicator Assistant EA completely free as a bonus utility. $65 for the next 10 copies . Next price is $120.  Combining adaptive market analysis, clear BUY/SELL signals, Fibonacci-based profit targets, and a pre
Gold Channel is a volatility-based indicator, developed with a specific timing algorithm for the XAUUSD pair, which consists of finding possible corrections in the market. This indicator shows two outer lines, an inner line (retracement line) and an arrow sign, where the theory of the channel is to help identify overbought and oversold conditions in the market. The market price will generally fall between the boundaries of the channel. If prices touch or move outside the channel it is a tradi
More from author
Elliott Wave Auto Count for MetaTrader 4 labels Elliott waves automatically on four degrees at the same time: the base degree and the three degrees above it. It follows the rules and guidelines of "Elliott Wave Principle" (Frost & Prechter), and for the current wave it shows a price x time target zone and an invalidation level. It is meant for MT4 traders who use Elliott wave analysis and want a rule-based starting count, with the alternate count and the invalidation level always visible. It is
Fibo Price Time Zones combines Fibonacci price levels with Fibonacci time targets and draws them on the chart as boxes (price x time zones). Where boxes from several waves and from up to two higher timeframes overlap, the area is emphasized in three levels. It is meant for traders who already use Fibonacci retracements and extensions and also want to see roughly when a level is worth watching, without drawing every tool by hand. It is a display tool only: it gives no buy or sell signals and doe
RSI AutoScale is a clean, lightweight RSI for traders who use both TradingView and MetaTrader 5 and want the two charts to look the same. WHAT IT SHOWS - RSI (Wilder smoothing): the same values as the standard RSI, with any applied price. - Signal line on the RSI: SMA, EMA, SMMA or LWMA, with its own period. - Levels: upper, middle and lower lines (70 / 50 / 30 by default). They use MT5's native levels, so they reach the right edge and their values appear on the scale. - Zone fills: the middle
FREE
Stoch RSI Band Fill is a Stochastic RSI indicator for MetaTrader 5. MT5 does not include a built-in Stoch RSI, so this indicator adds one. It follows the same calculation steps as the built-in Stoch RSI on TradingView and uses the same layout: K and D lines, 80 / 50 / 20 levels and a shaded band between the upper and lower levels. CALCULATION, STEP BY STEP 1. RSI of the selected price (default: close, length 14), smoothed with Wilder's method (RMA). The first average is the simple average of the
FREE
Pivot Points Six Types with Level Alerts is a TV-compatible pivot point indicator for MetaTrader 5. It uses the same formulas and the same period boundaries as the "Pivot Points Standard" indicator that comes with TradingView, and it draws the levels the same way: short horizontal lines that start at the first bar of each period, with "R1 (price)" style labels in orange (#FB8C00). SIX CALCULATION TYPES The levels are calculated from the high, low and close of the previous period. - Traditional
FREE
MACD Four Color Histogram is a MACD for MetaTrader 5 that uses the same formula and the same look as the built-in MACD on TradingView. It is made for traders who use both platforms and want the MACD on each chart to read the same way. HOW IT DIFFERS FROM THE MT5 STANDARD MACD - MT5 standard MACD: the histogram is the MACD line itself, and the signal line is an SMA. - This indicator: three parts, as on TradingView. MACD line, signal line, and histogram = MACD - signal. The histogram has 4 colors.
FREE
This is the MetaTrader 4 edition of RSI AutoScale. It draws the standard Wilder RSI with a signal line, a shaded band between the levels, colored areas where the RSI leaves that band, and a choice of three scales. It is meant for traders who use TradingView and MetaTrader 4 side by side and want the RSI pane to look much the same on both. HOW IT LOOKS ON MT4 - RSI line: the same values as MT4's built-in RSI for the same period and applied price. - Signal line: a moving average of the RSI (SMA, E
FREE
MetaTrader 4 ships with a Stochastic and an RSI, but not with a Stochastic RSI. This indicator fills that gap for MT4 users and is built to be TV-compatible: it follows the calculation of the Stoch RSI that comes with TradingView, and the pane looks the way TradingView users expect - a blue K line, an orange D line, dashed 80 and 20 levels, a dotted 50 line and a light band between 80 and 20. WHAT APPEARS IN THE SUBWINDOW - K and D lines. The Data Window lists only K and D. - Upper band (80) a
FREE
Supply & Demand Zones marks supply and demand zones on a MetaTrader 5 chart with one fixed, fully published rule: a strong bar (body at least X times ATR) that leaves a short "base" of small-body bars behind it. The base becomes a demand zone when the strong bar is bullish and closes above it, or a supply zone when the strong bar is bearish and closes below it. Each zone shows its state: fresh, touched with a count, or broken. It is meant for traders who draw these zones by hand and want them d
FREE
Pivot Points Six Types with Level Alerts MT4 brings TV-compatible pivot points to MetaTrader 4. If you also chart on TradingView, you know its built-in "Pivot Points Standard". This MT4 indicator reproduces it: the same six calculation methods, the same period choices from one day to ten years, and the same look - an orange (#FB8C00) line for each level, starting at the beginning of each period, labelled like "S2 (1.08345)". WHICH LEVELS EACH METHOD GIVES Method | Levels drawn | Note Tradition
FREE
A MetaTrader 4 MACD built to read like the MACD you see on TradingView: a MACD line, a signal line, and a histogram of the gap between them, colored in four shades. If you switch between the two platforms during the day, the MACD pane on your MT4 chart will look and behave the way you are used to. WHY NOT THE MT4 BUILT-IN MACD? MT4's own MACD draws the MACD line as gray bars and smooths the signal line with an SMA. There is no separate histogram and no color change. This indicator calculates the
FREE
Candle Countdown Tag with Spread shows how long the current candle has left, in a small colored tag right next to the last candle - the way TradingView shows its bar countdown. The same tag can also show the current spread, the time left of up to two more timeframes and the open time of the next candle. It is a display tool for MetaTrader 5: no alerts, no signals, no trading. WHAT IT SHOWS - Time left of the chart timeframe: mm:ss under one hour, hh:mm:ss under one day, "2d 04:15:30" for longe
FREE
VWAP Band Fills with Anchored VWAP is a TV-compatible VWAP for MetaTrader 5. It uses the same formula as the built-in "VWAP" indicator of TradingView (Pine ta.vwap), offers the same inputs - anchor period, source, offset, standard deviation or percentage bands #1 to #3 - and draws it the same way: a blue VWAP line, green / olive / teal bands and light fills between them. An optional anchored VWAP starts from a vertical line that you drag to any bar. HOW IT IS CALCULATED For every bar of the cu
FREE
Dow Structure MTF shows the Dow theory trend of five timeframes at once in MetaTrader 4, using the pullback low / rally high method that is common among Japanese traders. For each timeframe it shows whether the trend is up, down or range, which price would change it, and how far the current price is from that price. Only closed bars are used, so a confirmed result does not change afterwards (no repaint). It is meant for traders who check the trend structure of several timeframes by hand and wan
Fibo Price Time Zones for MetaTrader 4 combines Fibonacci price levels with Fibonacci time targets and draws them on the chart as boxes (price x time zones). Where boxes from several waves and from up to two higher timeframes overlap, the area is emphasized in three levels. It is meant for MT4 traders who already use Fibonacci retracements and extensions and also want to see roughly when a level is worth watching. It is a display tool only: it gives no buy or sell signals and does not place ord
Time Average Lines draws four averages measured by time, not by the number of bars, so each line keeps the same length of time when you switch timeframes: a time moving average, a TWAP, a same-time-of-day average and a time-based EMA. For the same-time average, the rest of today is shown as a dotted path that joins the past averages; the path is a summary of the past, not a forecast. It is meant for intraday traders who want averages that mean the same thing on M1 and on M15, and who want to co
Auto Trendline Channel MTF draws trendlines, parallel channels and horizontal support / resistance automatically from confirmed swing highs and lows in MetaTrader 4, and records for each line the touch count, close breaks, wick breaks and retests. A table shows, for the chart timeframe and two higher timeframes, the nearest line above and below the price, the distance to it and the Dow theory direction. It is meant for traders who draw trendlines and levels by hand and want them drawn by fixed,
Currency Strength Meter for MetaTrader 4 combines the 28 pairs of the 8 major currencies (USD, EUR, JPY, GBP, AUD, NZD, CAD, CHF) into one strength line per currency, with a ranking table for the chart timeframe, M15, H1, H4 and D1. The full formula is published below. It is meant for MT4 traders who compare currencies before choosing which pair to look at, and who want to know exactly how the numbers are made. It is an analysis aid: it does not tell you when to buy or sell and does not show fu
Trade History Stats Panel for MetaTrader 4 reads the closed trades in your own account history and sums them up in a panel on the chart: number of trades, win rate, profit factor, average P/L per trade, drawdown of the closed-trade curve, holding time, buy / sell, and tables by month, symbol, weekday and hour. It is meant for traders who want to look back at their own past trades, like a trading journal that fills itself in, and to check the numbers by period, symbol or magic number. It never p
Prop Challenge Loss Tracker for MetaTrader 4 shows, in a panel on the chart, how much room is left before the daily loss limit and the maximum loss limit of a funded-account (prop) challenge are reached, and sends staged alerts as the limits are used up. It is meant for traders taking a prop challenge who want to see their remaining loss room at a glance, set to the rules of their own program. It is a display and alert tool only: it never opens, modifies or closes any order. Whether a limit is
Market Structure Liquidity Map for MetaTrader 4 draws smart money concepts (SMC) style market structure on the chart: swing labels, break of structure (BOS), change of character (CHoCH), equal highs and lows, previous day and week levels, liquidity sweeps and unfilled fair value gaps (FVG), with a small table for the chart timeframe and two higher timeframes. It is meant for MT4 traders who read structure and liquidity by hand and want the same levels drawn the same way every time. It is a disp
Divergence Detector for MetaTrader 4 finds regular and hidden divergences between price swings and one oscillator of your choice (RSI, MACD histogram, Stochastic %K, OBV, CCI or Momentum) and draws them on the price chart and in the indicator window, with a small table for four other timeframes. It is meant for MT4 traders who look for divergences by eye and want them found by fixed, visible rules on closed bars. It is a display tool only: it gives no buy or sell signals and does not place orde
Multi Symbol Market Scanner Panel shows up to 30 symbols in one table on your MT4 chart: trend direction, RSI and ATR% on M15, H1, H4 and D1, plus today's range, distance from yesterday's high or low and a simple H1 / H4 swing structure. Click a symbol name to switch the chart to it. It is meant for MT4 traders who watch many forex pairs, metals or indices and want one overview instead of opening many charts. It is a display tool only: it gives no buy or sell signals, does not rank symbols to t
Asia London New York Session Key Levels for MetaTrader 4 draws the three main sessions (plus one optional extra session) as boxes with their high, low and open lines, and adds key levels: previous day, week and month high and low, week and month open, and round numbers. Session times can be set in New York time, London time, UTC or server time, with daylight saving handled automatically. It is meant for MT4 intraday traders who mark session ranges and prior-day levels by hand and want them draw
Risk and Lot Size Calculator for MetaTrader 4 works out the lot size for the amount you are prepared to lose. Drag three lines on the chart (entry, stop loss, take profit) and the panel shows the lot size, the money at risk, the profit at the take profit, the risk:reward ratio and the margin required, with an optional view of the loss room left on a prop (funded) account. It is meant for manual traders who want to size each position from the stop distance before they place the order. It is a ca
Copy trades between MetaTrader 4 and MetaTrader 5 terminals on one Windows computer. Cross Terminal Trade Copier MT4 runs in an MT4 terminal, either as the sending side (Master) or as the copying side (Receiver). The data goes through a file in the MetaTrader common data folder: no DLL imports, no web requests, no outside server. Use it only for your own accounts on one PC. It is not intended for copying into anyone else's account or for distributing signals. IMPORTANT - ONE MASTER ON EACH CH
Daily and Max Loss Limit Guard MT4 is an Expert Advisor for MetaTrader 4 that keeps an eye on the account equity and enforces the loss limits you choose. When the daily loss limit, the maximum loss floor or the optional daily profit target is reached, it removes pending orders, closes the open orders it is responsible for, and keeps closing any new order until the stop ends. On the chart, the panel uses the short name "Equity DD Guard". What it is not: it does not open trades on your real or de
An Expert Advisor for MetaTrader 4 that treats several open orders as one "basket" and closes the basket as a whole when the combined profit or loss gets to the level you have chosen. It works with orders from manual trading and from other EAs. On the chart, its panel carries the short name "Basket P/L Closer". Please note what it does not do. It places no new trades on your real or demo account, offers no buy or sell signals and is not a trading system. Out of the box all four closing rules ar
Do you mark supply and demand zones by hand and get a slightly different result every time? This free MetaTrader 4 indicator draws them with one fixed rule that is written out in full below, so you can check every zone yourself. The idea: a strong candle (body at least X times ATR) leaves a "base" of 1 to 10 small candles right before it. A bullish strong candle that closes above the base turns it into a demand zone; a bearish one that closes below it turns it into a supply zone. The indicator
FREE
VWAP Band Fills with Anchored VWAP MT4 brings the VWAP of TradingView to MetaTrader 4. If you use TradingView's built-in "VWAP", you will find the same inputs here (Anchor Period, Source, Offset, Bands Calculation Mode, Bands Multiplier #1 to #3, Hide VWAP on 1D or Above), the same formula (Pine ta.vwap) and the same colors - plus an anchored VWAP that starts wherever you drag a vertical line. THE FORMULA Within each anchor period, bar by bar: VWAP = sum(source x tick volume) / sum(tick volume
FREE
Filter:
No reviews
Reply to review