Prior Day Week Month Levels with Touch Alerts
- Indicators
-
Kazuma Uezono
 MQL5 / MQL4 / Pine Script v6 developer and active trader.
Seller on the MQL5 Market (indicators for MT4/MT5).
Services:
- TradingView Pine Script to MT5/MT4 conversion (bar-by-bar matching, with tester report)
- MT4 to MT5 migration - Version: 1.1
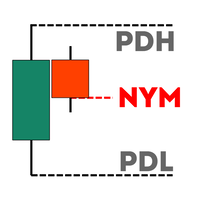
Prior Day Week Month Levels with Touch Alerts draws the previous day, week and month high and low on your MetaTrader 5 chart as clean horizontal lines with labels at the right edge, in the style of TradingView. It can also show the previous day's close and today's open.
LEVELS
- PDH / PDL: previous day high and low (blue #2962FF, solid)
- PWH / PWL: previous week high and low (orange #FF9800, dashed)
- PMH / PML: previous month high and low (purple #9C27B0, dash-dot)
- PDC: previous day close (grey, dotted, off by default)
- DO: today's open (cyan, dotted, off by default)
Every level can be switched on or off and has its own color; style and width are set per group.
HOW IT IS CALCULATED
- The values are the high, low and close of the last completed day, week or month, and the open of the current day - the same "one period back" values that TradingView scripts read with request.security(..., high[1]).
- They are built from D1 bars, so M5, H1 and H4 charts all show the same levels.
- Days, weeks and months are cut by the server time of your MT5 account. Weeks start on Monday, as on TradingView.
- Sunday bars (some brokers have a short Sunday session), 4 choices: Auto (added to Monday when the symbol has no Saturday bars, otherwise counted as its own day), Merge into Monday, Sunday is its own day, Ignore Sunday bars.
HOW WE CHECKED IT
- The values matched our independent reference calculation on every compared bar.
- On a test account whose server day starts at the same moment as TradingView's FX day, the day, week and month boundaries were the same as on TradingView.
DISPLAY
- Each line starts at the first bar of the current period and runs to the latest bar plus a number of bars to the right (Extend, 15 by default).
- Periods to draw: 1 = only the current lines; up to 50 to also see the levels of earlier periods.
- Labels at the right end: short ("PDH 1.08450") or long ("Prev Day High"), with or without the price, font size 6 to 20.
- Lines whose labels would overlap are combined into one label, for example "PDH / PWH 1.08450" or "PDC 1.08216 / DO 1.08214". Hover over a label to see every level and price. The grouping is re-checked when you zoom or scroll.
- On a W1 chart the daily lines are hidden; on an MN1 chart the daily and weekly lines are hidden (a bar there is longer than the period).
ALERTS (OFF BY DEFAULT)
- One condition: the price (Bid) touches or crosses a shown line of the current period.
- Once per line and per period: after PDH has alerted today, it will not alert again until the next day's PDH. This is remembered through a timeframe change, re-attaching or a restart of MT5 (terminal global variables named PHLTV_...).
- The first tick after loading, and the first tick of a new period, only set the starting point and never alert.
- Message example: "Prev H/L TV EURUSD M15: price touched PDH 1.08450 (1.08451)". Several lines touched on the same tick are listed in one message.
- Pop-up, sound and push notification can be combined. Push needs your MetaQuotes ID in the terminal options. English or Japanese text.
- A touch alert only reports that price reached a line. It is not a signal to buy or sell, and these levels are not guaranteed to act as support or resistance.
FOR EA AND iCUSTOM USERS
- 8 buffers (not drawn): 0 = PDH, 1 = PDL, 2 = PWH, 3 = PWL, 4 = PMH, 5 = PML, 6 = PDC, 7 = DO. Each bar holds the values that were valid at that bar. EMPTY_VALUE where a value does not exist. They also appear in the Data Window.
- When an EA or another indicator loads it through iCustom, or when it is added with ChartIndicatorAdd, it draws nothing and raises no alerts; it only calculates the buffers.
PLEASE READ BEFORE USE
- Server time matters. If your broker's server day does not start when TradingView's day starts (for example a server on GMT+0, or stock-index and commodity CFDs with their own trading hours), the daily and weekly periods are cut at a different moment and the levels can differ from those on TradingView.
- D1 history is needed. If D1 data is not loaded yet, the indicator tries again every second for up to 60 seconds.
- For the first seconds after loading (up to about 15 seconds), the short name in the indicator list may briefly show "probe#..." while it checks whether it is on a chart. This is normal.
- In rare cases a line may remain on the chart after an EA has added and removed the indicator. Such objects start with "PHLTV#" and can be deleted in the Objects List (Ctrl+B).
- In the Strategy Tester it raises no alerts.
- No DLLs, no external files, no internet connection.
- A charting aid only. It does not trade and does not guarantee any trading result.
INPUTS
Periods: Sunday bars (Auto), Periods to draw (1, 1-50), Extend current lines right (15 bars, 0-500)
Previous Day / Week / Month: Show and color for each high and low, line style and width (1-5) per group
Previous Day Close / Today's Open: Show (false), color, style
Labels: Show labels at the right end (true), Label text (Short), Show prices in labels (true), Label font size (8, 6-20)
Alerts: Alert: price touches a level (false), Alert by pop-up (true), Alert by sound (false), Alert by push notification (false), Language (Auto = terminal language, English or Japanese)
If an input is out of range, the indicator does not load and writes the reason to the Experts log.
SUPPORT
Questions about installation, settings and bugs are welcome through MQL5 messages. Questions about market direction or individual trades are outside the support scope.
This is part of a series of free TV-style tools. An MT4 edition is also available as a separate product. Other tools by the same author are listed on my seller profile.
TradingView is a trademark of TradingView, Inc. This product is not affiliated with, sponsored by or endorsed by TradingView, Inc.