DrawPadMt4

DRX DrawPad: Chart Drawing Tool and Risk/Reward Trade Planner for MetaTrader 5

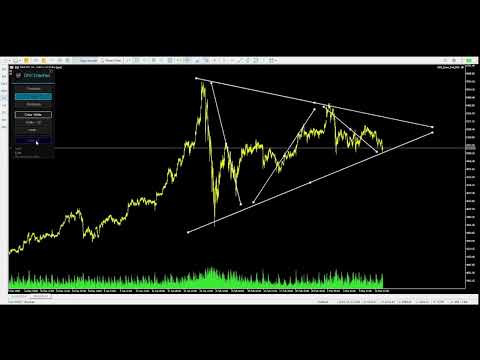
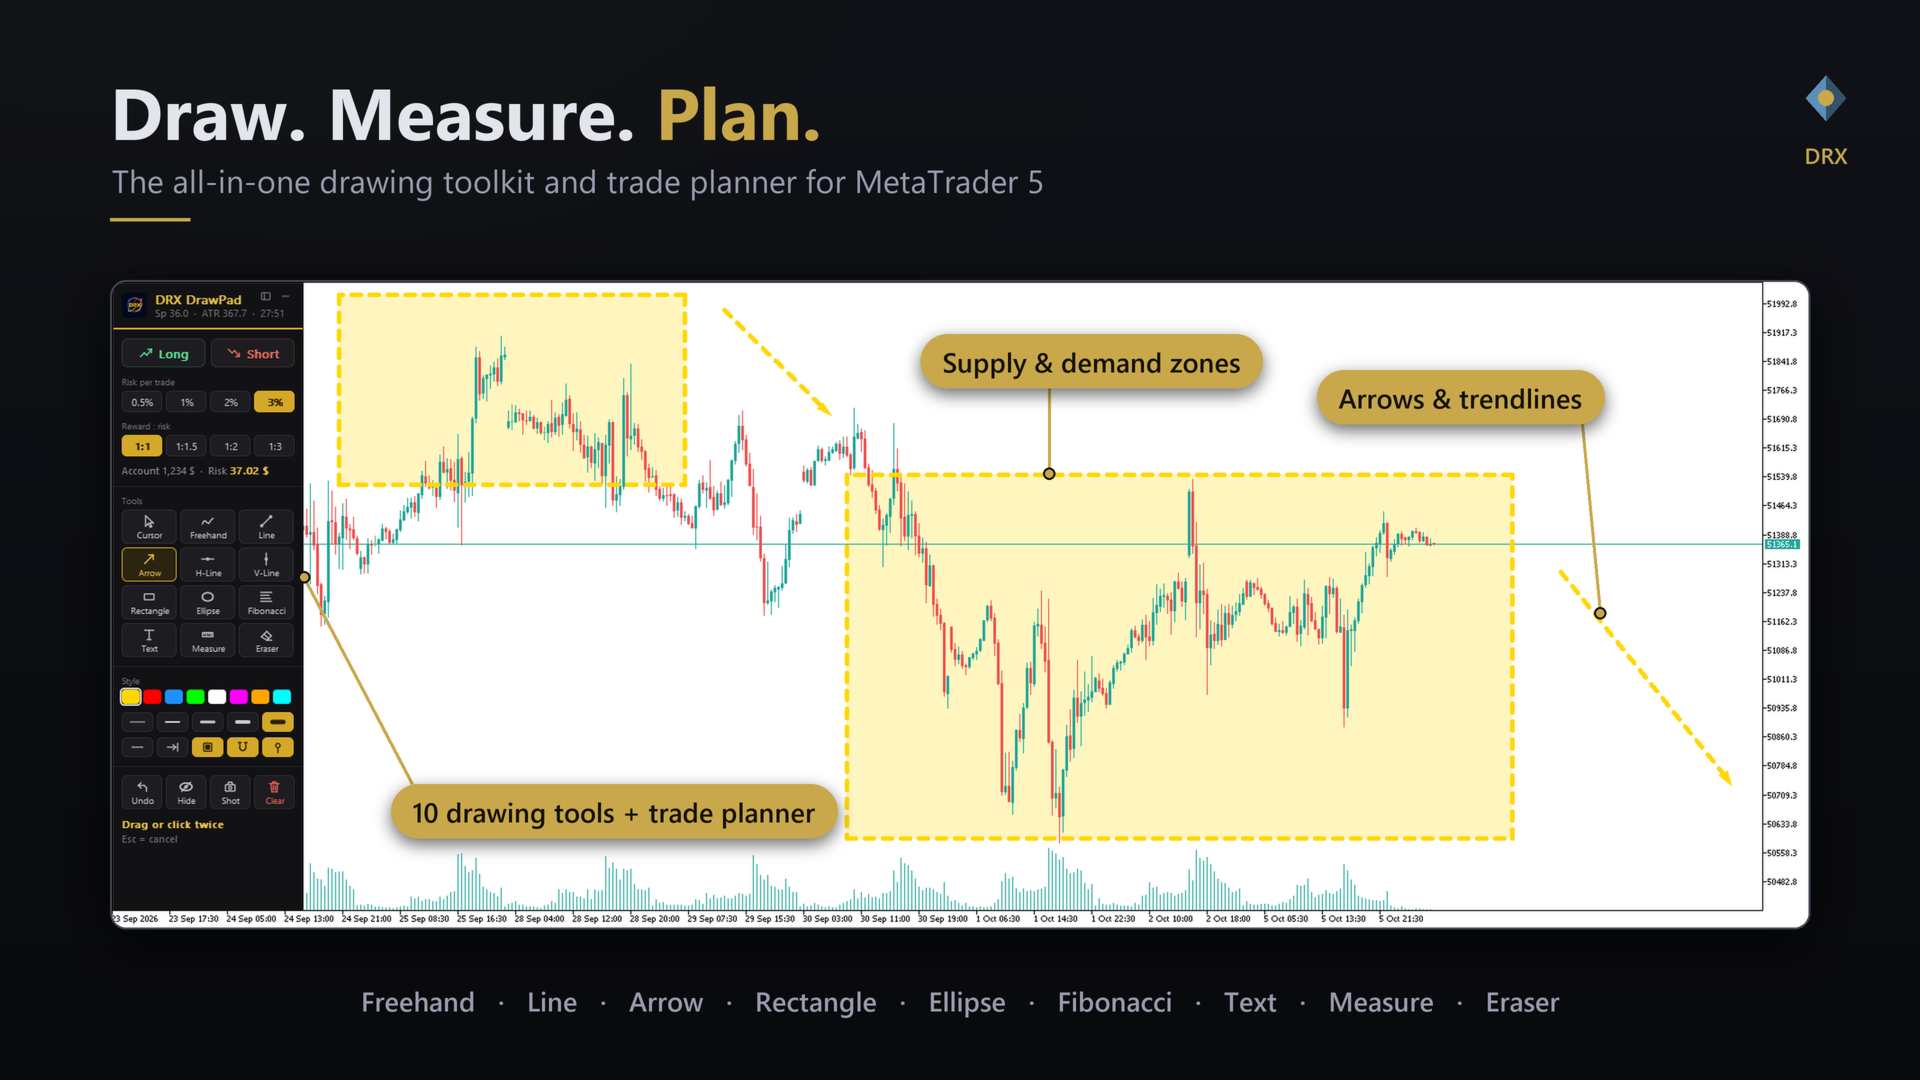
DRX DrawPad turns MetaTrader 5 into a complete visual analysis workspace. Draw, measure and plan trades directly on your MT5 chart, quickly and precisely, without any external software.

Freehand drawing, trendlines, arrows, Fibonacci, zones, text, a measure tape and a Long/Short position planner with automatic lot size, all in one slim dark panel that you can dock to any edge of the chart. It runs as an indicator, so it works next to any Expert Advisor and never places or changes an order.

Why DRX DrawPad?

MT5 has many drawing objects, but drawing spontaneously is slow: menus, object lists, wrong clicks, a chart that scrolls while you draw. DRX DrawPad removes these detours. Pick a tool, draw, done. Every drawing is a normal chart object, and the chart is locked automatically while you draw.

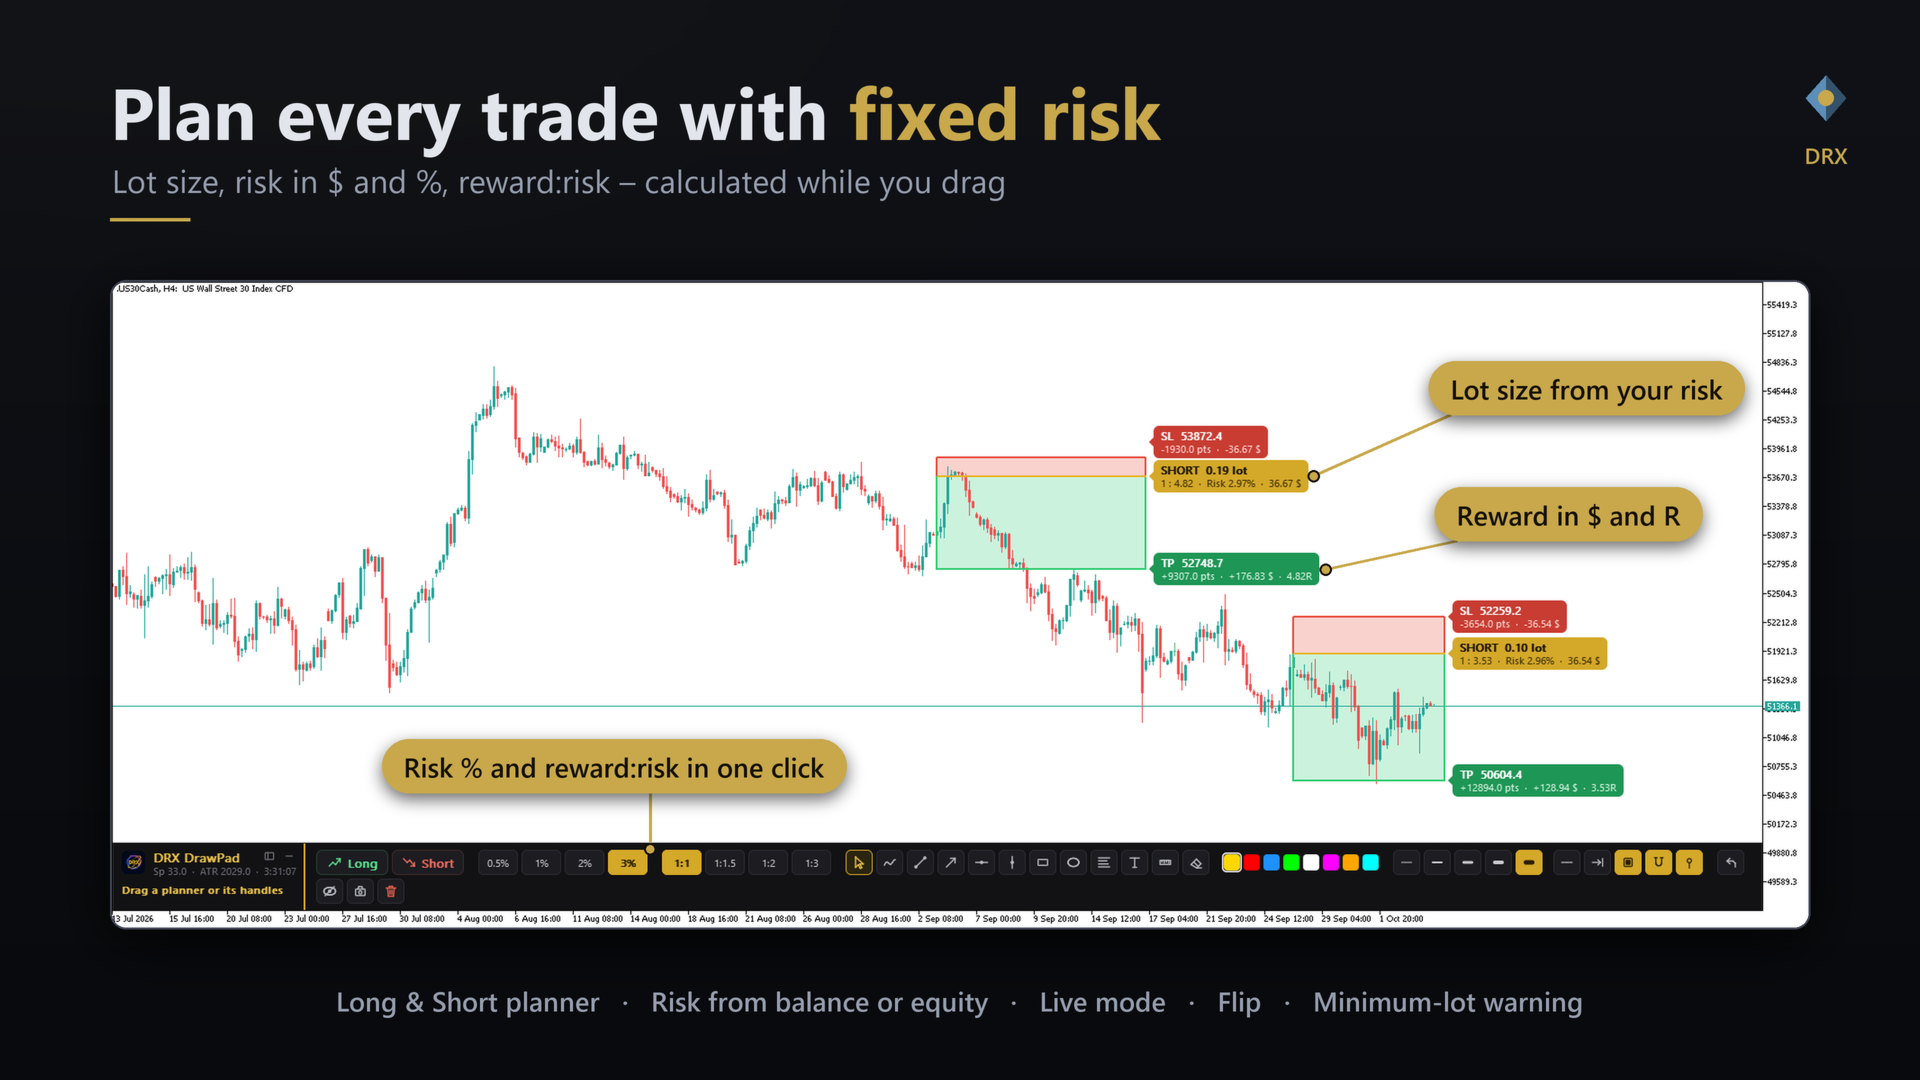
Trade planner: Long / Short position tool with risk and lot size
  • One click creates a complete plan: entry, stop loss and take profit appear at once (stop = ATR distance, adjustable). Or drag to place the stop exactly where you want it.
  • Position size calculator: lots are calculated from your account risk (0.5 / 1 / 2 / 3 % or your own values), based on balance or equity.
  • Reward:risk in one click: 1:1, 1:1.5, 1:2, 1:3 (editable). The take profit moves instantly.
  • Live handles: drag the take profit, entry, stop loss and the width of the box directly on the chart. Move the whole plan by its body.
  • Price badges show risk and reward in account currency, percent, pips/points and the reward:risk ratio.
  • Live mode: the entry follows the market price while you plan.
  • Flip between Long and Short with one click, delete a plan with one key.
  • Warnings when your stop is too wide for the minimum lot at the chosen risk, and when the price is already beyond the stop.
  • Prices are rounded to the symbol tick size. Works on forex, gold, indices and crypto.
Drawing tools
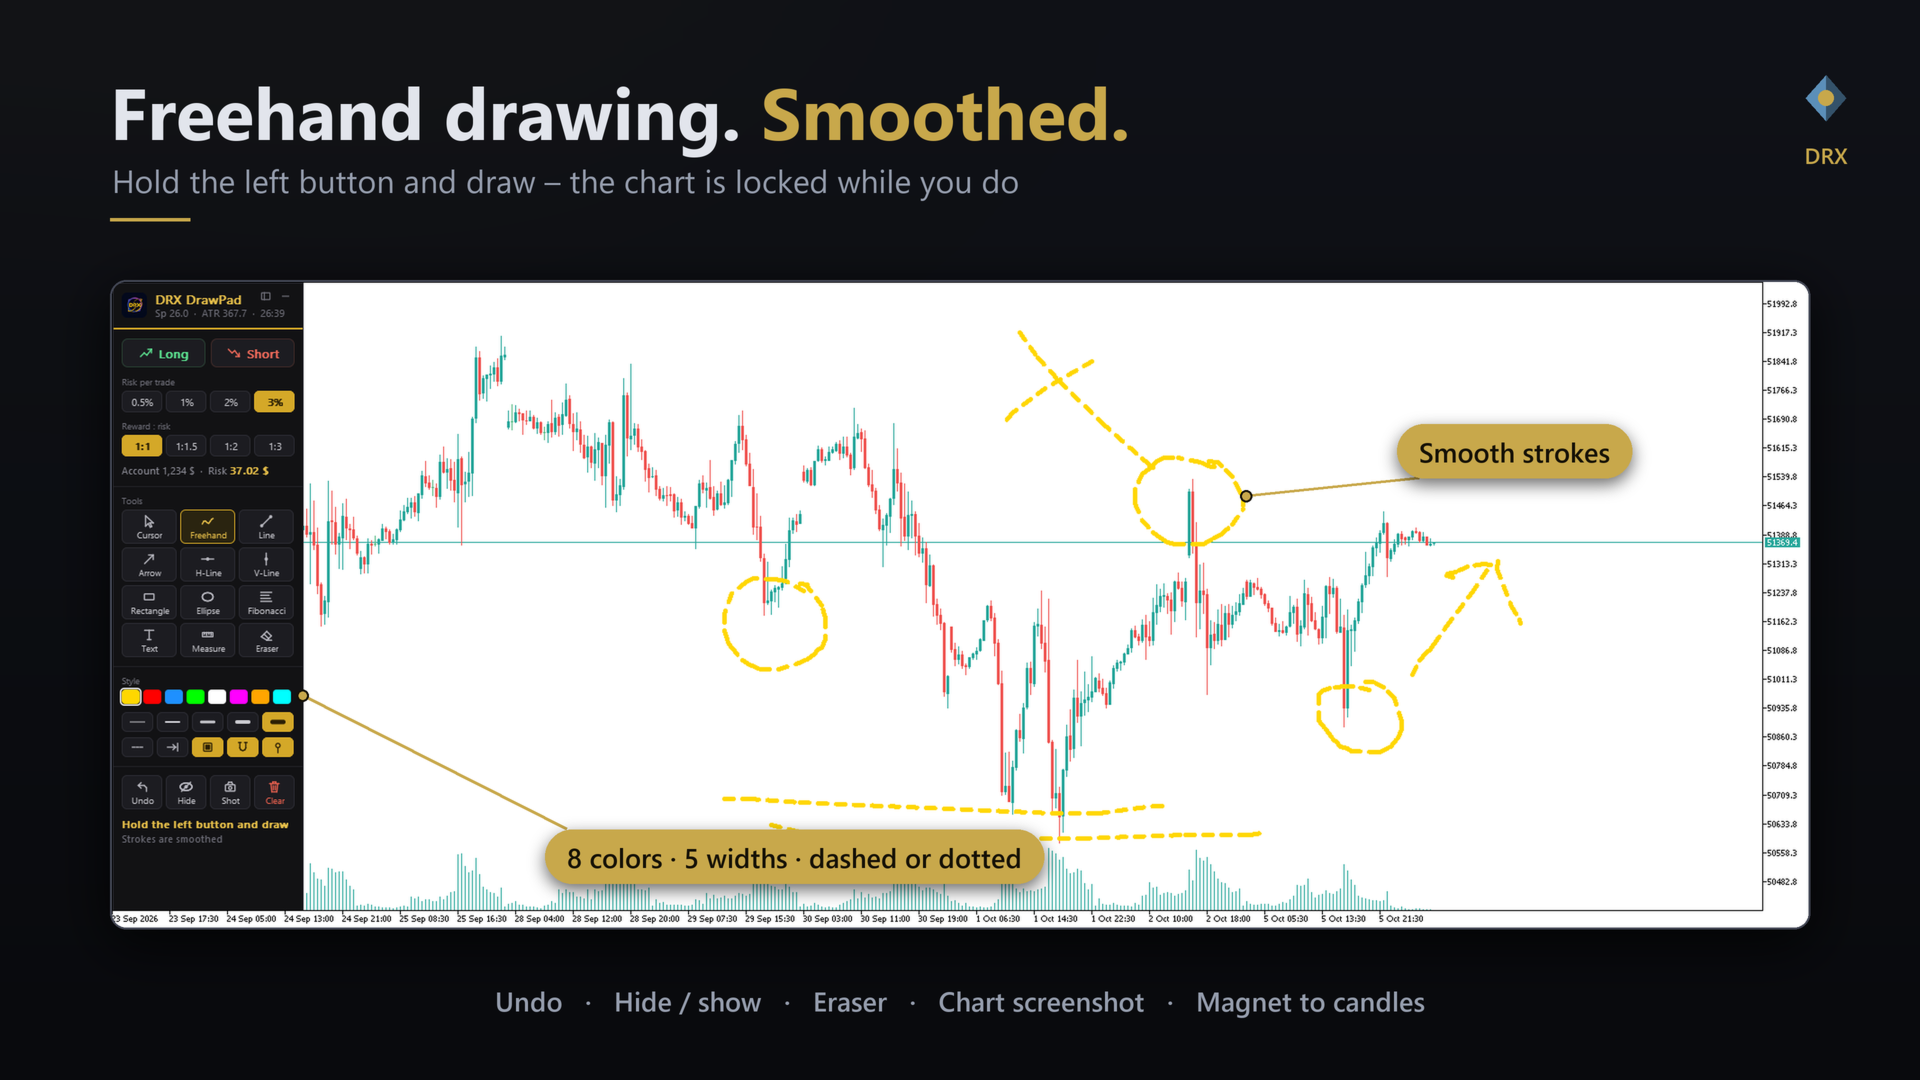
  • Freehand: hold the left mouse button and draw. Strokes are smoothed automatically.
  • Trendline and arrow: click twice or drag. Optional extension to the right.
  • Horizontal and vertical line: one click for levels and session markers.
  • Rectangle and ellipse: supply and demand zones, ranges, consolidation areas. Optional tinted fill.
  • Fibonacci retracement: drag between two points.
  • Text: click on the chart, type, press Enter.
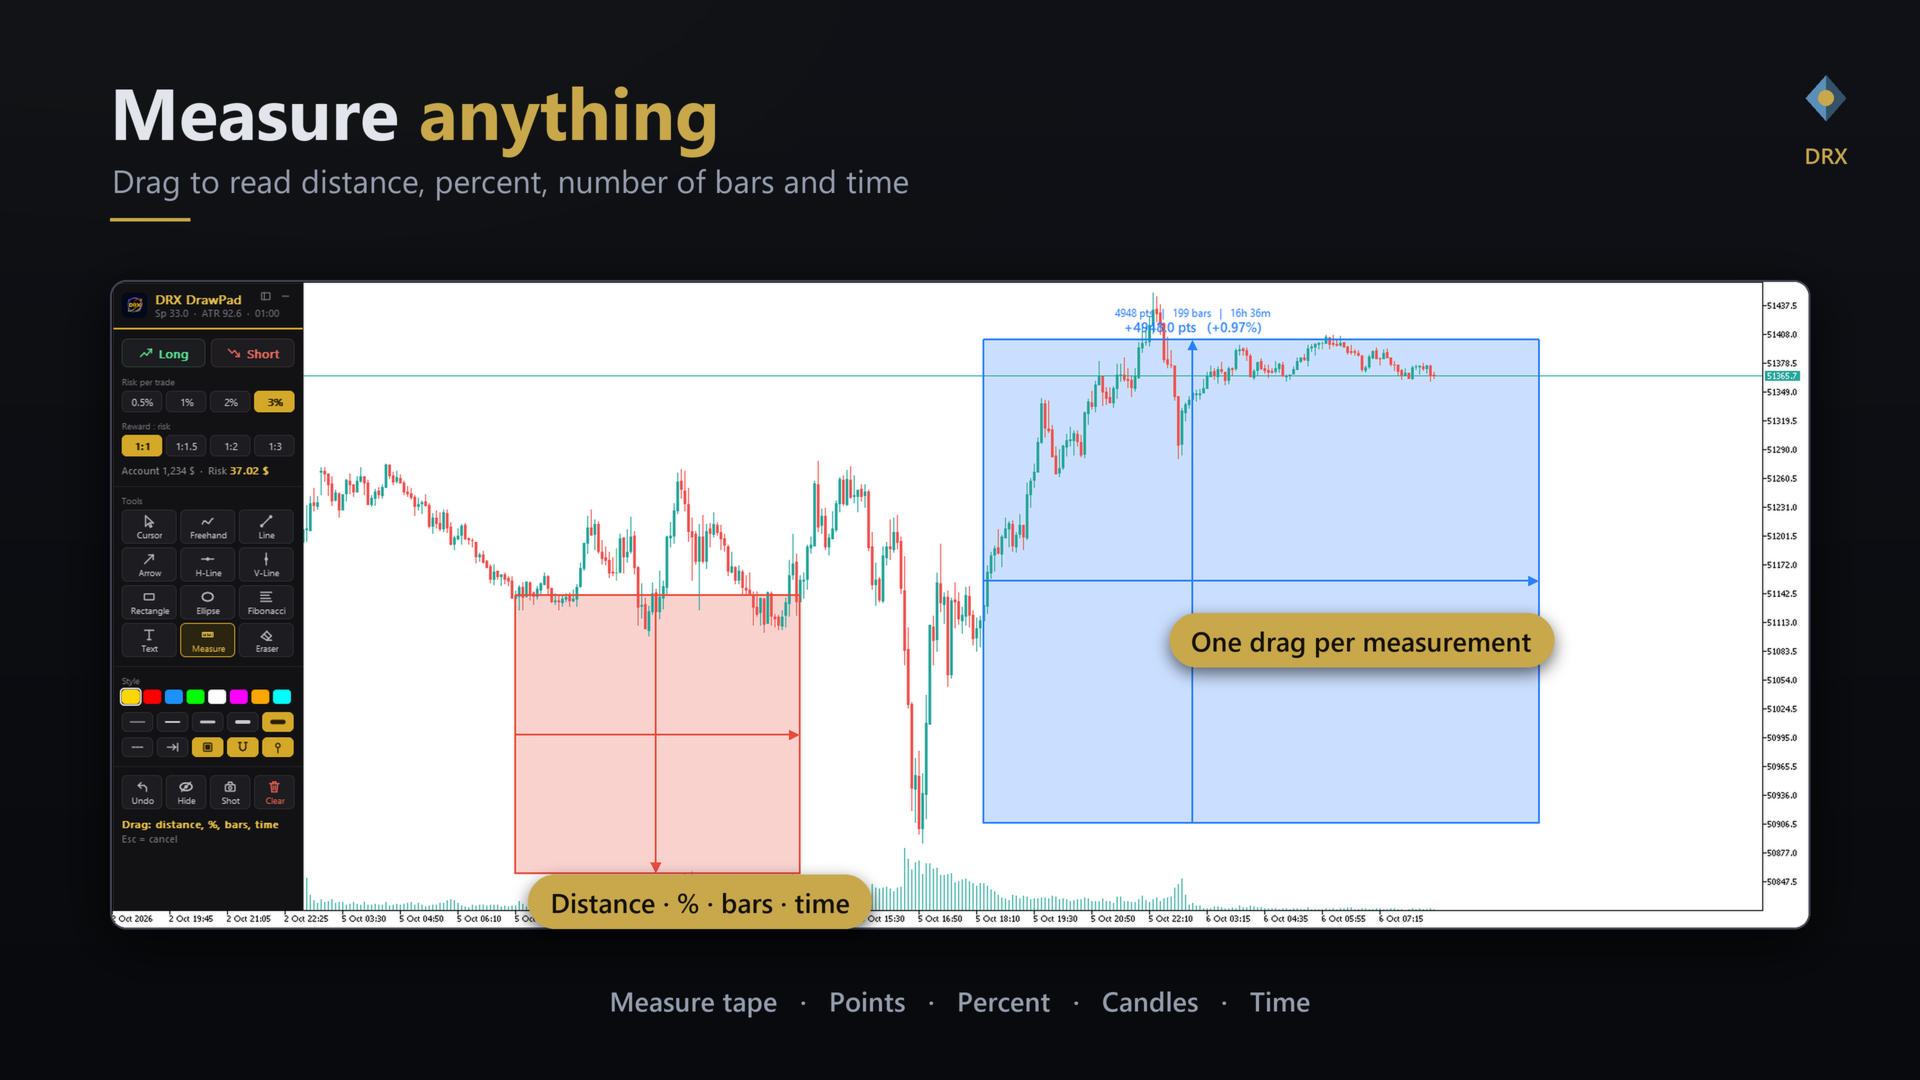
  • Measure tape: drag to read distance, percent, number of bars and time.
  • Eraser: click a drawing and the whole stroke, shape or plan is removed.
Helpers
  • Magnet: snap to candle open, high, low or close.
  • Undo the last drawing, hide or show all drawings, delete all drawings (with a safety click).
  • 8 colors, 5 line widths, solid, dashed or dotted lines.
  • Keep a tool active to draw several shapes in a row.
  • Screenshot of the chart with one key.
  • Automatic chart-scroll lock while you draw.
The panel
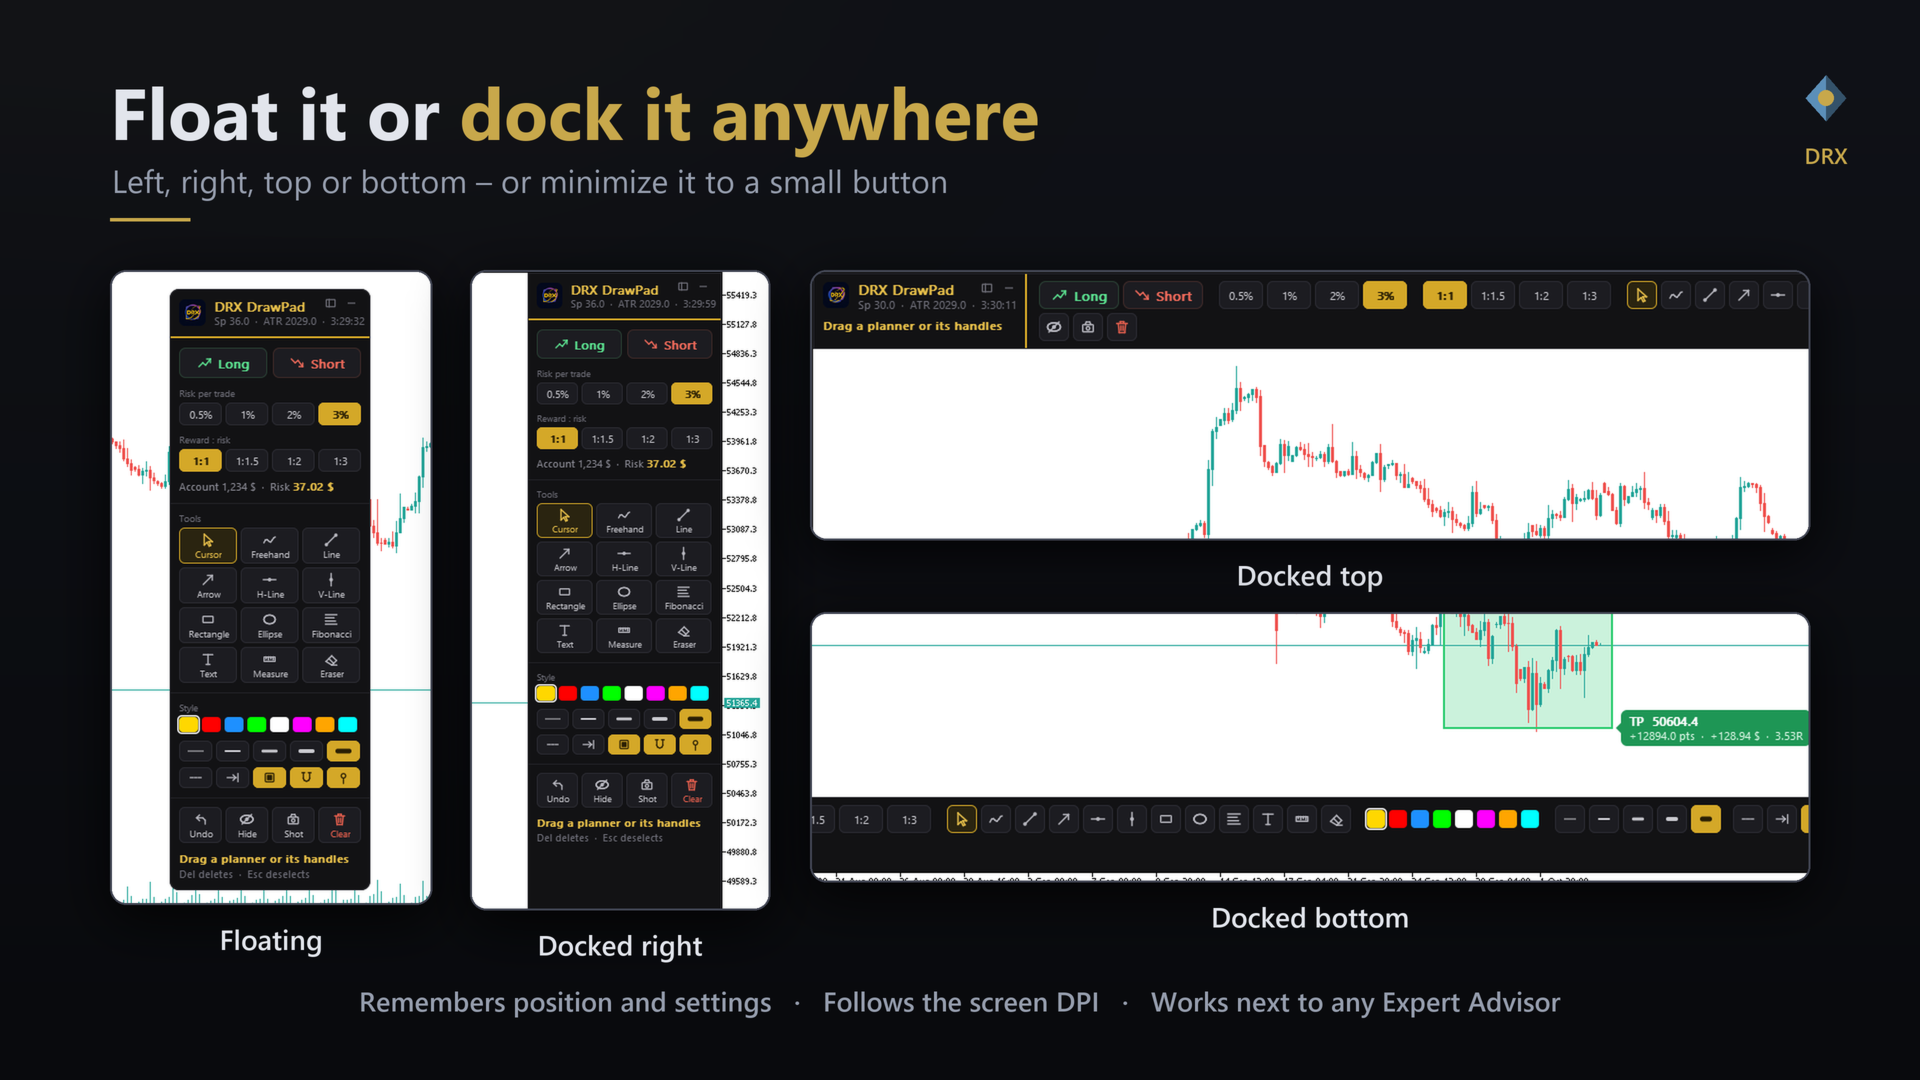
  • Floating or docked: left, right, top or bottom. Drag the panel to an edge and it docks.
  • Minimize it to a small button when you need the full chart.
  • Crisp rendering that follows the screen DPI (4K and high-DPI screens), adjustable size.
  • English and German interface. The panel remembers its position and settings.
  • Dark DRX design with a gold accent that fits any chart theme.
Keyboard shortcuts
Drawing tools V Cursor, F Freehand, L Line, A Arrow, H Horizontal line, U Vertical line, R Rectangle, E Ellipse, I Fibonacci, T Text, M Measure, X Eraser
Trade planner B Long, S Short, Del Delete plan, Esc Cancel
Helpers C Color, Z Undo, G Magnet, D Hide / show, P Screenshot, N Minimize, + / - Line width
Compatibility

DRX DrawPad is an indicator. You can analyze and plan trades on a chart that already runs an Expert Advisor, on the same chart at the same time. It does not place, modify or close orders and needs no DLL, no web requests and no external program.

Frequently asked questions Does DRX DrawPad open trades?

No. The trade planner is a visual and calculation tool. You place the order yourself.

Can I use it with an Expert Advisor on the same chart?

Yes. It is an indicator and runs next to any EA.

Do my drawings stay on the chart?

Yes, they are normal chart objects. You can also hide, undo or delete them from the panel.

Does it work on a 4K screen?

Yes. The panel follows the screen DPI and can be scaled in the settings.

Risk notice: trading carries a high risk of loss. DRX DrawPad is a drawing and planning tool, not financial advice.
Recommended products
Rainbow Price Visualizer v1.21 See where the market really breathes. Turns your MT4 chart into an ultra-precise heatmap that highlights price zones favored by big players. Why it matters 300 price levels at 0.2‑pip resolution — microscopic detail. 8 visual themes (Rainbow, Fire, Ocean…) for instant readibility. Smart opacity: low noise fades, real zones pop. Lightweight rendering with automatic cleanup. Fully customizable: saturation, opacity, resolution, history depth. Bands project into the f
This indicator has been designed to integrate with the Elliott Wave theory, providing two distinct methods of operation: Automatic Work: In this mode, the indicator operates autonomously by detecting all five motive waves on the chart according to Elliott Wave theory. It offers predictions and identifies potential reversal zones. Additionally, it has the capability to generate alerts and push messages to notify traders of significant developments. This automated functionality streamlines the pro
Channel BEAM
Vitalii Zakharuk
Channel BEAM - indicator of the channel and levels. If you use the Channel BEAM indicator to build the price band, then the trader will not have to conduct a detailed analysis of the market situation. All calculations in automatic mode will be performed by the indicator itself. This tool is simple and functional. When using it Channel BEAM, a price corridor is built on the chart: The upper line of the channel is the maximum value of the bar for a certain number of them. The lower line of the ch
NQX Session Range Breakout MT4 is a signal indicator for MetaTrader 4: breakout of the overnight range at the European open. Proprietary NQX logic that maps the quiet overnight range and signals the first decisive close beyond it in the European window. It draws the suggested entry, a short stop and long targets (3:1, 5:1, 10:1); you decide. What it draws on the chart - An arrow on the closed signal candle (it never repaints a closed signal). - The suggested entry, a short stop and a long sugges
The indicator detects and displays Shark harmonic pattern (see the screenshot). The pattern is plotted by the extreme values of the ZigZag indicator (included in the resources, no need to install). After detecting the pattern, the indicator notifies of that by a pop-up window, a mobile notification and an email. The indicator highlights the process of the pattern formation and not just the complete pattern. In the former case, it is displayed in the contour triangles. After the pattern is comple
Asterysc SL & TP Values Info, is an indicator which will allow you to see on the chart in a visual way the potential profit/loss you could have if your trade touches TP or SL. It will also allow you to see the total accumulated TP/SL of all open trades in a very simple way on each chart. You will also be able to quickly visualize the current Drawdown of your account. *The indicator is customizable, so you can change the colors, size and fonts of each section.
Alpha Trend sign has been a very popular trading tool in our company for a long time. It can verify our trading system and clearly indicate trading signals, and the signals will not drift. Main functions: Based on the market display of active areas, indicators can be used to intuitively determine whether the current market trend belongs to a trend market or a volatile market. And enter the market according to the indicator arrows, with green arrows indicating buy and red arrows indicating se
Great Indicator
Ruben David Santana Rodriguez
Les presento un indicador que funciona como estrategia por si solo , trabaja muy bien en periodos de 4 horas pero puedes aplicarlo a cualquier timeframe , las señales son muy faciles de interpretar , en momento en que la linea naranja pasa hacia arriba las media azul y roja , se entra en largos , la operativa se mantiene abierta hasta que la linea naranja cruce la media mas cercana ya sea la azul o la roja , si la operacion era long y la linea azul cruza hacia arriba la linea roja y la naranja c
The indicator detects and displays М. Gartley's Butterfly pattern. The pattern is plotted by the extreme values of the ZigZag indicator (included in the resources, no need to install). After detecting the pattern, the indicator notifies of that by the pop-up window, a mobile notification and an email. The pattern and wave parameters are displayed on the screenshots. The default parameters are used for demonstration purposes only in order to increase the amount of detected patterns. Parameters z
Fibonacci SR Indicator
Martin Eshleman
5 (1)
Fibonacci SR Indicator This indicator creates support and resistance lines. This indicator is based on Fibonacci Retracement and Extension levels. It will consider many combinations of the Fibonacci levels and draw support/resistance lines based on these. This indicator uses tops and bottoms drawn by the ZigZag indicator in its calculations. The ZigZag can also be drawn on the chart, if necessary. The indicator considers many combinations of past reversal points and Fibonacci ratio levels, and w
FREE
The indicator detects and displays 3 Drives harmonic pattern (see the screenshot). The pattern is plotted by the extreme values of the ZigZag indicator (included in the resources, no need to install). After detecting the pattern, the indicator notifies of that by a pop-up window, a mobile notification and an email. The indicator highlights the process of the pattern formation and not just the complete pattern. In the former case, it is displayed in the contour triangles. After the pattern is com
ADX Pointer
Dominik Mandok
ADX Pointer is an indicator which is based on "Average Directional Index" and draws three numbers in chart window depending on the value of ADX. In ADX Pointer you can set "ADX_Period" which is of course period of Average Directional Index and you can also set 3 levels. When ADX value exceed first level ("ADX_Level1") in chart window appears number "1", when ADX exceed second level ("ADX_Level2") appears "2" and when ADX exceed third level ("ADX_Level3") appears "3". Simple. ADX Pointer works on
The Average Directional Index(ADX) Multicurrency Scanner MT4 is an advanced trading indicator designed to analyze multiple currency pairs simultaneously. It benefits traders looking to enhance their decision-making process by providing real-time signals based on the Average Directional Index, allowing for efficient market trend analysis. This tool streamlines the trading experience by simplifying the identification of trend strength and directional movement, making it an essential asset for trad
Divergence Matrix Pro for MetaTrader 4 Divergence Matrix Pro is a confirmed multi-oscillator divergence indicator for MetaTrader 4. It detects regular and hidden divergence between price and selected oscillators, then presents the confirmed structure through divergence lines, pivot labels, action markers, an optional current-timeframe Matrix Panel and optional alerts. The indicator is an analysis and confirmation tool. It does not open or close trades, and the signal score is not a win rate or a
MACD Divergence
Sergey Deev
2.5 (2)
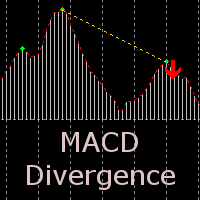
The indicator detects divergence signals - the divergences between the price peaks and the MACD oscillator values. The signals are displayed as arrows in the additional window and are maintained by the messages in a pop-up window, e-mails and push-notifications. The conditions which formed the signal are displayed by lines on the chart and in the indicator window. Indicator Parameters MacdFast - fast MACD line period MacdSlow - slow MACD line period MacdSignal - MACD signal line period MacdPric
DMS Fibo
Diogo Mitsunaga Dos Santos
Fibonacci retracements are trend lines drawn between two significant points, usually between absolute lows and absolute highs, plotted on a chart. Intersecting horizontal lines are placed at the Fibonacci levels. Fibonacci retracements are useful tools that help traders identify support and resistance levels. With the information gathered, they can place orders, identify stop-loss levels, and set price targets. Although useful, traders often use other indicators to make more accurate assessments
SimpleProb
Augusto Martins Lopes
SimpleProb: Your New Ally in the Financial Market! Description Are you tired of complicated indicators that confuse more than they help? SimpleProb is here to bring simplicity and efficiency to your trading experience on MetaTrader 4 ! SimpleProb is a technical analysis indicator designed for traders who seek clarity and precision in their buying and selling decisions. It calculates the probabilities of upward ( CALL ) and downward ( PUT ) movements based on the last 14 periods, providing clear
Auto Fibo Pro m
DMITRII GRIDASOV
"Auto FIBO Pro"   Crypto_Forex  indicator  - is great auxiliary tool in trading! Indicator automatically calculate and place on chart Fibo levels and local trend lines (red color). Fibonacci levels indicate key areas where price can reverse. Most important levels are 23.6%, 38.2%, 50% and 61.8%. You can use it   for reversal scalping  or for zone grid trading. There are plenty of opportunities to  improve your current system using Auto FIBO Pro indicator as well. It has Info Spread Swap Displa
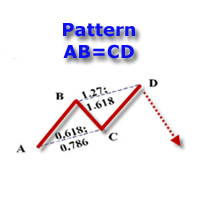
The indicator detects and displays the AB=CD harmonic pattern on the chart according to the scheme provided in the screenshot. The pattern is plotted by the extreme values of the ZigZag indicator (included in the resources, does not require additional installation). After detecting the pattern, the indicator notifies of that by the pop-up window, a mobile notification and an email. The indicator highlights not only the complete figure, but also the time of its formation. During the formation the
Galactic Volume spread analysis (VSA), is an indicator designed for the visualization of the Volume, and the proportion in which it affects the volatility of the spread of the different pairs. The strategy consists of the following: Bull Trend: Always going in favor of the trend, open buying operations at the lows of the trend, provided that it coincides with a high volume shown by the Galactic VSA indicator. Downtrend: Always going in favor of the trend, open sales operations at the highs of
The Wing Patterns indicator scans for many different kinds of Patterns using an XABCD structure. The term Wing Pattern is used to refer to all types of patterns based on a general XABCD structure, which is plotted in an alternate high-low extreme form. In other words, assume that point X is started at a low point on the chart. The point A is plotted at the next highest point within a certain number of bars. This certain number of bars is called the depth level. In this example, point B would be
Mr Beast Cobertura
Luis Mariano Vazquez Marcos
Mr Beast Super Hedge Asesor experto diseñado para trabajar encerrando el precio entre 2 valores hasta que rompa en una dirección tanto de compra como de venta. Este robot de trading de Forex ha sido desarrollado por MRBEAST como una herramienta para facilitar el trading intradía. Tenga en cuenta que el uso de este robot implica ciertos riesgos y no garantiza ganancias consistentes en el mercado de divisas. El robot de trading se basa en algoritmos y estrategias que he diseñado, los cuales se han
Atr Suplied and Demand Mr Beast
Luis Mariano Vazquez Marcos
MR BEAST INDICATOR ATR SUPLIED AND DEMAND ¡Descubre la herramienta definitiva para la toma de decisiones financieras con nuestro asesor experto! Diseñado para operar en la vanguardia de los mercados globales, este asesor se destaca por su capacidad única para analizar tendencias en tiempo real utilizando el indicador Average True Range (ATR) y el equilibrio de oferta y demanda. Al aprovechar el ATR, nuestro asesor experto evalúa la volatilidad actual del mercado, proporcionándote una visión clar
What are Fibonacci Numbers and Lines? Fibonacci numbers are used to create technical indicators using a mathematical sequence developed by the Italian mathematician, commonly referred to as "Fibonacci," in the 13th century. The sequence of numbers, starting with zero and one, is created by adding the previous two numbers. For example, the early part of the sequence is 0, 1, 1, 2, 3, 5, 8, 13, 21, 34, 55, 89,144, 233, 377, and so on. The Fibonacci sequence is significant because of the so-calle
Day Trades Resistance and Support (daytradesSR) is an indicator composed of 1.  The main line (support/resistance line),  which shows i.    either UP or DOWN trend ii.  levels of dynamic support or resistance    2.     A specific range  defined by a line for range high and another line for range low.   These lines serve as weak secondary support or resistance .    3.   When the main line (support/resistance line) is first hit by the price after a detected trend reversal , either an UP ARROW (sup
CYov_KijunLine_MTF (Kijun Ribbon / Multi-Timeframe Kijun) This indicator is designed to visualize Ichimoku Kijun-sen together with a higher-timeframe Kijun-sen , helping you keep your trading bias consistent and avoid low-quality conditions. It is not a “magic signal generator”. The goal is to provide a clearer perspective so you can reduce mistakes and avoid bad trades . 1. What is Kijun-sen? Kijun-sen is a core line of the Ichimoku system calculated from the highest high and lowest low over a
The Vortex Indicator was inspired by the work of an Austrian inventor, Viktor Schauberger, who studied the flow of water in rivers and turbines. Etienne Botes and Douglas Siepman developed the idea that movements and flows within financial markets are similar to the vortex motions found in water. The Vortex Indicator was also partly inspired by J. Welles Wilder's concept of directional movement, which assumes the relationship between price bars gives clues as to the direction of a market. This i
KijunSen vs Price Ichimoku Strategy MM Description in English and Italian = This Indicator is based on one of the Strategies with Ichimoku Indicator, in particular is the cross of the KijunSen with the Current Price; it will give you of Buy and Sell when they Cross, with Arrows and Alerts. When you attach the indicator on the chart , a window will open where , in the INPUT section, you can also choose to change the main Ichimoku values. SIGNAL INPUT =    · BUY = when Price cross above the K
RaysFX Supertrend Bar RaysFX Supertrend Bar è un indicatore personalizzato per MetaTrader 4. Utilizza l'indice di canale delle materie prime (CCI) per generare segnali di trading. L'indicatore mostra dei puntini in una finestra separata sotto il grafico principale per indicare i segnali di trading. Caratteristiche principali: Calcola il CCI per diversi periodi temporali. Visualizza puntini per indicare i segnali di trading. Permette all'utente di modificare i periodi temporali e la distanza tra
Dynamic Forex28 Navigator
Bernhard Schweigert
4.43 (7)
Specials Discount now. The Next Generation Forex Trading Tool. Dynamic Forex28 Navigator is the evolution of our long-time, popular indicators, combining the power of three into one: Advanced Currency Strength28 Indicator (695 reviews) + Advanced Currency IMPULSE with ALERT (520 reviews) + CS28 Combo Signals (recent Bonus) Details about the indicator  https://www.mql5.com/en/blogs/post/758844 Looking for the MT5 version? Click here:   https://www.mql5.com/en/market/product/201102   What Does Th
Buyers of this product also purchase
Trend SniperX MT4
Sarvarbek Abduvoxobov
5 (5)
Trend Sniper X is a multi-timeframe trend-following indicator for MetaTrader 5 that helps traders identify trend direction and potential reversal points with clarity and precision. For MT5: https://www.mql5.com/en/market/product/181101 Price Information: The current price is promotional and is subject to change as upcoming updates and new features are released. Code2Profit Channel Master the Market with Multi-Timeframe Analysis! How to Maximize Your Win Rate with Trend Sniper X: Key Rules & Sess
Scalper Vault
Oleg Rodin
5 (40)
Scalper Vault is a powerful, fully-equipped trading system designed for traders who want to achieve consistency in intraday trading . This high-precision indicator serves as a complete, standalone trading system that delivers institutional-grade analysis for both Forex and Binary Options traders. PLEASE CONTACT ME AFTER PURCHASE TO GET MY TRADING TIPS PLUS A GREAT BONUS! By eliminating the guesswork and complex manual analysis, Scalper Vault allows you to focus purely on execution using easy t
Currency Strength Wizard is a very powerful indicator that provides you with all-in-one solution for successful trading. The indicator calculates the power of this or that forex pair using the data of all currencies on multiple time frames. This data is represented in a form of easy to use currency index and currency power lines which you can use to see the power of this or that currency. All you need is attach the indicator to the chart you want to trade and the indicator will show you real str
PRO Renko System
Oleg Rodin
5 (31)
PRO Renko System is a highly accurate trading system specially designed for trading RENKO charts. The ARROWS and Trend Indicators DO NOT REPAINT! The system effectively neutralizes so called market noise giving you access to accurate reversal signals. The indicator is very easy to use and has only one parameter responsible for signal generation. You can easily adapt the tool to any trading instrument of your choice and the size of the renko bar. I am always ready to provide extra support to help
SR Liquidity
Oleg Rodin
5 (2)
SR Liquidity is a trading indicator designed to reveal the hidden zones where market liquidity concentrates and price reacts most strongly. These special liquidity areas act as powerful support and resistance levels, giving you a clear map of where the market is most likely to reverse. Instead of drawing ordinary Support/Resistance lines, SR Liquidity analyzes real price behavior to detect the zones where buying and selling pressure accumulate. These are actually the pools of liquidity that driv
Zoryk Gold mt4
Reda El Koutbane
5 (3)
discount ends soon original price 69 $ ZORYK — Advanced XAUUSD Signal System for MetaTrader 4 You know the feeling. You spend time analyzing gold. You wait for the entry. You finally open the trade, and price immediately moves against you. You close too early, move the Stop Loss, or hesitate for a few seconds. Then the market reaches the exact destination you originally expected without you. The direction was not always the problem. The real problem was uncertainty. You did not know exactl
Atomic Analyst
Issam Kassas
5 (14)
Atomic Analyst — MetaTrader 4 For product questions, setup guidance, or technical support, message me directly here on MQL5. The indicator turns complex market calculations into simple visual signals, color-coded candles, trend readings, stop-loss levels, and multiple take-profit zones that traders can understand quickly and use in real market conditions. Main Trading Uses: Scalping and intraday trading: Designed for fast decision-making, clear arrows, alerts, candle colors, and structured entry
M1 Sniper
Oleg Rodin
4.97 (30)
M1 SNIPER  is an easy to use trading indicator system. It is an arrow indicator which is designed for M1 time frame. The indicator can be used as a standalone system for scalping on M1 time frame and it can be used as a part of your existing trading system. Though this trading system was designed specifically for short-term trading, it still can be helpful for all traders. This trading system can be used with any forex pair and time frame, though lower time frames are recommended from M1 up to M
SIO Oscillator: Self-Optimizing Semivariance Imbalance Oscillator Buy the indicator and get the Expert Advisor based on it for FREE. Most oscillators treat all price movement the same. SIO separates upside and downside market pressure and measures the imbalance between them, showing which side is really in control: buyers or sellers. When the imbalance reaches an extreme, SIO prints a clear signal with entry, Stop Loss and Take Profit levels. What makes SIO different is that it doesn’t rely on f
Quant Direction
Georgios Kalomoiropoulos
Quant Direction is a 3 dimensional market analysis tool. It provides a purely objective, algorithmic view of the market by calculating exact percentage-based biases across multiple dimensions simultaneously. Developed utilizing advanced AI modeling tools and subjected to thorough testing, this algorithm is engineered to read the market with unique precision. It can analyze any currency pair or financial instrument available on your platform.  Quant Direction is the ideal tool whether you are a S
Trend Lines PRO
Roman Podpora
5 (2)
TREND LINES PRO    helps understand where the market is truly changing direction. The indicator shows real trend reversals and points where major players re-enter. You see   BOS lines   Trend changes and key levels on higher timeframes — without complex settings or unnecessary noise. Signals don't repaint and remain on the chart after the bar closes. VERSION MT 5     -     Reveals its maximum potential when paired with the   RFI LEVELS PRO  indicator What the indicator shows: Real shifts   tren
AW Prime Oscillator
AW Trading Software Limited
5 (1)
A combination of two oscillators. The first one displays the entry points, the second shows the current trend . The indicator can display oscillator signals by arrows in two modes, all fast oscillator signals or signals only in the direction of the current trend. It has a multi-timeframe panel and three types of signal notifications. Benefits: Suitable for day and scalping trading Trend filtering Simple and sensitive setup Multi-timeframe panel Suitable for integration into an advisor. Works on
Hidden Cycles
Lev Vladimirovic Marushkin
5 (1)
The Only 100% Universal Tool! Stop trading against nature! This is your chance to secure the only indicator rooted in the absolute laws that govern the entire universe. Most tools guess—this one reveals the truth. Buy another toy or buy the truth. Your choice... Based on Universal Laws — NOT Some Guy’s Algorithm: Let the market adjust to the Hidden Cycles Geometry — not the other way around. Most indicators are based on a man-made formula. They often lag, fail over time, or need constant re-o
Smart Trend Trading System is a chart indicator for MetaTrader 4 that brings trend information, entry and exit signals, and price levels into one workspace. It combines 10+ trading tools into one system, including trend detection, reversal zones, smart cloud, trailing stop logic, support and resistance, candle coloring, alerts, and multi-timeframe analysis. The system is designed to help you trade different market conditions: Trending markets: Identify the main trend, detect pullbacks, follow mo
Neo Wave PRO
Nikolay Raykov
5 (1)
Price & Time Market Structure Indicator A professional market structure tool that analyzes waves through both price and time — not price alone. Main Description NeoWave PRO is a professional market structure indicator for MetaTrader 4 designed for traders who want to move beyond traditional one-dimensional wave tools such as ZigZag, swing indicators, and basic high/low systems. Most wave indicators analyze only one thing: Price. But a real market wave is not only a price movement. A true wave de

PZ Turning Points MT4
PZ TRADING SLU
1 (1)
Identify key turning points with reliable fractal analysis This indicator examines the price structure of fractals of different periods to determine possible reversal points in the market, providing timing to positional traders that already have a fundamental or technical valuation model. Unlike its younger brother, Reversal Fractals , this indicator won't miss reversals because of the period selected, and will find reversal fractals on a zig-zag fashion, ignoring those reversals which do not
CRT Multi-Timeframe Market Structure & Liquidity Sweep Indicator Non-Repainting | Multi-Asset | MT5 Version Available MT5 Version:   https://www.mql5.com/en/market/product/162075 Full User Guide — explains what each feature does and why:   https://www.mql5.com/en/blogs/post/767525 Quick Start User Guide  — explains how to configure and in what order:  https://www.mql5.com/en/blogs/post/767540 Indicator Overview CRT Ghost Candle HTF Fractal is a complete institutional-grade market structure too
Neuro Poseidon MT4
Daria Rezueva
4.74 (46)
Neuro Poseidon is a new indicator by Daria Rezueva. It combines precise trading signals with adaptive TP/SL levels - creating best possible trades as a result! Message me and get  Neuro Poseidon Assistant  as a gift to automize your trading process! What makes it stand out? 1. Proven profitability on all assets and timeframes 2. Only confirmed BUY and SELL signals present on the chart 3. Adaptive TP & SL levels generated by the software for each trade 4. Easy to understand - suitable for all
Non repaint MT4
Yan Zhen Du
5 (1)
This is a professional chart indicator designed for traders focused on stability and clear price action. It helps filter market noise and provides clear visual entry and exit zones for your trading decisions. Core Features: Strictly Non-Repainting: The system is built with strict non-repaint logic. What you see on the chart is the true historical performance. Confirmed Signals: Signals are triggered and confirmed only after the candle closes . Once a trading arrow appears on a closed candle, it
Forex Breath System is a trend based trading system which can be used with any market. You can use this system with currencies, metals, commodities, indices, crypto and even stocks. It can also be used with any time frame. The system is universal. It shows trend and provides arrow signals with the trend. The indicator can also provide you with a special type of alerts when the signals appear in the direction of the trend which makes trend trading an easy task. The indicator is very easy to use a
Advanced Supply Demand
Bernhard Schweigert
4.91 (302)
Trading Special – 30% OFF Best Solution for any Newbie or Expert Trader! This indicator is a unique, high quality and affordable trading tool because we have incorporated a number of proprietary features and a new formula. With this update, you will be able to show double timeframe zones. You will not only be able to show a higher TF but to show both, the chart TF, PLUS the higher TF: SHOWING NESTED ZONES. All Supply Demand traders will love it. :) Important Information Revealed Maximize the pot
Super Signal – Skyblade Edition Professional No-Repaint / No-Lag Trend Signal System with Exceptional Win Rate | For MT4 / MT5 It works best on lower timeframes, such as 1-minute, 5-minute, and 15-minute charts. Core Features: Super Signal – Skyblade Edition is a smart signal system designed specifically for trend trading. It applies a multi-layered confirmation mechanism to detect only strong, directional moves supported by real momentum. This system does not attempt to predict tops or bottoms
Liquidity Scalper System: a liquidity-based trading system in indicator form. Most indicators only show an arrow, and the trader then has to decide where the stop goes, where the target is and whether the signal can be trusted at all. Liquidity Scalper System covers the full trade cycle: it finds liquidity pools, gives a signal when they are broken, immediately calculates Entry, Stop Loss and three targets, and shows statistics and out-of-sample test results on the panel. The system picks its o
Gann Made Easy
Oleg Rodin
4.84 (174)
Gann Made Easy is a professional and easy to use Forex trading system which is based on the best principles of trading using the theory of W.D. Gann. The indicator provides accurate BUY and SELL signals including Stop Loss and Take Profit levels. You can trade even on the go using PUSH notifications. PLEASE CONTACT ME AFTER PURCHASE TO GET TRADING  INSTRUCTIONS   AND GREAT EXTRA INDICATORS  FOR FREE! Probably you already heard about the Gann trading methods before. Usually the Gann theory is a
True Direction Oscillator
Muhammad Elbermawi
4.85 (364)
Or (TDO)  which is an index that measures the price rate of change using the principle of " Pure Momentum ". When a security price advances from 10 to 15 then the price rate of change is 150% but when it declines back from 15 to 10 then the price rate of change is 33.3% only. That is why technical analysis indicators like "Price Rate of Change" (ROC) or "Momentum" give higher readings for ascending price movements than those given to descending ones. TDO fixes this problem to help traders at rea
GoldRush Trend Arrow Signal V1.6 The GoldRush Trend Arrow Signal indicator V1.6 continues to provide precise, real-time trend analysis tailored for high-speed, short-term scalpers in XAU/USD , but it now has additional features and improved efficiency and reliability. Built specifically for the 1-minute time frame, this tool displays directional arrows for clear entry points, allowing scalpers to navigate volatile market conditions with confidence. The indicator consists of PRIMARY and SECONDARY
Break and Retest Hunter MT4 is a powerful MetaTrader 5 indicator designed to automatically identify support and resistance levels, breakout structures, and potential retest opportunities in real time. Bonus Indicator: After purchasing Break and Retest Hunter , contact me to receive Trade Indicator Assistant EA completely free as a bonus utility. $65 for the next 10 copies . Next price is $120.  Combining adaptive market analysis, clear BUY/SELL signals, Fibonacci-based profit targets, and a pre
Trading Special –40% OFF Best Solution for any Newbie or Expert Trader! This Indicator is a unique, high quality and affordable trading tool because we have incorporated a number of proprietary features and a new formula. With only ONE chart you can read Currency Strength for 28 Forex pairs! Imagine how your trading will improve because you are able to pinpoint the exact trigger point of a new trend or scalping opportunity? User manual: click here Looking for the MT5 version? Click here: https:/
Trading Special – 30% OFF Best Solution for any Newbie or Expert Trader! This dashboard software is working on 28 currency pairs plus one. It is based on 2 of our main indicators (Advanced Currency Strength 28 and Advanced Currency Impulse). It gives a great overview of the entire Forex market plus Gold or 1 indices. It shows Advanced Currency Strength values, currency speed of movement and signals for 28 Forex pairs in all (9) timeframes. Imagine how your trading will improve when you can watch
TDI Multi Timeframe Scanner: This Dashboard indicator uses the TDI (Trader's Dynamic Index) Indicator to find best trades. Read detailed How to Use Guide: https://www.mql5.com/en/blogs/post/758252 Extra indicators also available in above post. Checks for: - SharkFin Pattern Free indicator for SharkFin: https://www.mql5.com/en/market/product/42405/ - TDI Trend: Strong/Weak Trend Up/Down - TDI Signal: Strong/Medium/Weak Signal for Buy/Sell - Consolidation - Overbought/Oversold - Volatility Ban
More from author
OrderFlux – Orderflow Footprint Chart, Volume Profile & Market Profile Indicator for MetaTrader 5 OrderFlux is an order flow footprint indicator for MetaTrader 5 that explains itself. It opens the single candle and shows what happens inside it: the volume traded at every price level, split into aggressive buyers and aggressive sellers. From the ticks it builds a complete footprint chart in real time with delta, imbalance, absorption, volume profile, market profile (TPO), VWAP, cumulative delta (
Smart RR Pro
Simon Draxler
5 (2)
DRX Smart Risk - Visual Trade Planner Utility DRX Smart Risk is a chart overlay tool for MetaTrader 5 designed to assist traders with risk management and position sizing calculations. Unlike standard chart lines, this utility creates an interactive interface that allows users to visually plan Entry, Stop Loss, and Take Profit levels while automatically calculating financial metrics. Important Note This product is a technical indicator/utility for planning and calculation purposes. It visualizes
FREE
Get crystal-clear market structure in seconds – without manual drawing! The HTF Auto Support & Resistance Indicator automatically marks the key support and resistance levels directly on your chart. These levels are based on a higher timeframe (HTF), making them far more reliable than random short-term lines. Main Features: Automatic detection of the strongest support & resistance zones Multi-timeframe analysis: choose a higher timeframe for more precise levels Clearly structured zones with colo
FREE
DRX SMC Indicator for MT5 – Ultimate Smart Money Concepts & ICT Trading Indicator Master Smart Money Concepts (SMC) and ICT strategies with total clarity on MetaTrader 5. DRX SMC automatically detects and draws high-probability market structure, institutional order blocks, fair value gaps (FVG), liquidity sweeps, trend channels, multi-timeframe support and resistance, premium/discount Fibonacci zones, and the volume-weighted average price (VWAP) right on your chart. When multiple technical confl
Smart RR Pro Drx
Simon Draxler
5 (1)
SMART RR  is a utility designed to assist with risk management and trade execution on MetaTrader 5. It provides visual tools to calculate lot sizes, monitor risk-reward ratios, and place orders directly from the chart. This tool focuses on transparent position sizing based on account balance and stop-loss distance, taking real-time market spread into consideration. Key Features Spread-Aware Calculation: The Risk-Reward Ratio (R:R) incorporates the current ask/bid spread to provide realistic proj
FREE
ScalpingThink
Simon Draxler
ScalpingThink is a bidirectional scalping system for short-term trading on MetaTrader 5. Positions are opened individually and managed with a fixed stop-loss and an optional virtual trailing stop. Signal: Link Guide: Link Risk Management No grid, no martingale; each position is opened individually Fixed stop-loss and optional virtual trailing stop Several trailing-stop variants to choose from Safety buffer to limit margin usage Time filter and spread filter for entries Recommended Markets and Se
Get crystal-clear market structure in seconds – without manual drawing! The HTF Auto Support & Resistance Indicator automatically marks the key support and resistance levels directly on your chart. These levels are based on a higher timeframe (HTF), making them far more reliable than random short-term lines. Main Features: Automatic detection of the strongest support & resistance zones Multi-timeframe analysis: choose a higher timeframe for more precise levels Clearly structured zones with color
FREE
Spread Monitor Pro
Simon Draxler
5 (1)
DRX SPREAD MONITOR is a professional utility designed to visualize and analyze broker spreads in real-time. It helps traders identify hidden costs caused by spread widening during news events, rollovers, or low liquidity sessions. This tool is essential for Scalpers and Gold traders who need to ensure execution quality and avoid entering trades when trading costs are statistically too high. Key Features Real-Time Histogram: Displays the spread history in a separate window with color-coding for N
FREE
DRX Market Profile TPO — classic Market Profile (TPO chart) for MetaTrader 5 DRX Market Profile TPO draws real Time Price Opportunity profiles directly on your MT5 chart: TPO letters, Point of Control (POC), Value Area High and Value Area Low (VAH / VAL), Initial Balance, single prints and naked POCs — for every session, on any symbol. Version 5 is a complete rebuild: a lag-free canvas engine instead of thousands of chart objects, correct TPO math, exchange session presets with daylight saving t
Margincall Lines
Simon Draxler
5 (1)
Program Features 1. Calculation of Margin Call and Liquidation Prices Monitoring all open positions: The program continuously analyzes all open positions on the trading account. Determining critical price levels: Margin Call Price: The price at which additional funds must be deposited to keep positions open. If this does not occur, liquidation follows. Liquidation Price: The price at which positions are automatically closed by the broker to prevent further losses. 2. Display of Prices on the Ch
FREE
AlphaWave4
Simon Draxler
AlphaWave – Non-Repainting Trend Indicator with Buy/Sell Signals and Alerts for MT5 AlphaWave is a trend indicator for MetaTrader 5 that shows you the trend direction at a glance and gives you a clear BUY or SELL signal when the trend changes. It turns price into one smooth wave: cyan when the trend is up, coral when it is down. You see immediately which side of the market you should be on, on any symbol and any timeframe. AlphaWave is built for swing trading and trend following. Instead of reac
DRX Smart RR for MT5 – Trade Manager, Lot Size Calculator and Prop Firm Risk Guard: Visual Risk Reward Planner, Daily Loss Limit, Max Drawdown Lock, News Filter, Trailing Stop and Trade Panel Know your risk before you click. DRX Smart RR is a trade manager for manual traders on MetaTrader 5. Draw the trade on your chart, see the money at the stop and at the target, get the correct lot size, and send it with one held button. After that, manage it with one click, and let a hard risk guard stop you
AlphaWave
Simon Draxler
5 (1)
DRX AlphaWave: Simple Trend Indicator for Swing Trading on MT5 See the trend. Stay on the right side of it. Swing trading does not have to be complicated. DRX AlphaWave is a non-repainting MT5 trend indicator that turns a busy chart into one calm wave. Cyan means up. Coral means down. No overloaded chart, no long setup, no guessing which way the market is moving. It is built for traders who want one clear picture and want to stay with the direction of the trend, without watching every small move
DrawPad
Simon Draxler
DRX DrawPad: Chart Drawing Tool and Risk/Reward Trade Planner for MetaTrader 5 DRX DrawPad turns MetaTrader 5 into a complete visual analysis workspace. Draw, measure and plan trades directly on your MT5 chart, quickly and precisely, without any external software. Freehand drawing, trendlines, arrows, Fibonacci, zones, text, a measure tape and a Long/Short position planner with automatic lot size, all in one slim dark panel that you can dock to any edge of the chart. It runs as an indicator, so
DRX Smart RR for MT5 – Trade Manager, Lot Size Calculator and Prop Firm Risk Guard: Visual Risk Reward Planner, Daily Loss Limit, Max Drawdown Lock, News Filter, Trailing Stop and Trade Panel Know your risk before you click. DRX Smart RR is a trade manager for manual traders on MetaTrader 5. Draw the trade on your chart, see the money at the stop and at the target, get the correct lot size, and send it with one held button. After that, manage it with one click, and let a hard risk guard stop you
Filter:
No reviews
Reply to review