Dual Symbol Bars
- Utilities
- Version: 1.0

Dual Symbol Bars
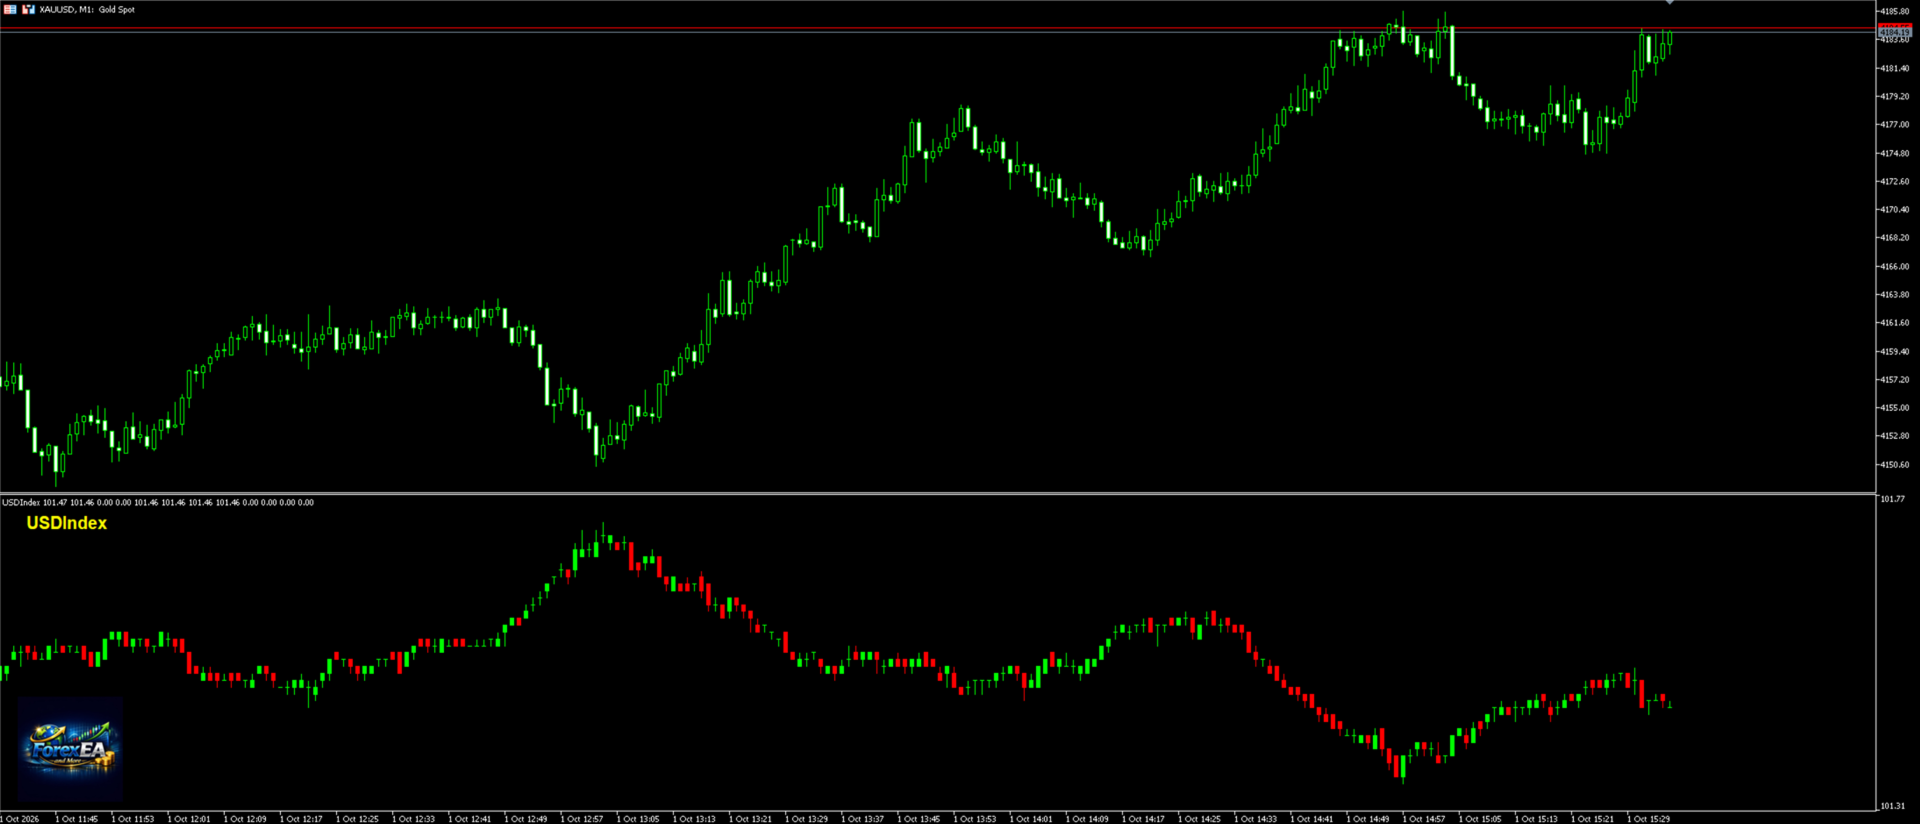
draws a second symbol as candles in its own subwindow, on the same timeframe and time axis as the chart.
Shows any second symbol as candles in a separate window, aligned to the chart timeframe. Useful for Gold next to the Dollar Index, or any other pair your broker offers.
Dual Symbol Bars adds a second candle chart under the main chart. Both windows use the same timeframe and the same bar times, so you can compare two instruments without opening another chart.
Example: XAUUSD on the main chart and the Dollar Index in the pane. The symbol is not fixed. Type the exact broker name in Symbol to show in the pane. If that name is missing, the indicator also tries common Dollar Index names (USDIndex, USDX, DXY, and similar).
Each bar is matched by open time. A bullish bar (close at or above open) uses the bull colours. A bearish bar uses the bear colours. Wick, body, and border can be set separately. The symbol name is drawn in the pane. If the name is not on the server, the label shows that it was not found.
Questions and updates: MQL5 group https://www.mql5.com/en/messages/035909005de4dc01
What you can set:
- Symbol to show in the pane (exact broker name)
- Bullish wick, body, and border colour
- Bearish wick, body, and border colour
- Wick width
- Label colour and font size
How to use:
- Attach the indicator to any chart.
- Enter the second symbol exactly as it appears in Market Watch.
- If nothing is drawn, open View → Symbols, find the instrument, and show it. The pane stays empty until that symbol has history.
- Gaps mean the second symbol has no bar at that chart time (session, holiday, or history not downloaded yet).
This is a display tool only. It does not open, close, or manage trades, and it is not a signal or a forecast.
Past appearance of any symbol is not a guide to future prices. Trading involves risk of loss. This product is not financial advice.