High Timeframe Structure Lens
- Indicators
-
Shipra Gupta
 I’m Shipra Gupta, a trader and quantitative strategy developer with a strong background in mathematics, economics, and algorithmic trading systems. Over the years, I’ve worked extensively across forex, gold, indices, commodities, and crypto markets, focusing on building data-driven trading
- Version: 1.0
HTF Structure Lens for MetaTrader 5
Overview
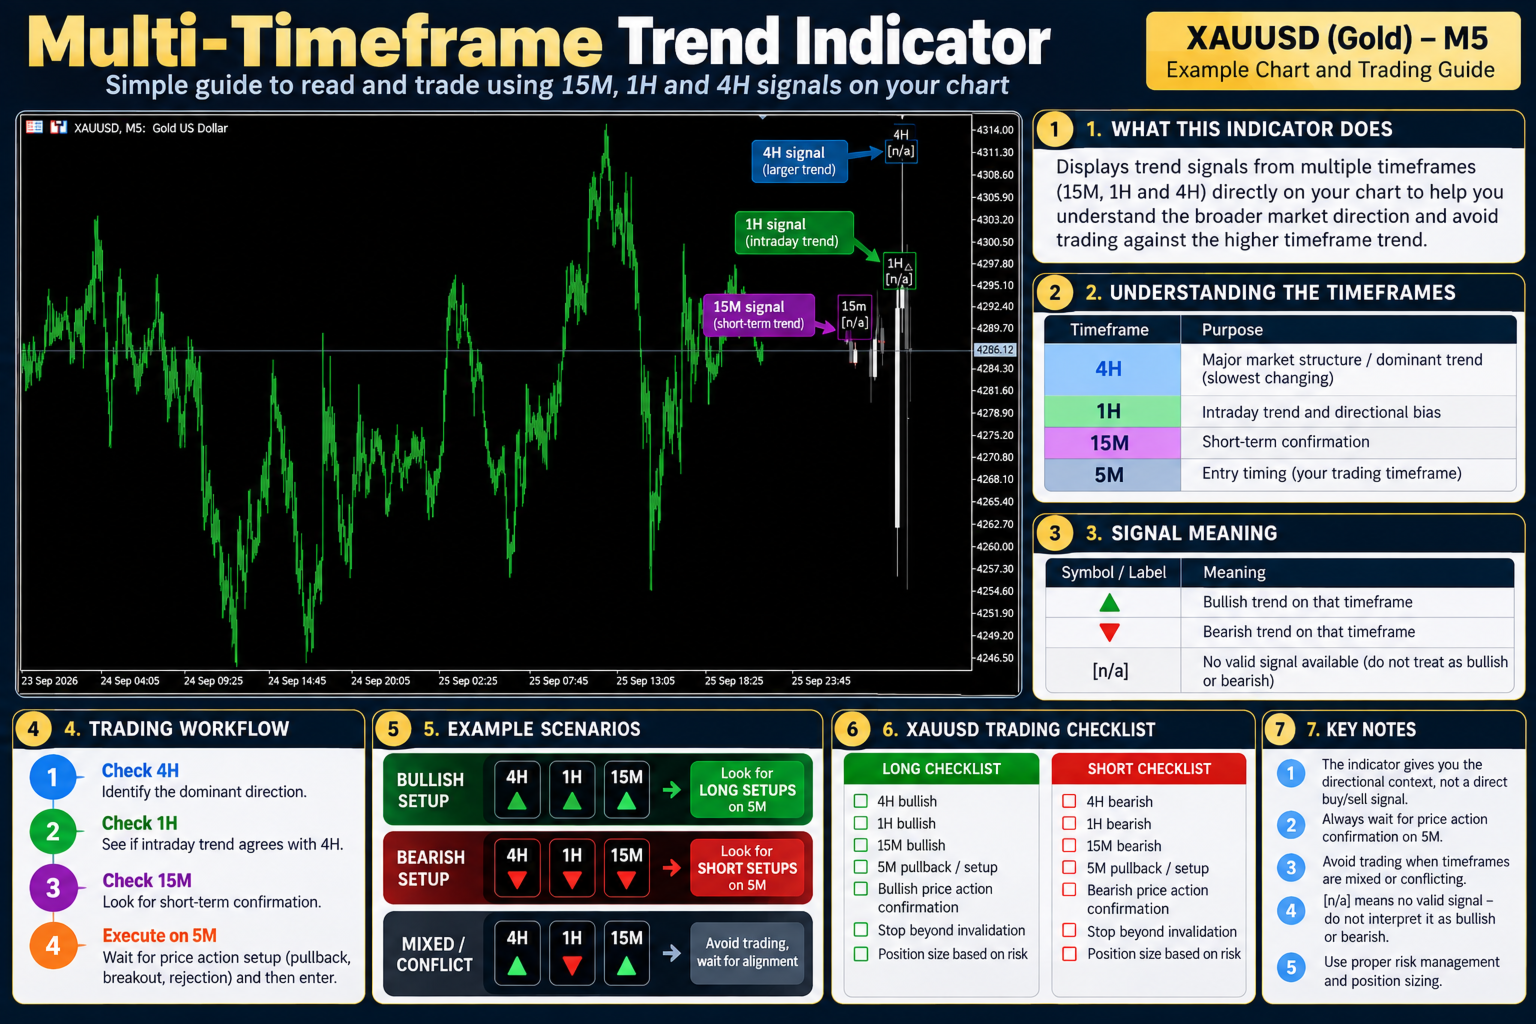
HTF Structure Lens is a multi-timeframe market structure indicator for MetaTrader 5. It displays higher-timeframe candles in the right-side chart space, allowing traders to analyse multiple timeframes without switching away from their execution chart.
Configure up to six independent timeframe panels to monitor higher-timeframe price action, swing levels, Fair Value Gaps (FVGs), and equilibrium levels from a single chart.
MT5 Expert Advisor Collection
Explore automated systems built for Gold & Bitcoin, covering breakout, scalping, momentum and multi-horizon strategies.
Gold: Range Striker | Gold Flash | Vortex Pro | Neural Scalper | Titan Forge | Quantum Pulse | GoldGridBreakout | Gold Micro Account
Bitcoin: BTC Strike | Alpha Vault | Edge Pilot
Key Features
-
Up to six configurable higher-timeframe candle panels.
-
Support for MT5 timeframes, including M15, H1, H4, D1, and W1.
-
Candles displayed in the right-side chart margin.
-
Configurable historical candle count.
-
Swing High and Swing Low detection.
-
Confirmed and developing structural levels.
-
Fair Value Gap (FVG) detection.
-
50% Equilibrium levels.
-
Premium and Discount range context.
-
Higher-timeframe candle countdown timers.
-
Optional candle timestamps and labels.
-
Customisable candle, swing, FVG, and equilibrium colours.
-
Adjustable panel offset, candle width, and spacing.
How It Works
HTF Structure Lens retrieves OHLC data from selected timeframes and renders the corresponding candles in the chart's right-side space.
It then identifies structural swing levels, detects Fair Value Gaps, and displays equilibrium references to help traders assess price action across multiple timeframes.
Each timeframe slot can be configured independently, allowing the panel layout to match your analysis workflow.
Multi-Timeframe Structure Analysis
1. Higher-Timeframe Candles
Display selected timeframes alongside your active execution chart. Observe the broader price context without repeatedly changing chart periods.
2. Swing Highs and Swing Lows
Monitor detected structural highs and lows across the selected timeframes. These levels can provide reference points for analysing price swings and potential liquidity areas.
3. Fair Value Gaps
Display detected Fair Value Gaps to identify price areas that may be relevant to your price-action analysis.
4. Equilibrium and Premium/Discount
Use the 50% equilibrium level to assess price position within the relevant range. Premium and Discount references provide additional context for evaluating price location.
5. Candle Countdown and Timestamps
Optional timers show the remaining time for higher-timeframe candles, while timestamps help identify the corresponding candle periods.
Example Setups
Intraday trading
Keep M15 as your execution chart and display H1, H4, and D1 panels for additional context.
Scalping
Use M5 as your execution chart while monitoring M15, H1, H4, D1, and W1.
These are example configurations. Choose timeframes according to your strategy and trading horizon.
Main Input Settings
| Setting Group | Available Controls |
|---|---|
| Timeframes | Six independent timeframe slots |
| Candles | Historical candle count |
| Layout | Panel offset, candle spacing, group spacing, and candle width |
| Display | Labels, timers, timestamps, and colours |
| Market Structure | Swing and structural-level controls |
| SMC Tools | FVG and equilibrium controls |
Premium/Discount visualisation and other display options can be configured where supported by the indicator's inputs.
How to Use
-
Attach HTF Structure Lens to your preferred MT5 chart.
-
Select the higher timeframes you want to monitor.
-
Enable or disable individual timeframe panels.
-
Adjust candle count, panel spacing, and width to fit your chart.
-
Review higher-timeframe candles and structural swing levels.
-
Use FVGs and equilibrium levels as additional analytical references.
-
Compare the higher-timeframe context with your execution timeframe before making a trading decision.
Suitable For
-
Multi-timeframe market analysis.
-
Smart Money Concepts (SMC).
-
Price action and market structure analysis.
-
Scalping and intraday trading.
-
Swing trading.
-
Traders who prefer viewing higher-timeframe candles without switching charts.
Important Notes
HTF Structure Lens is an analytical indicator. It does not execute trades or guarantee that identified swing levels, Fair Value Gaps, or equilibrium areas will influence future price movement.
Developing candles and structural levels may change as new price data becomes available. Use the indicator alongside your own analysis and appropriate risk management.
Analyse multiple timeframes. Keep your execution chart in focus.