Dualperiodfilter
- Indicators
- Version: 1.10

Dual Period Filter — Adaptive Coppock Curve for MT5
Overview
The Coppock Curve is built from the sum of a long and a short rate of change, smoothed afterwards, and is used to observe the direction and strength of medium-term momentum. This indicator extends the classic calculation in two ways.
First, the price source passes through an optional adaptive filter before the momentum is calculated. Nine filter types are available: None, SMA, EMA, RMA, Double WMA, Triple VWMA, HMA, LLAMA and Kalman. Filtering the source first suppresses noise, so the resulting curve is smoother.
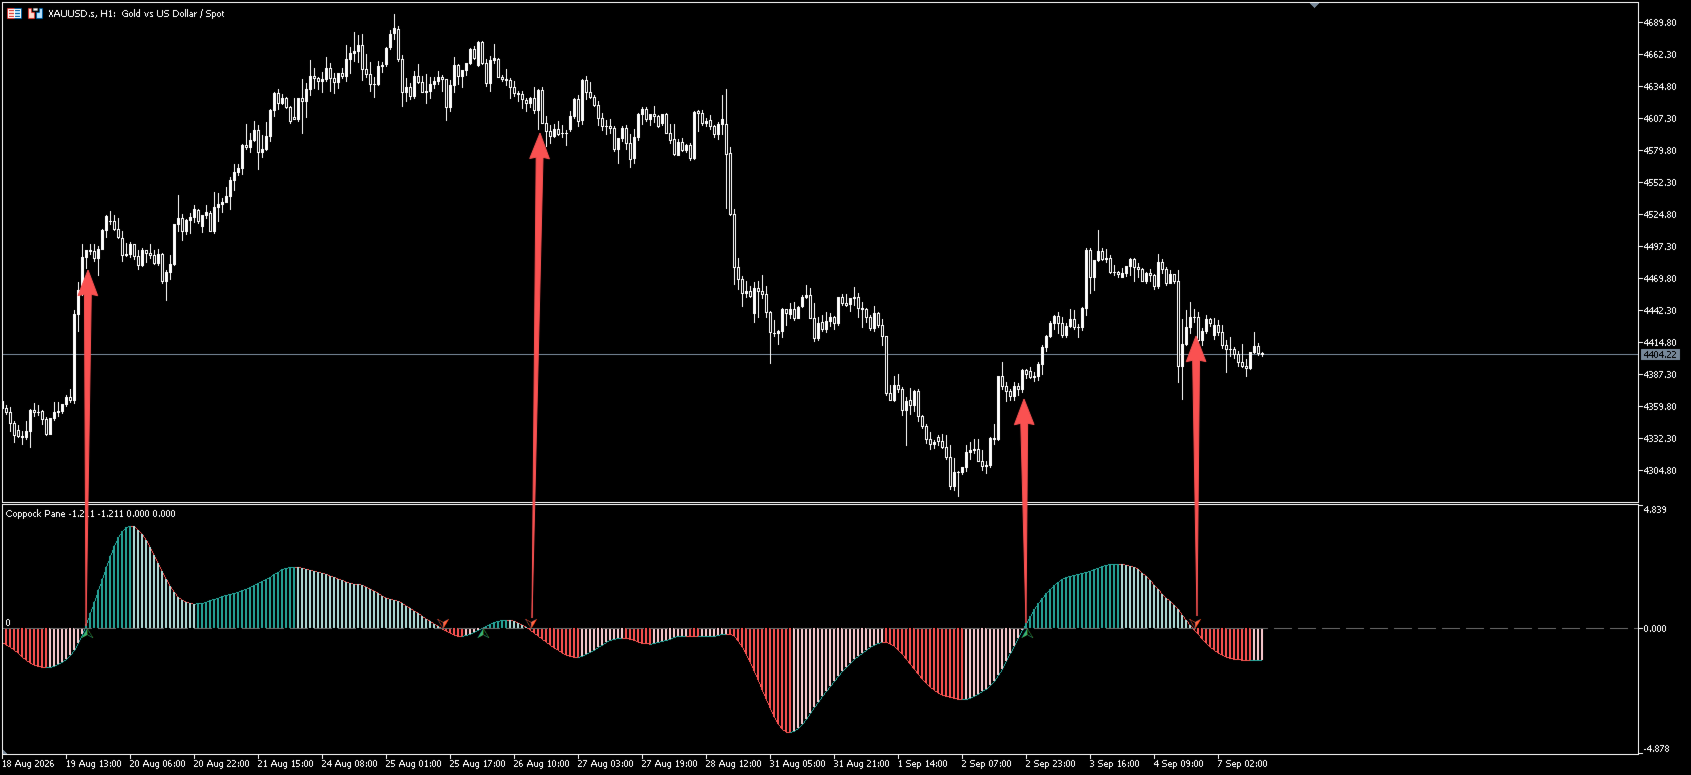
Second, the result is presented in three visual forms at once: a colored curve, a four-state histogram, and zero-line cross arrows. Direction, strength and turning points are visible in a single subwindow.
The indicator is plotted in a separate window and works on any symbol and any timeframe, including Forex, metals, indices and crypto CFDs. All values on closed bars are fixed and are not repainted.
What You See On The Chart
Coppock curve
The line is drawn in the bullish color while rising, in the bearish color while falling, and in the neutral color when flat. The color reflects the direction of the curve only and is not a trading recommendation.
Four-state histogram
Four colors describe the momentum state relative to the zero line:
- Above zero and rising: bullish momentum is relatively strong
- Above zero but falling: bullish momentum is weakening
- Below zero but rising: bearish momentum is weakening
- Below zero and falling: bearish momentum is relatively strong
The change between the light and dark shades on the same side helps to see whether momentum is building up or fading out.
Zero-line cross arrows
An up arrow is placed below the zero line when the curve crosses it from below. A down arrow is placed above the zero line when the curve crosses it from above. The distance from the zero line is controlled by the offset parameter and can be adjusted for symbols with a larger value range.
Zero reference line
A dashed level marks zero, the border between positive and negative momentum.
Input Parameters
Core Settings
Parameter | Default | Description |
|---|---|---|
Source price | Close | Price used for the calculation: open, high, low, median, typical or weighted |
Long ROC length | 14 | Lookback period of the long rate of change |
Short ROC length | 11 | Lookback period of the short rate of change |
WMA smoothing length | 10 | Weighted smoothing length applied to the ROC sum |
Filters
Parameter | Default | Description |
|---|---|---|
Adaptive filter | EMA | Source pre-processing: None, SMA, EMA, RMA, Double WMA, Triple VWMA, HMA, LLAMA, Kalman |
Adaptive filter length | 20 | Filter length. Higher values give a smoother and slower curve |
How to choose the filter type: use None when no smoothing is wanted, EMA or RMA for a faster response, HMA or Double WMA for extra smoothing, Triple VWMA when volume weighting matters, and Kalman for a balance on noisy symbols.
Visuals
Parameter | Default | Description |
|---|---|---|
Show Coppock line | true | Display the curve |
Show histogram | true | Display the histogram |
Show bull/bear cross arrows | true | Display the zero-line cross arrows |
Signal arrows offset | 0.2 | Distance of the arrows from the zero line |
How To Use
The following are common ways to work with the indicator. They are provided for your own testing and are not trading advice.
- Zero-line crosses: a cross from below shows momentum turning from negative to positive, a cross from above shows the opposite. Combine it with price structure, support and resistance.
- Histogram color changes: on the same side of the zero line, a shift from the dark to the light shade shows that momentum in the current direction is fading, which is often watched near the end of a move.
- Curve and histogram alignment: when both show the same direction and the same color group, the momentum reading is more consistent.
- Several instances: load the indicator more than once with different filter types or lengths and compare the fast and slow readings.
- Timeframe: the Coppock Curve is traditionally applied to monthly and weekly charts. On daily or H4 charts, larger ROC and filter lengths are usually more suitable.
Installation
- Copy the indicator file into the MQL5/Indicators folder of the terminal data directory.
- Refresh the Navigator, or restart the terminal.
- Attach the indicator to a chart; it appears in a separate subwindow.
- Save your settings as a template for quick reuse.
FAQ
Nothing is plotted after attaching
There is not enough history. The indicator needs at least the WMA length plus the longest ROC length plus the filter length of bars. Load more history on the chart.
The curve starts with a gap
That is the warm-up area and is normal. Values appear once enough bars are available.
The arrows are hard to see
The default offset is 0.2. On symbols with a wider value range the arrows sit close to the zero line, so increase Signal arrows offset.
I only want one of the plots
Switch the corresponding option in the Visuals group to false. The curve alone, or the histogram alone, can be kept.
Risk Disclaimer
This indicator is an analytical tool for technical analysis only. It does not place trades and does not constitute investment advice or any promise of profit. Trading financial markets involves risk, and all decisions and their results remain the sole responsibility of the user. Past behavior does not guarantee future results.