TM Price Stretch Map
- Indicators
-
Ramandeep Singh
 I am an algorithmic trader, technical analyst and MT5 tool developer focused on Gold (XAUUSD), Silver and Forex. I have applied Elliott Wave analysis in live markets since 2020, supported by market structure, trendline analysis, momentum, volatility and trading psychology.
 - Version: 1.10
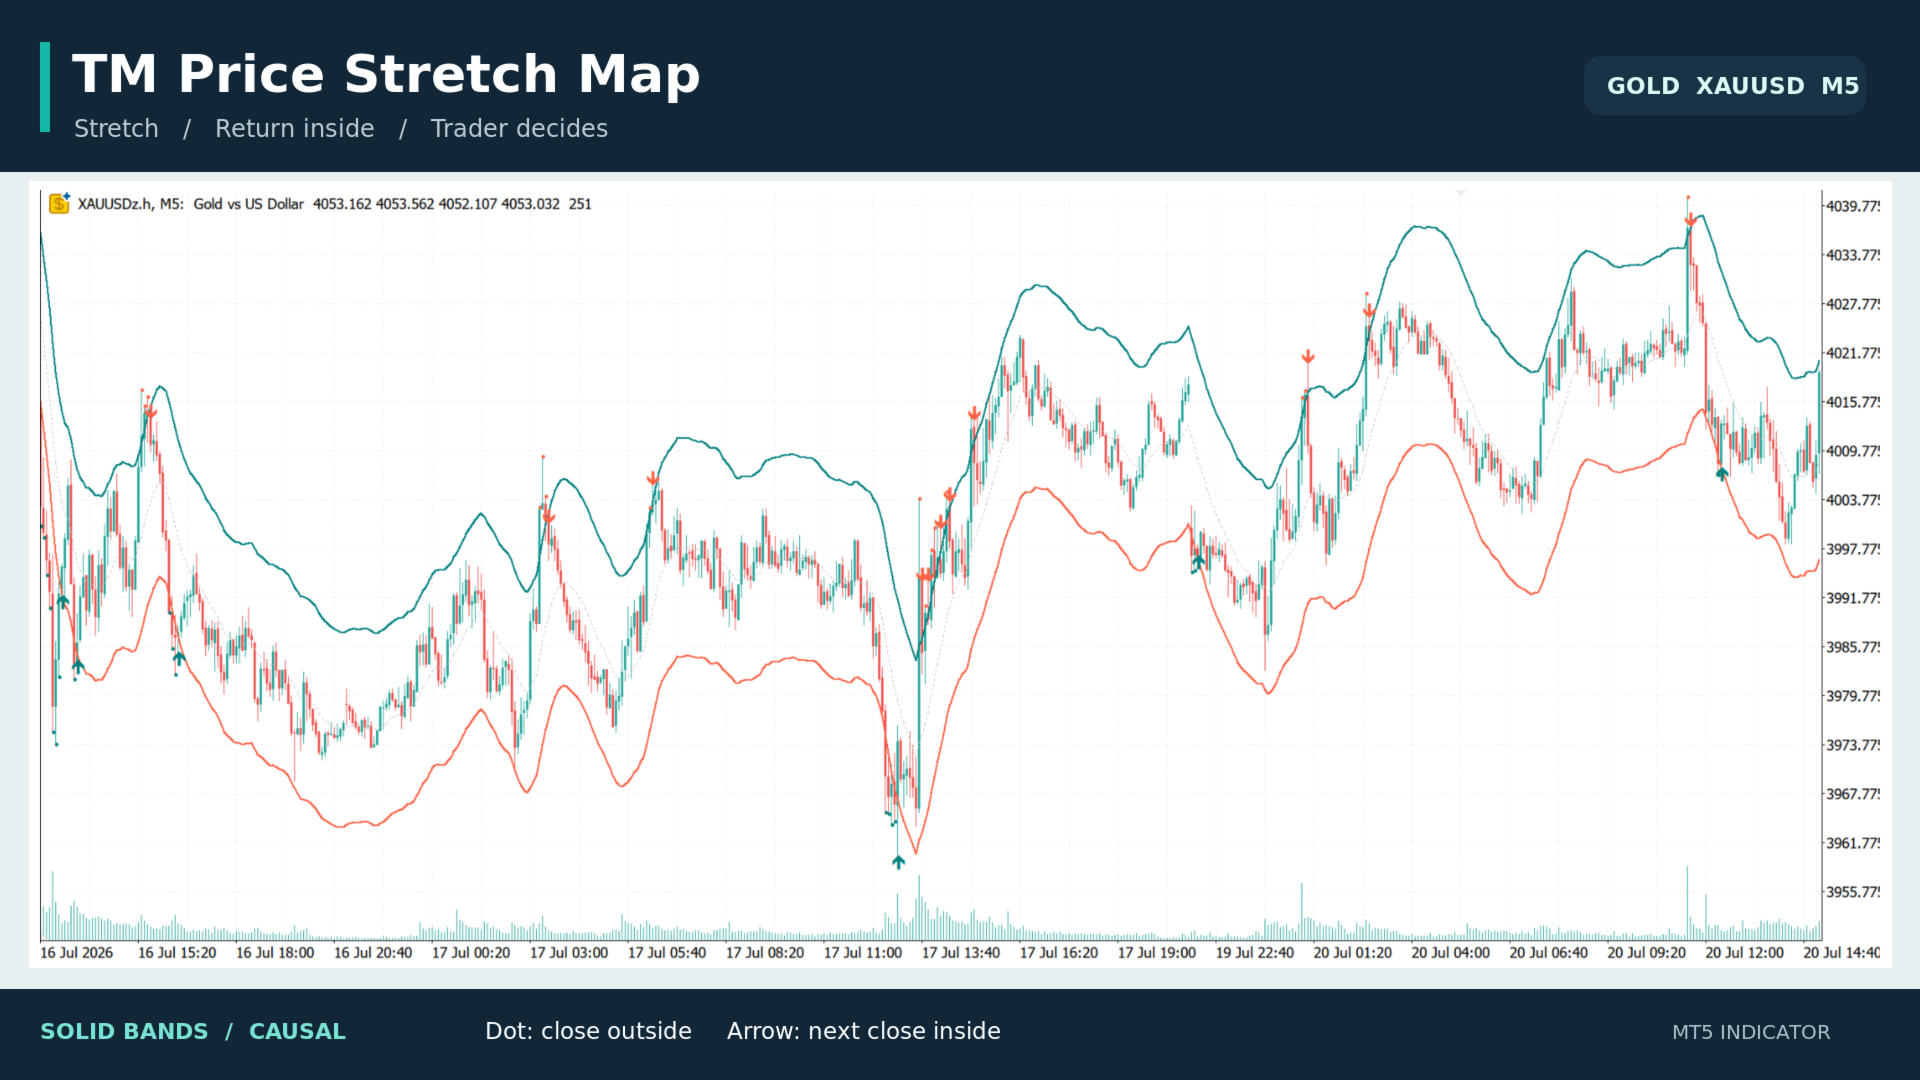
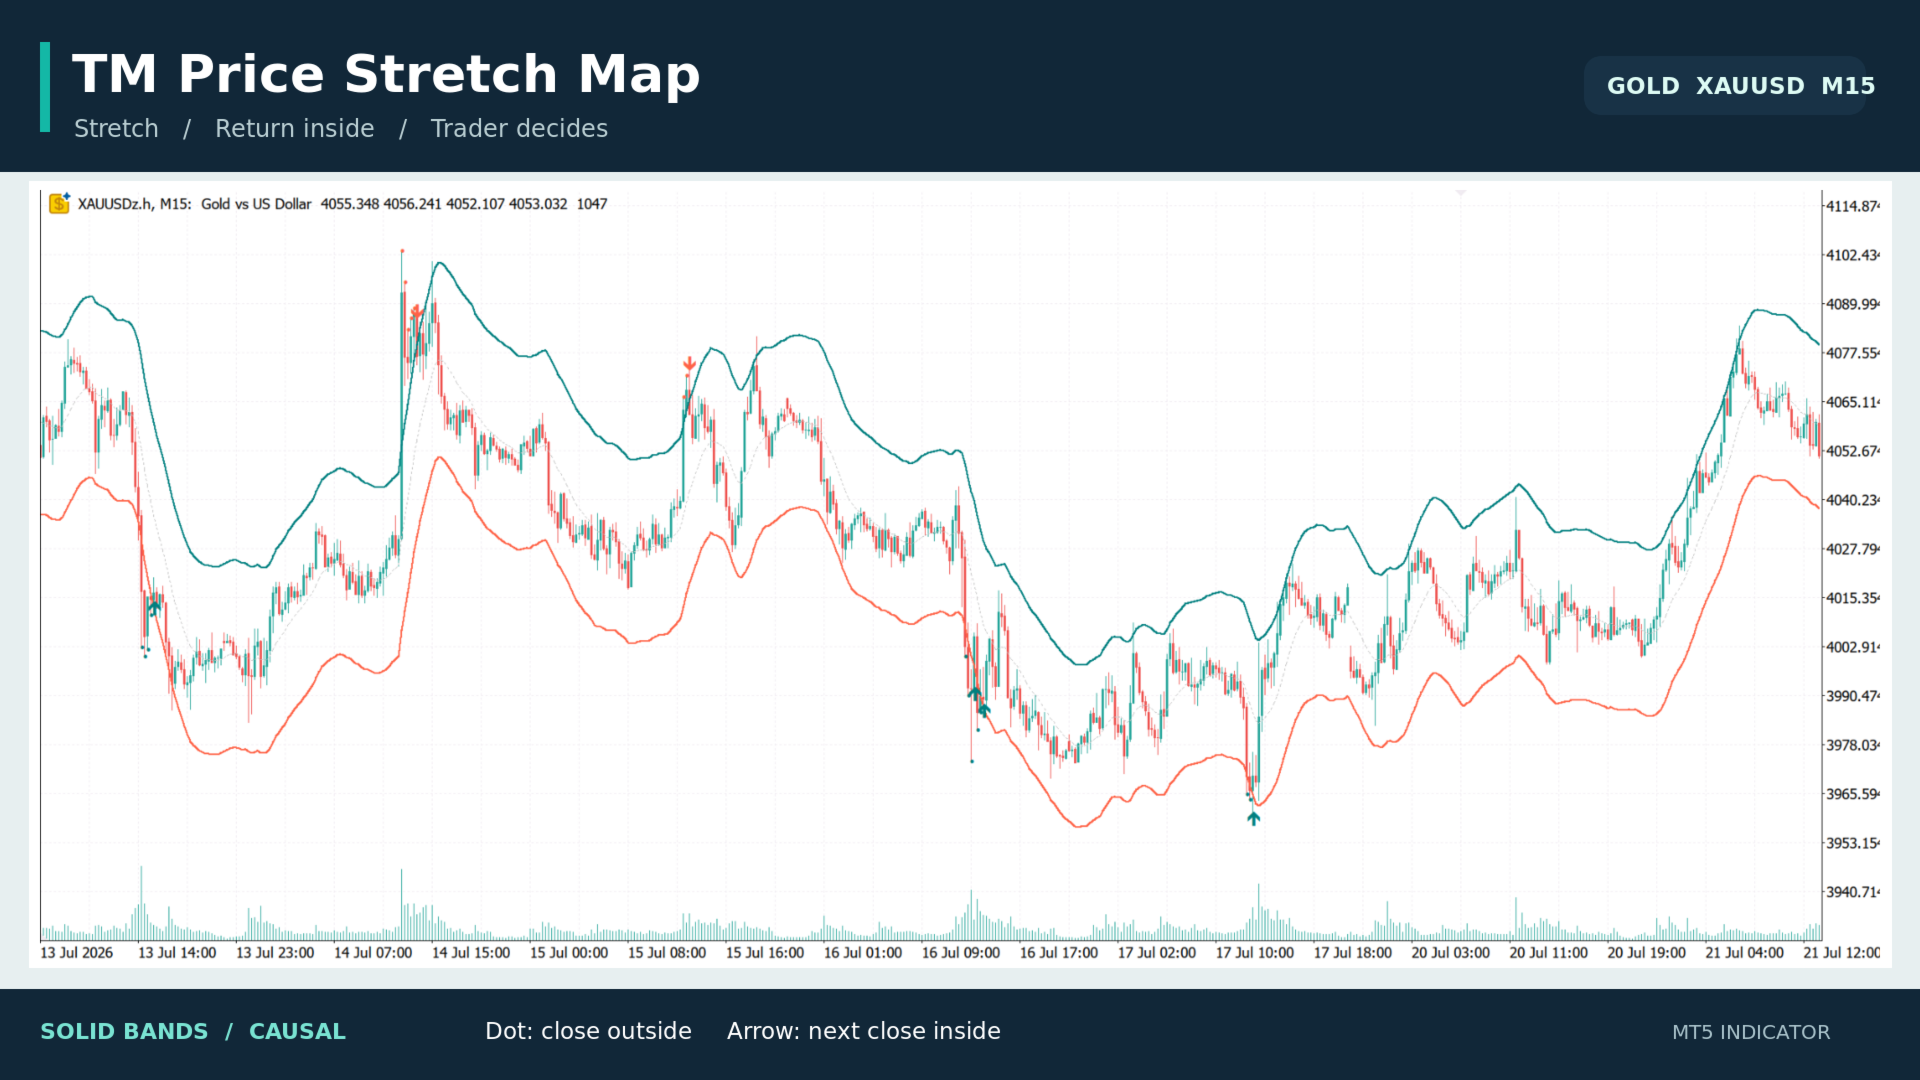
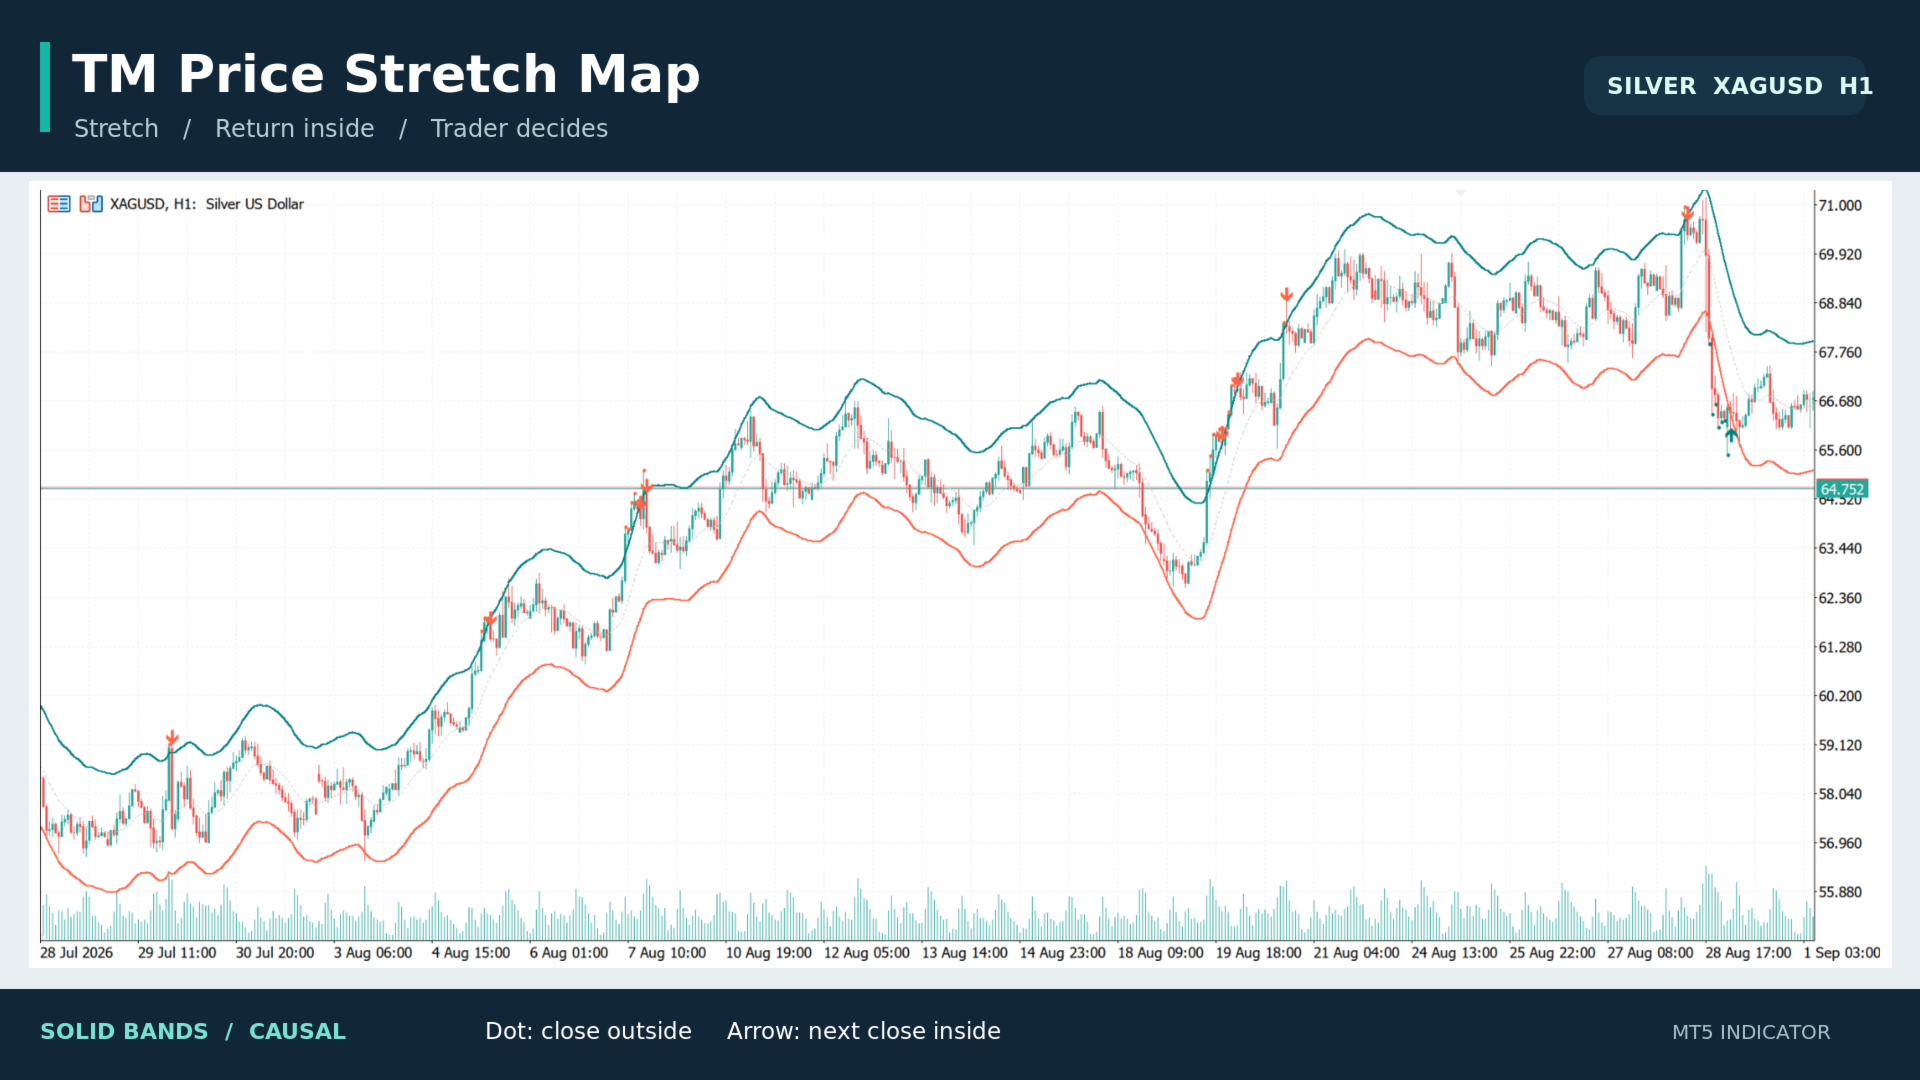
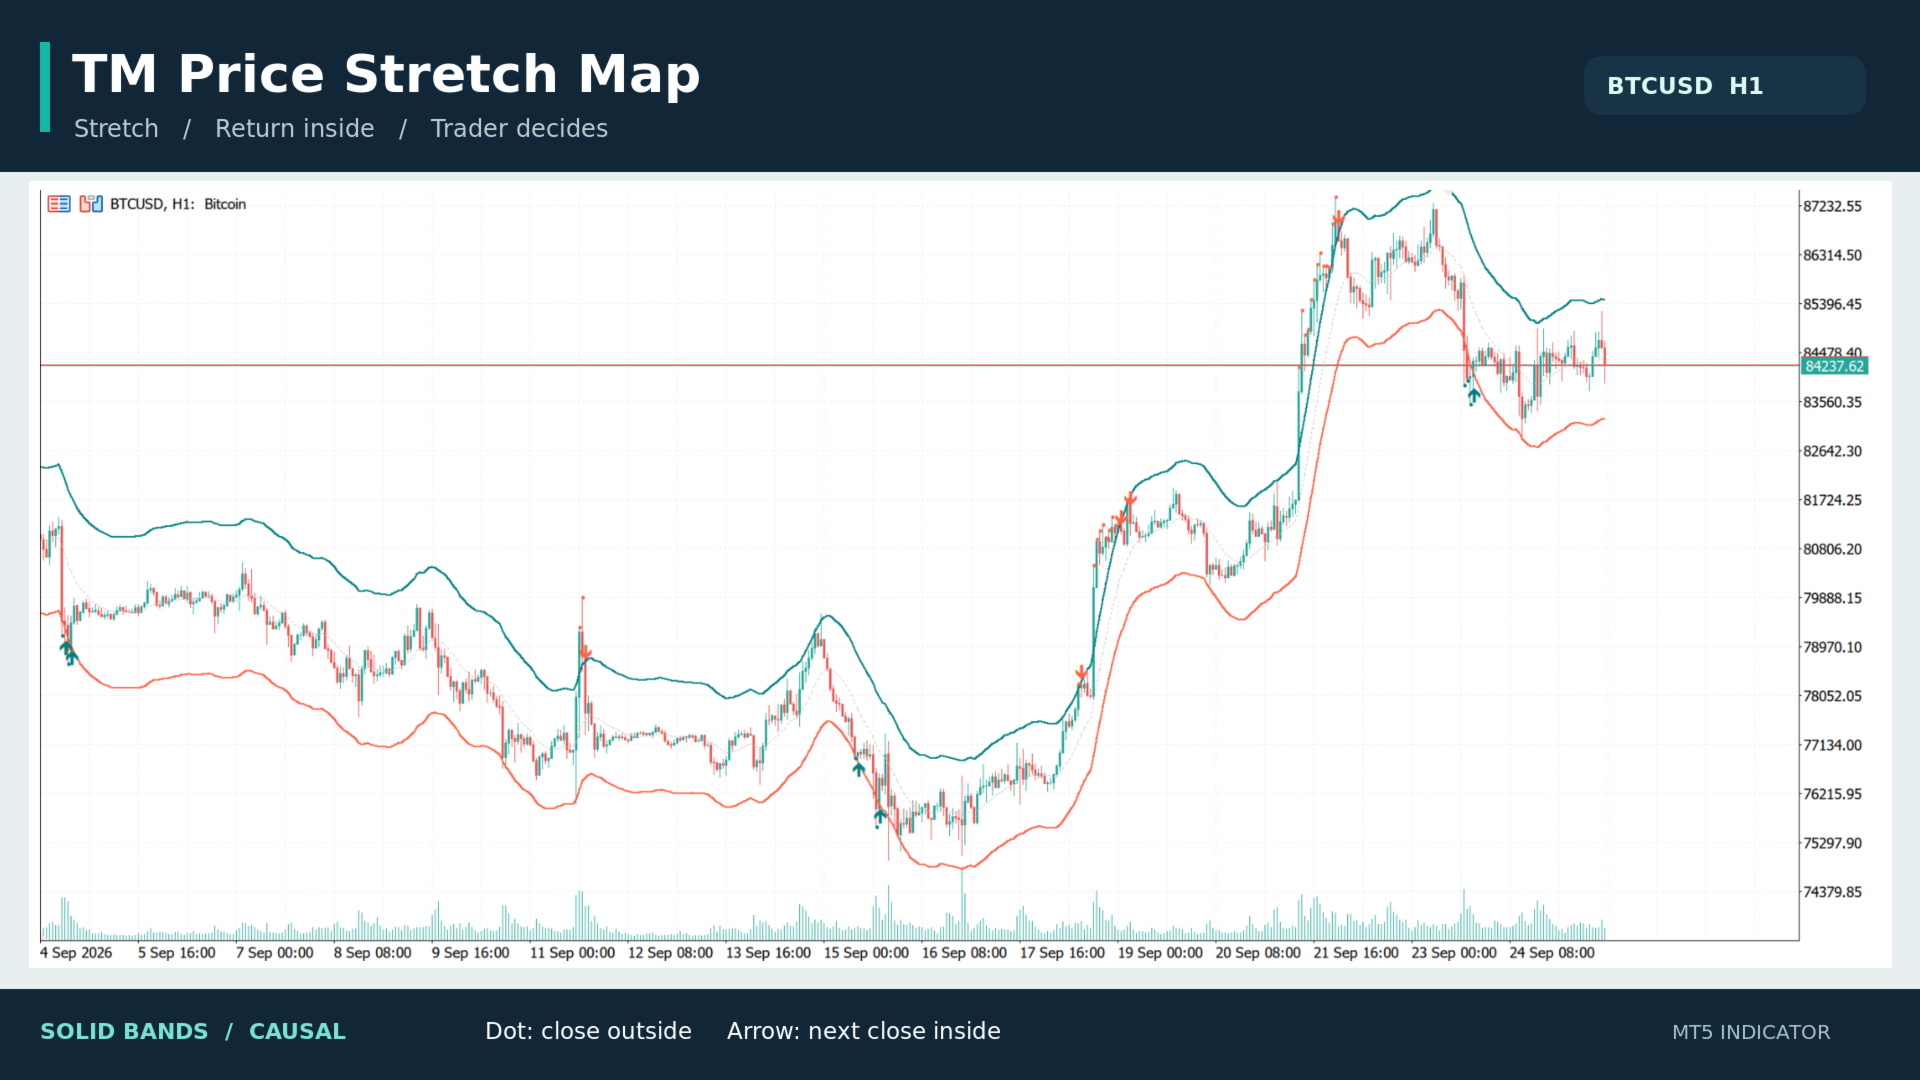
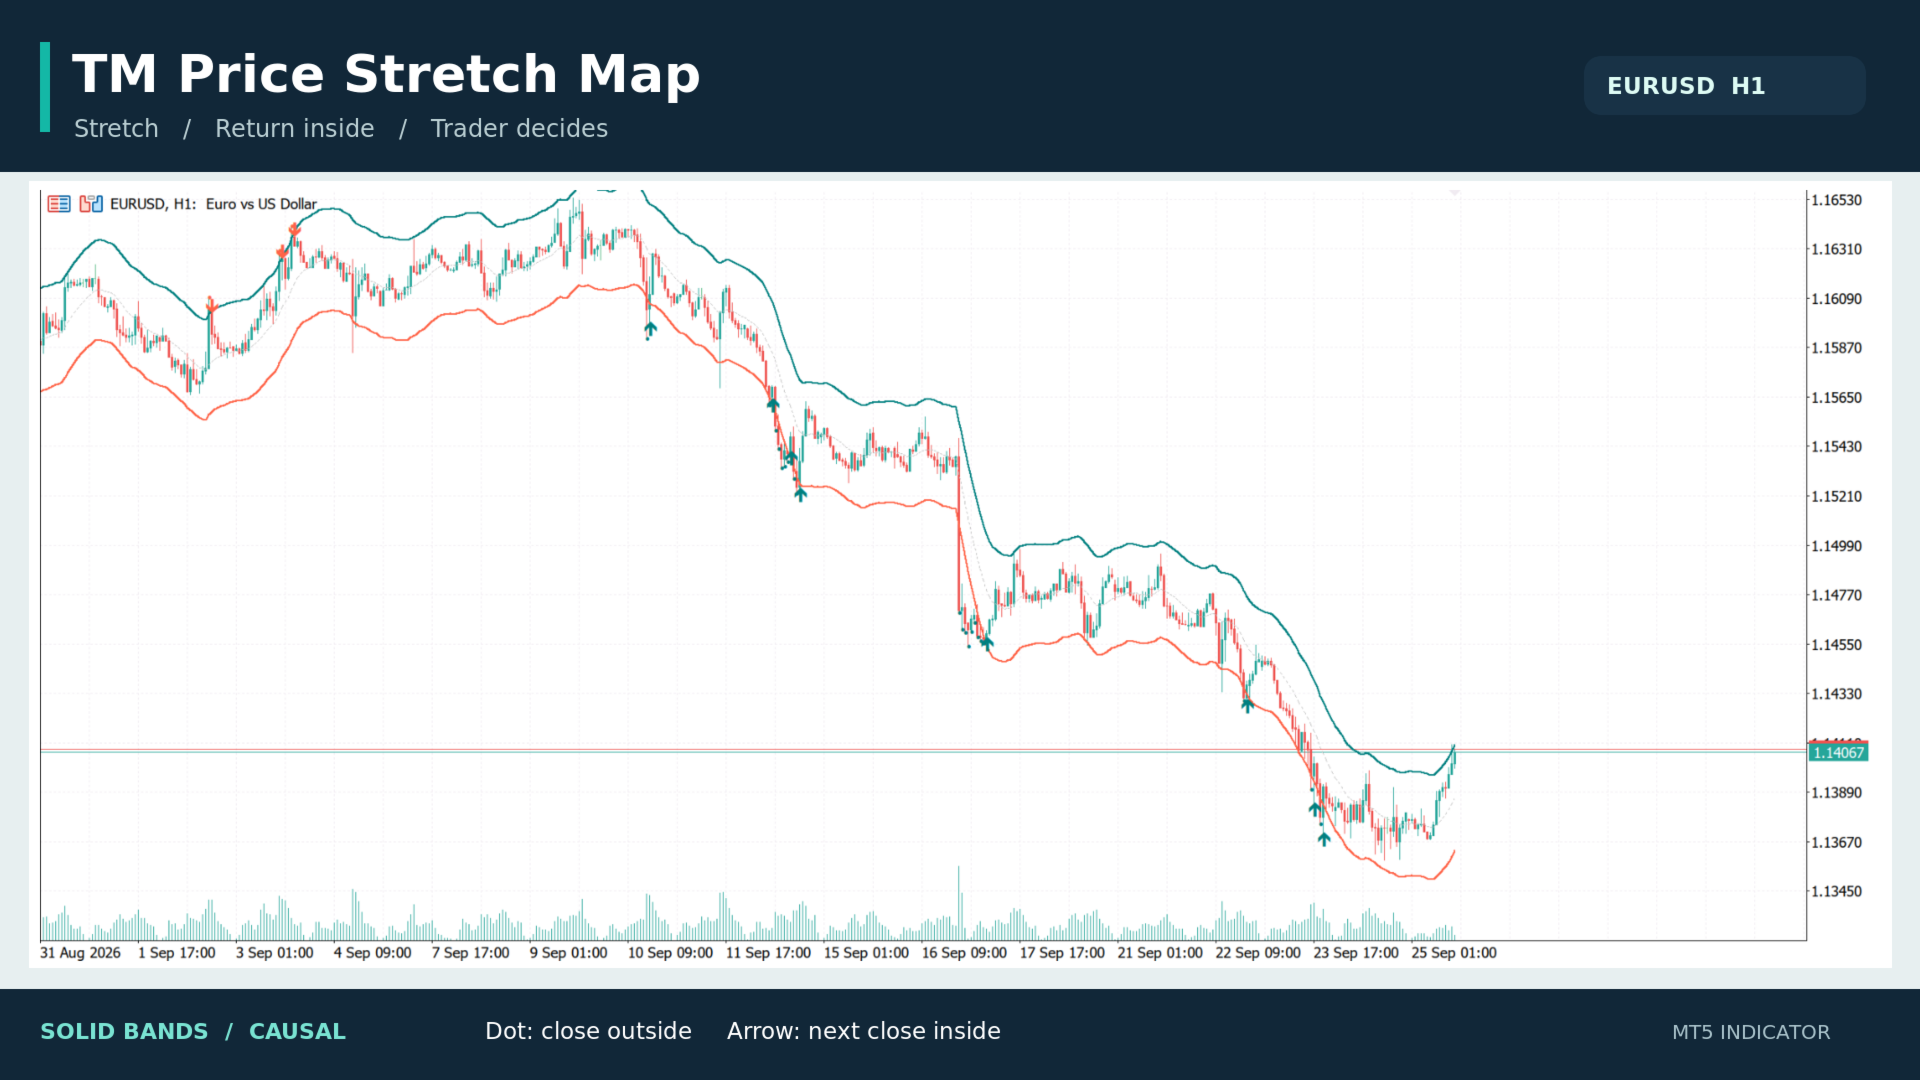
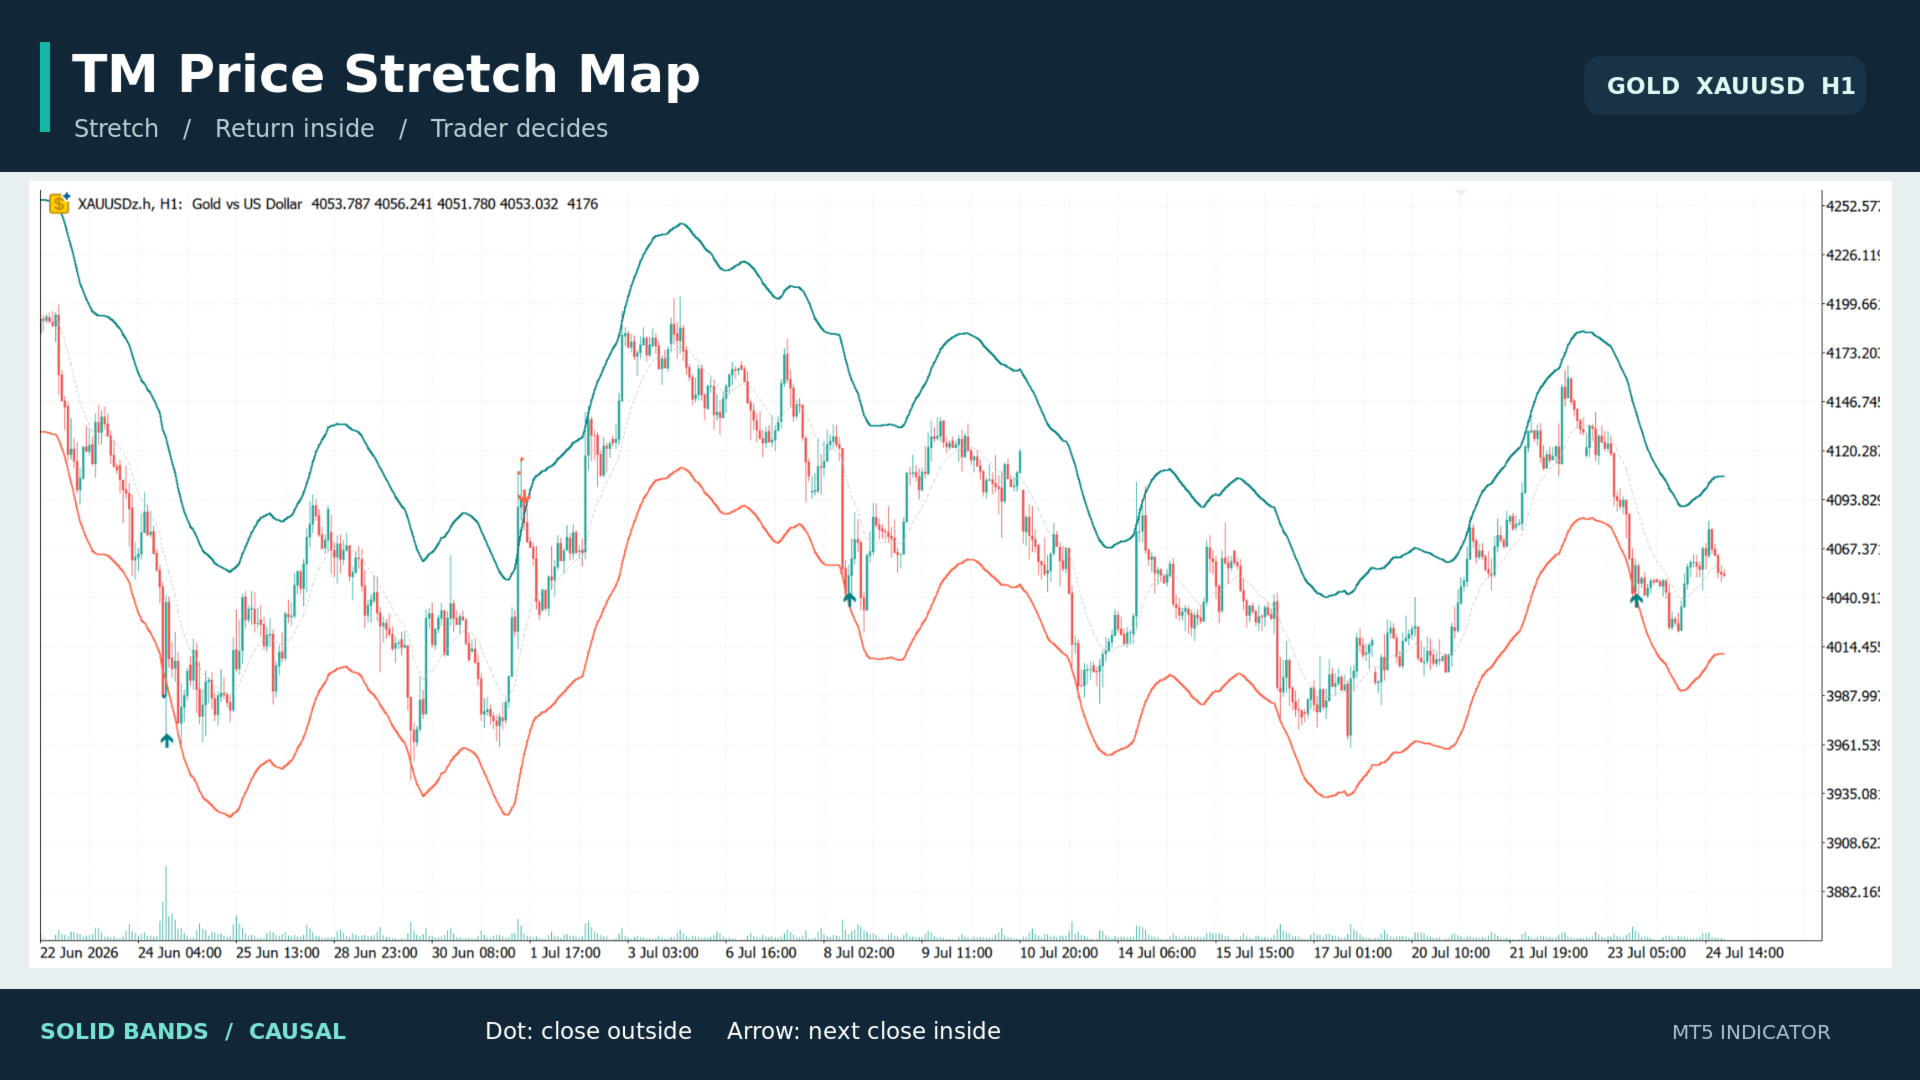
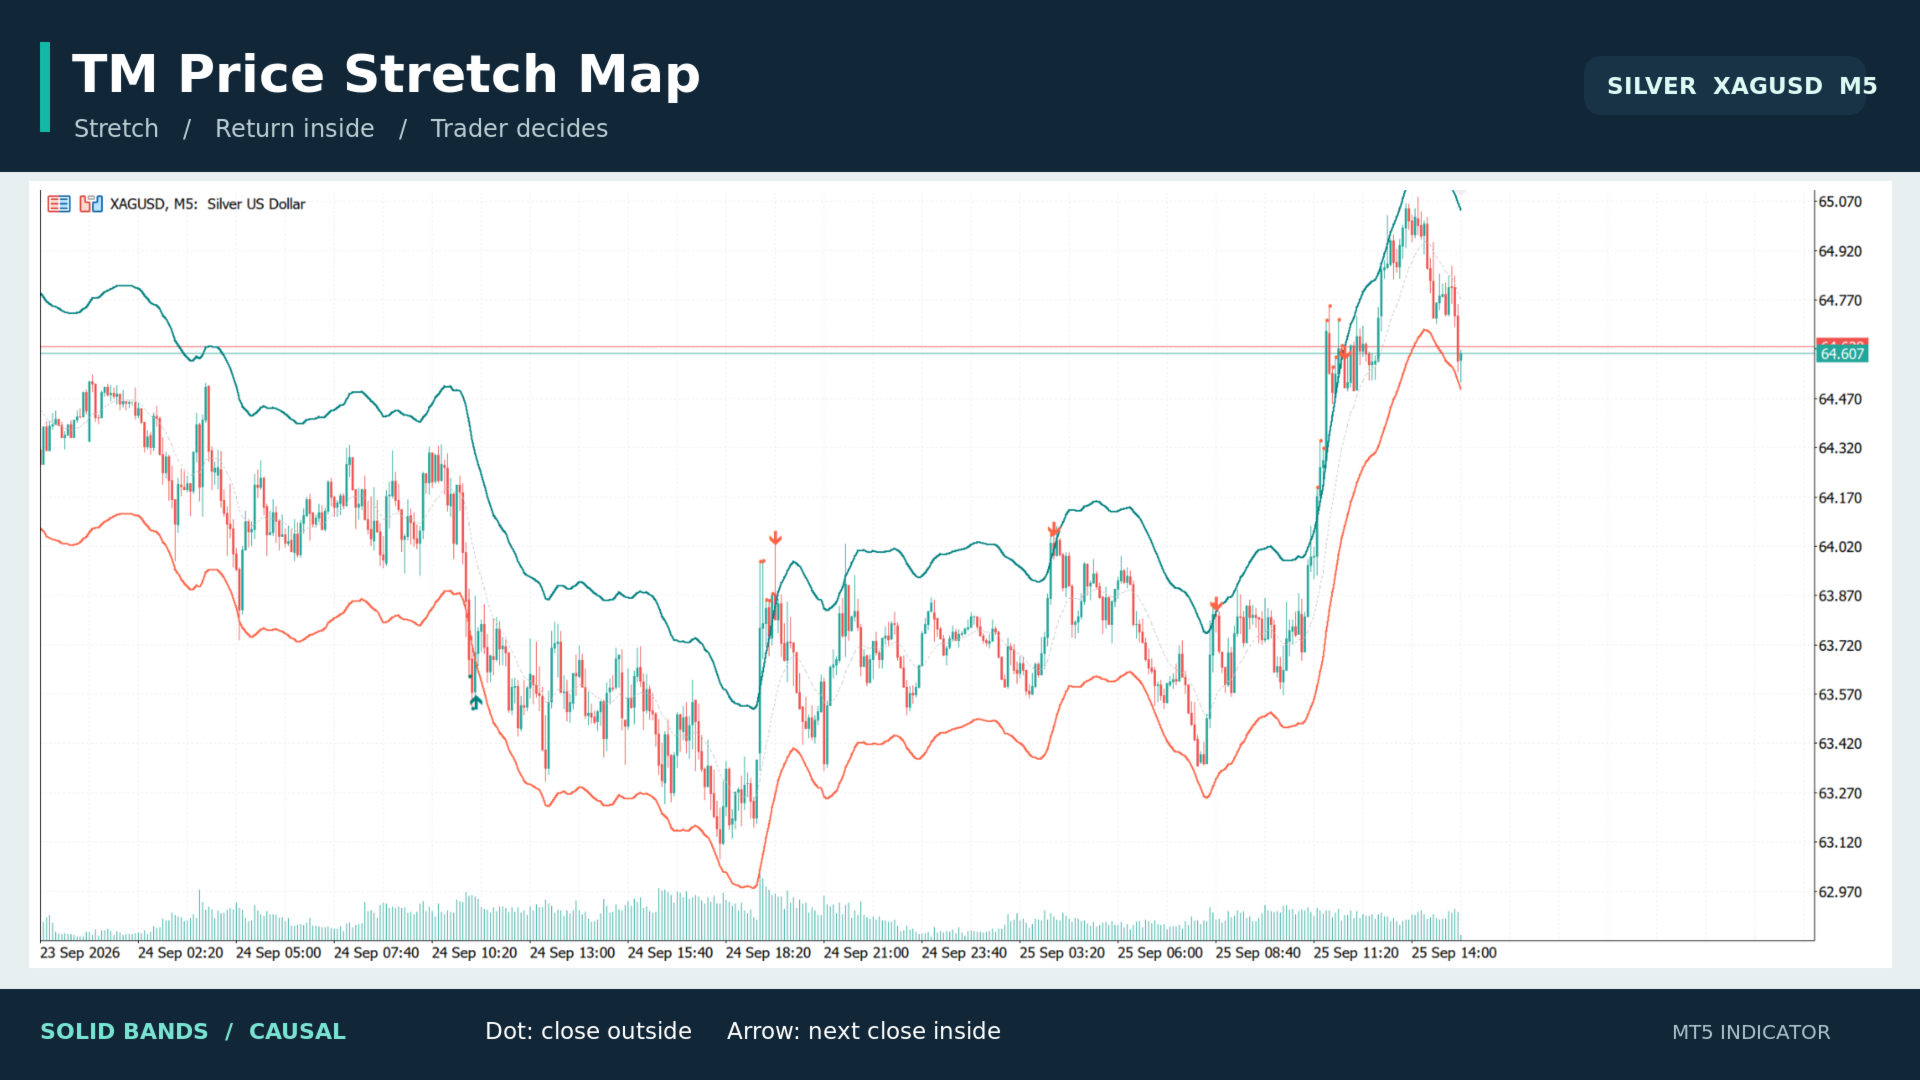
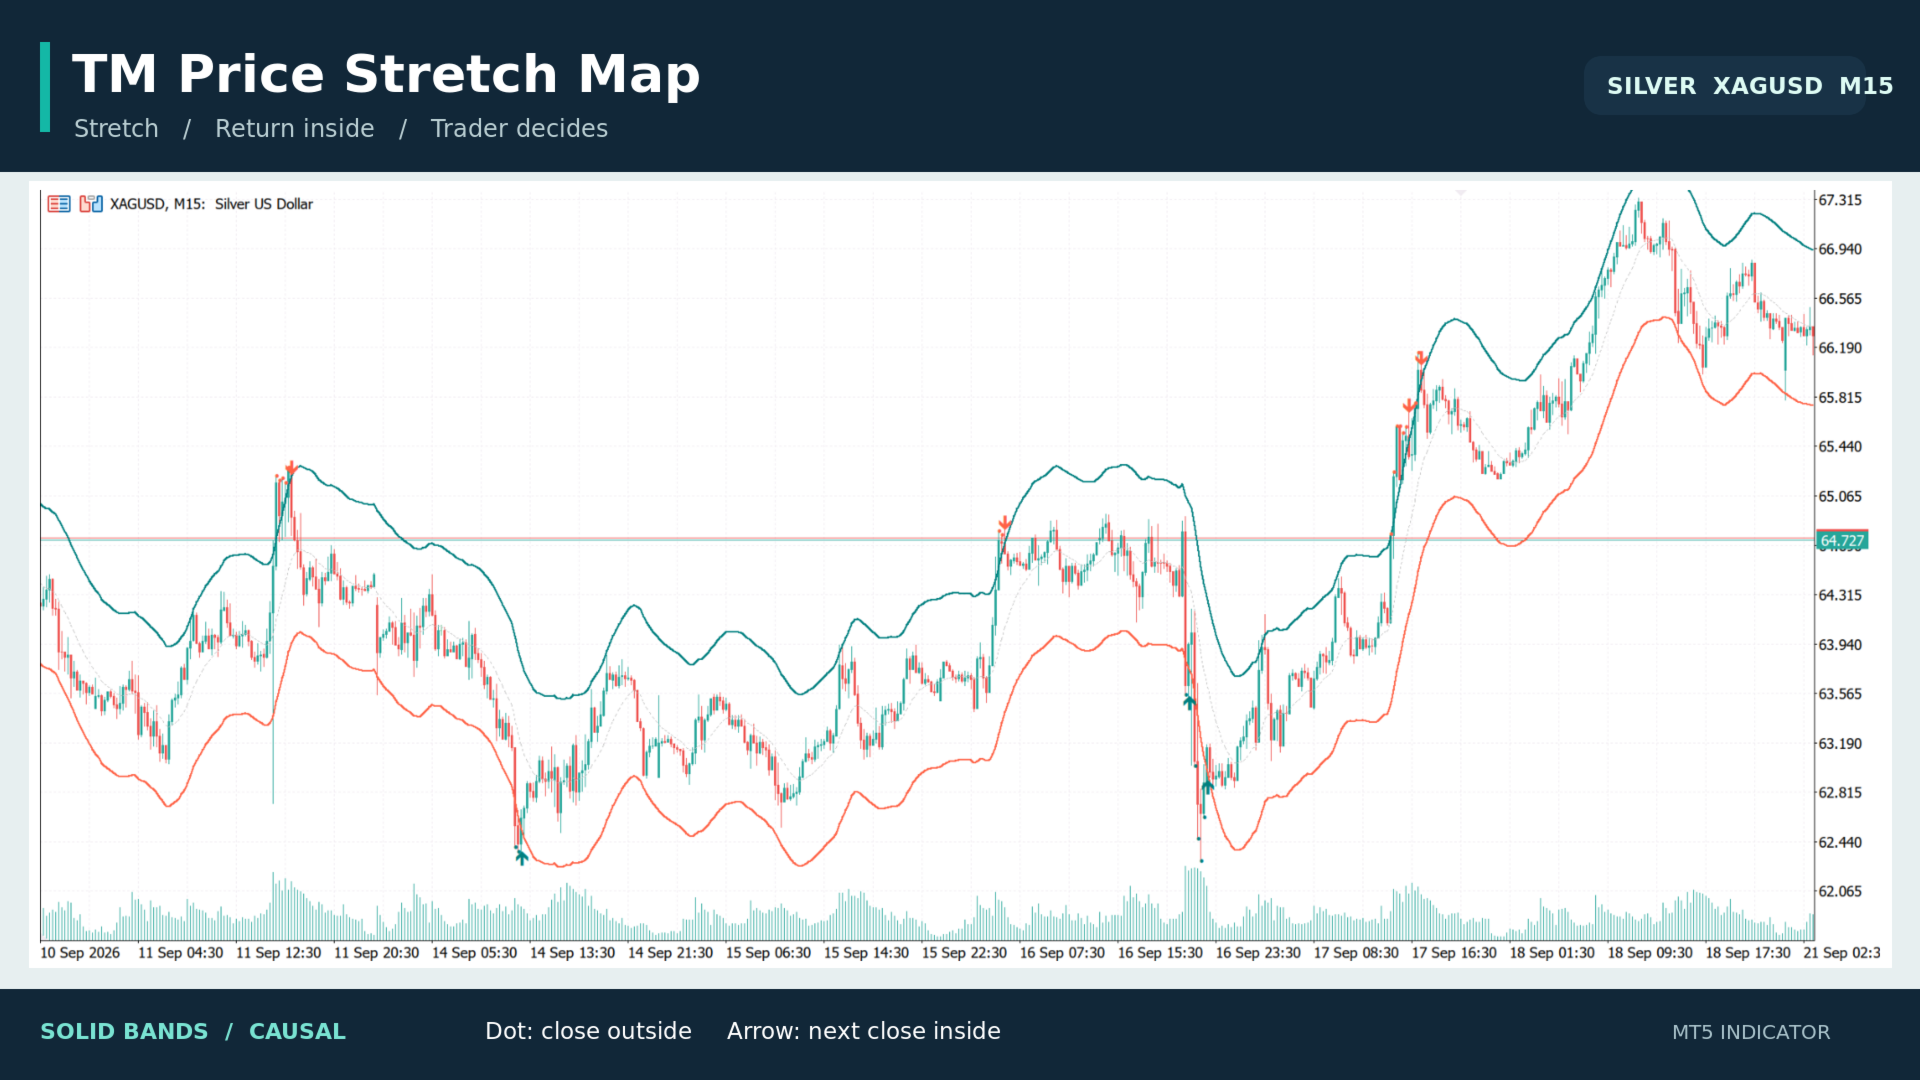
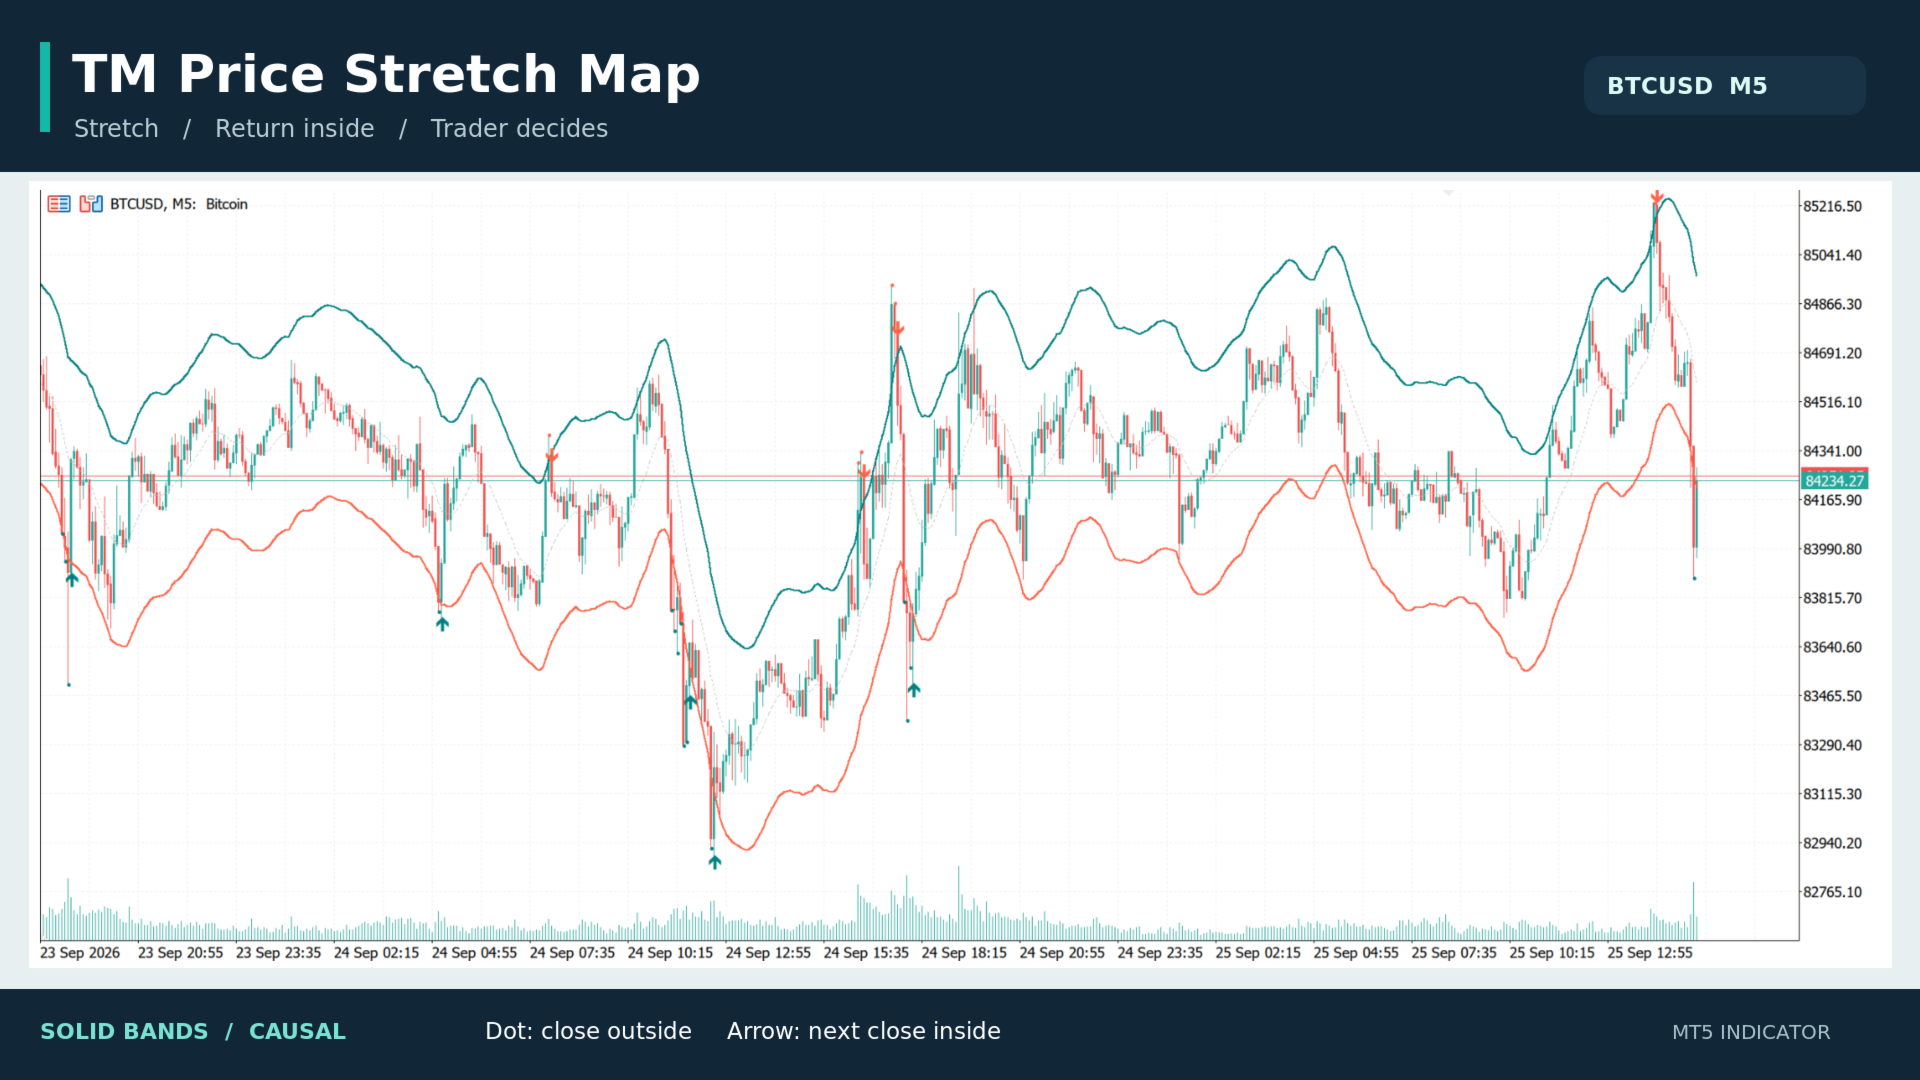
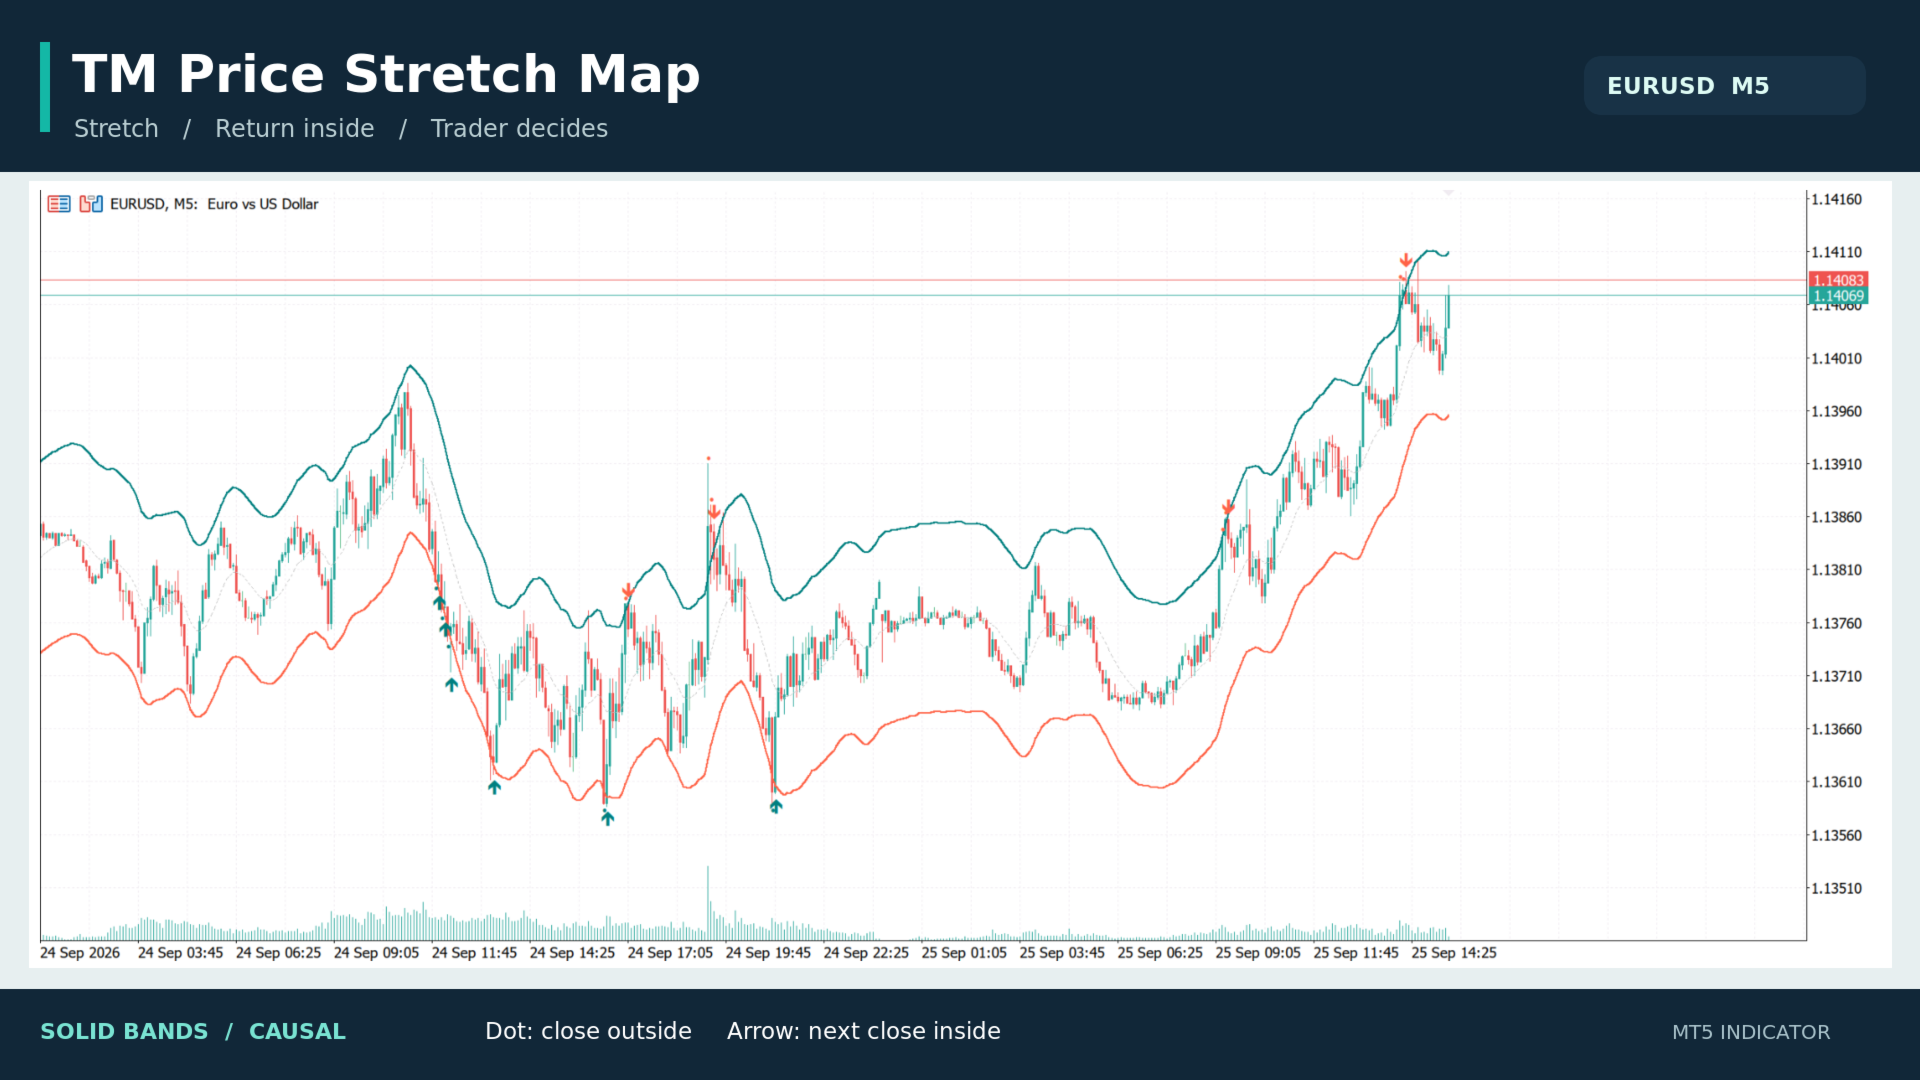
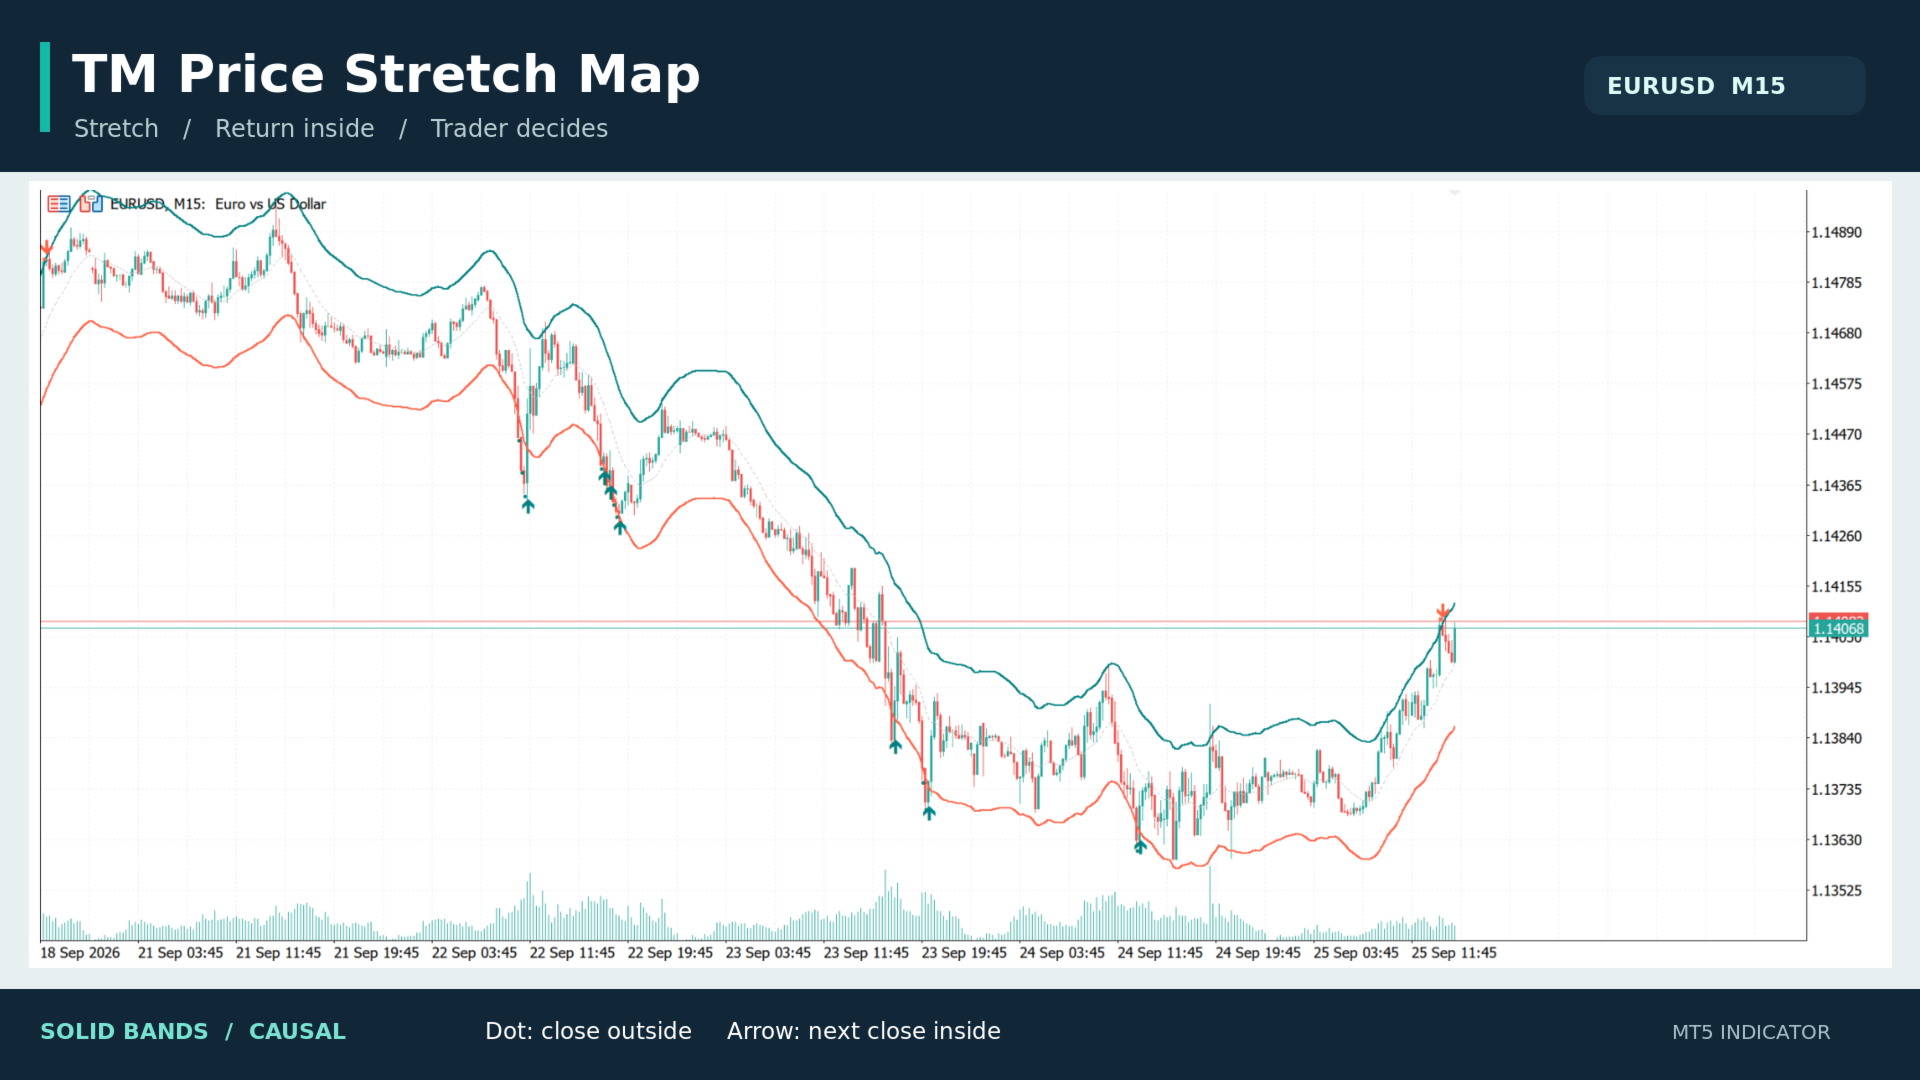
TM Price Stretch Map displays a price envelope to help traders notice when a candle closes beyond a band and when the next completed candle returns inside it. The solid upper and lower bands use a causal Gaussian kernel calculation. A red dot marks a completed close above the upper band; a teal dot marks a completed close below the lower band. A down arrow marks the next completed candle closing back inside both bands after an upper stretch. An up arrow marks the equivalent return after a lower stretch. These markers use the solid causal bands and do not depend on the optional repainting overlay. An optional dashed overlay shows a retrospectively smoothed envelope. Its historical curves can change as new candles arrive. The dashed overlay is for visual analysis only; it does not produce the dots or arrows. The centerline, markers, dashed overlay, bandwidth, envelope width, price source, history length and band colors are configurable. The default arrow logic uses completed candles. The indicator does not open trades. A stretch or return is a chart observation, not a guarantee of a reversal. Assess trend, structure and risk independently.