ChartDeck PRO MT4
- Indicators
- Version: 1.11
- Activations: 5

ChartDeck PRO
ChartDeck PRO combines seven MetaTrader 4 chart tools, moving averages, Bollinger Bands, ZigZag, support and resistance, pivot points, sessions, and economic news, into one indicator with a single icon panel. One program replaces seven indicators and seven properties dialogs.
Each tool switches on or off with a click. A settings drawer next to the panel changes parameters on the chart. No need to reopen the properties dialog. Each tool keeps its own timeframe, parameters, and alert settings, so a multi-timeframe layout needs only one indicator.
Only the tools you switch on are calculated and drawn.
Functionality overview
Included tools
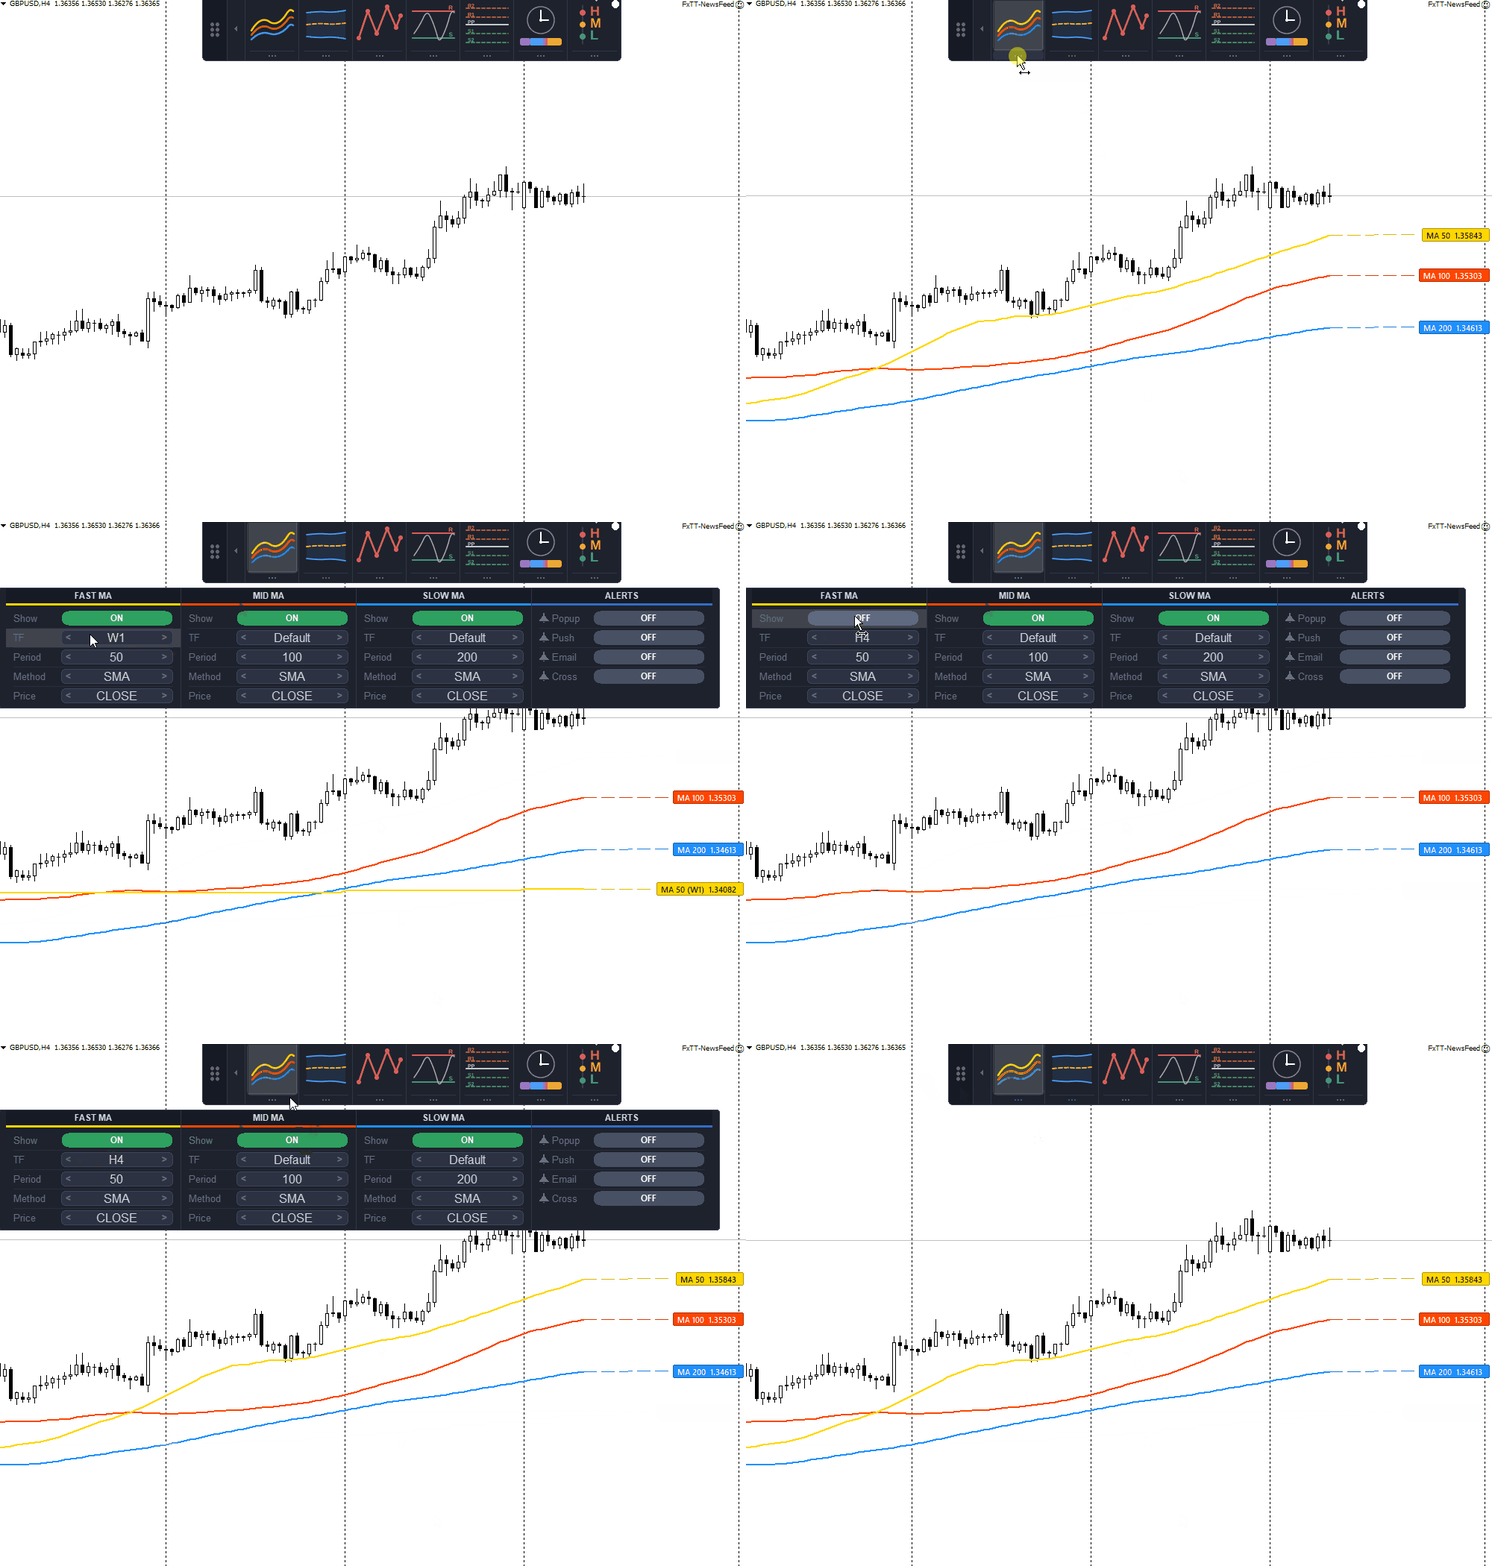
- Triple MA: three moving averages, each with its own period, timeframe, method and applied price
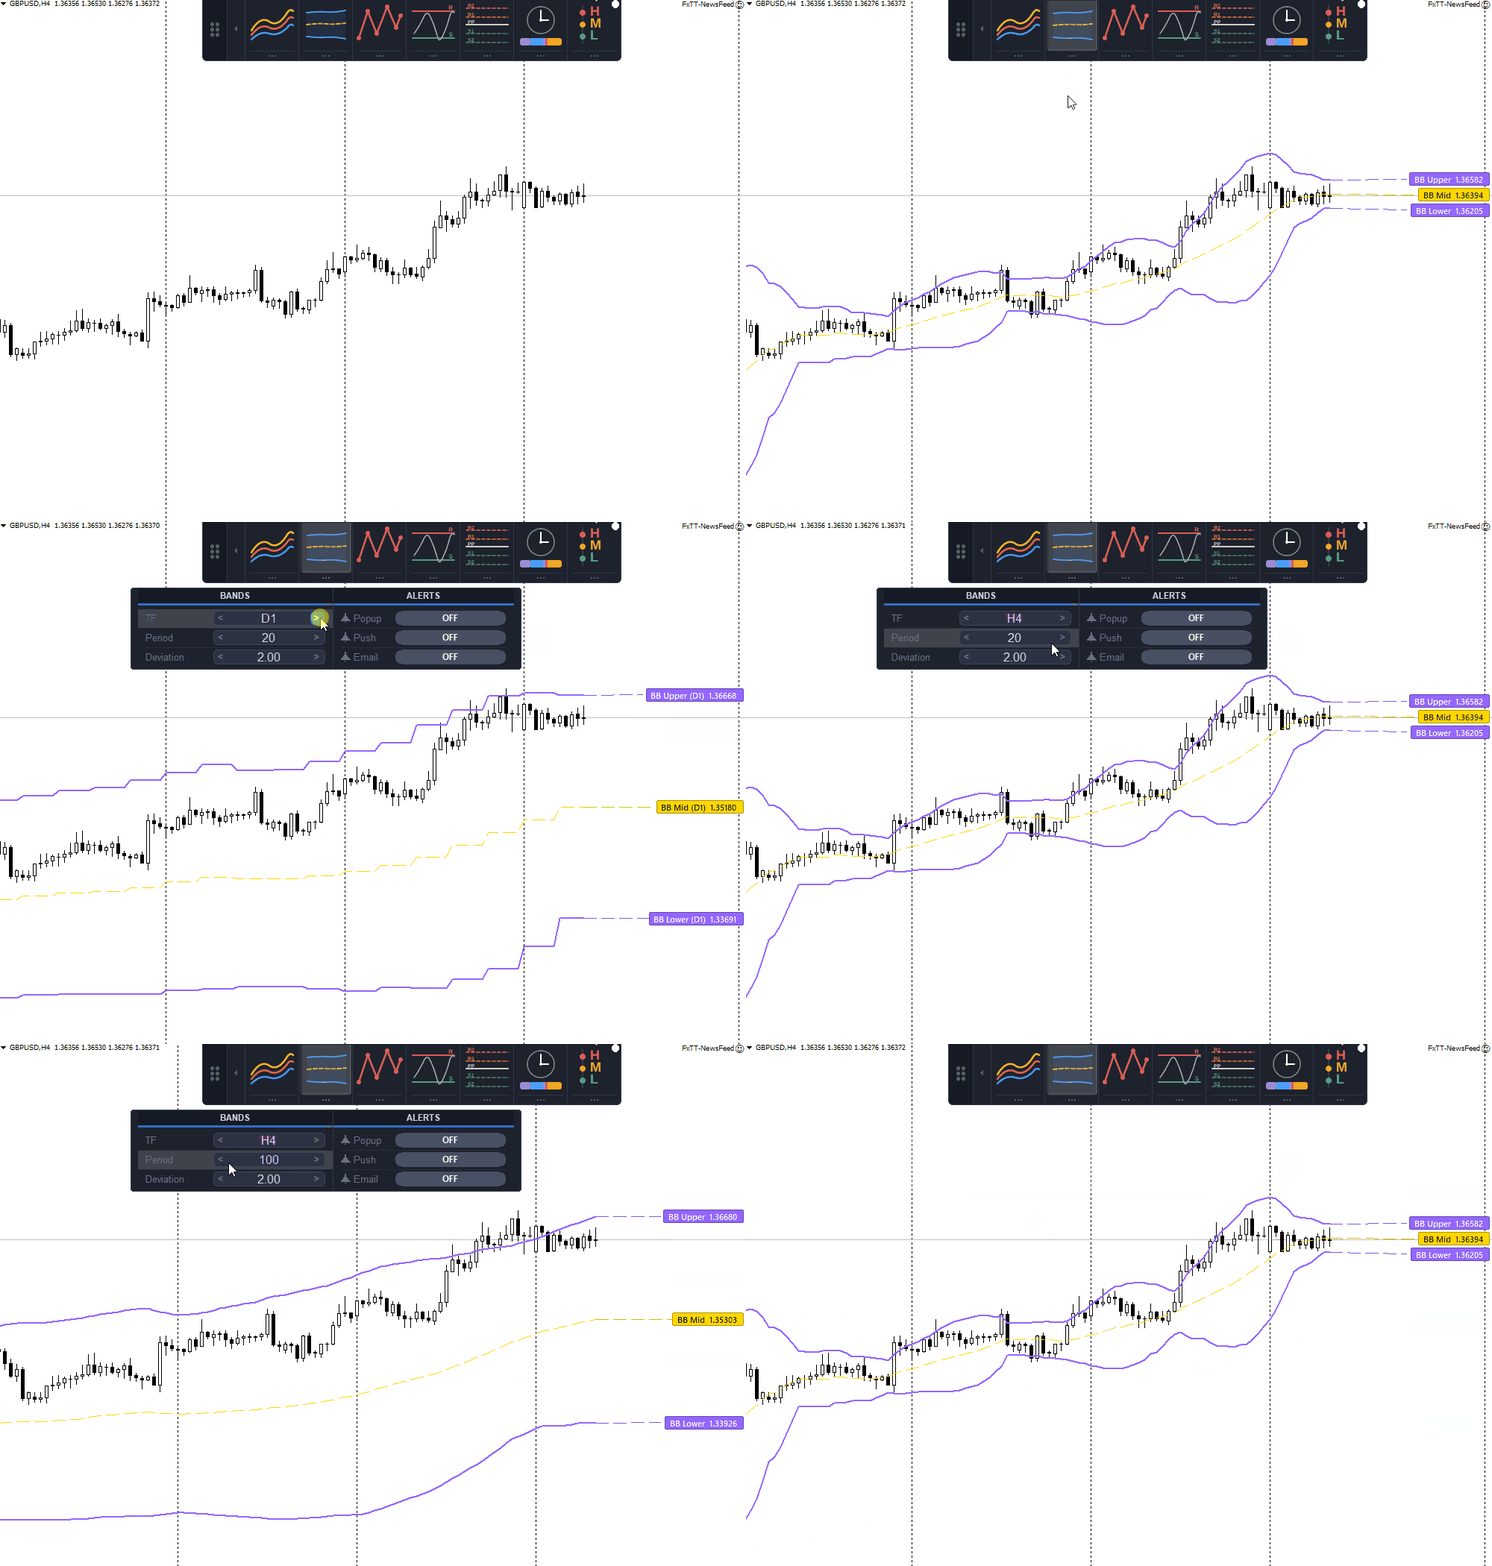
- Bollinger Bands: upper, middle and lower band, with their own period, deviation and timeframe
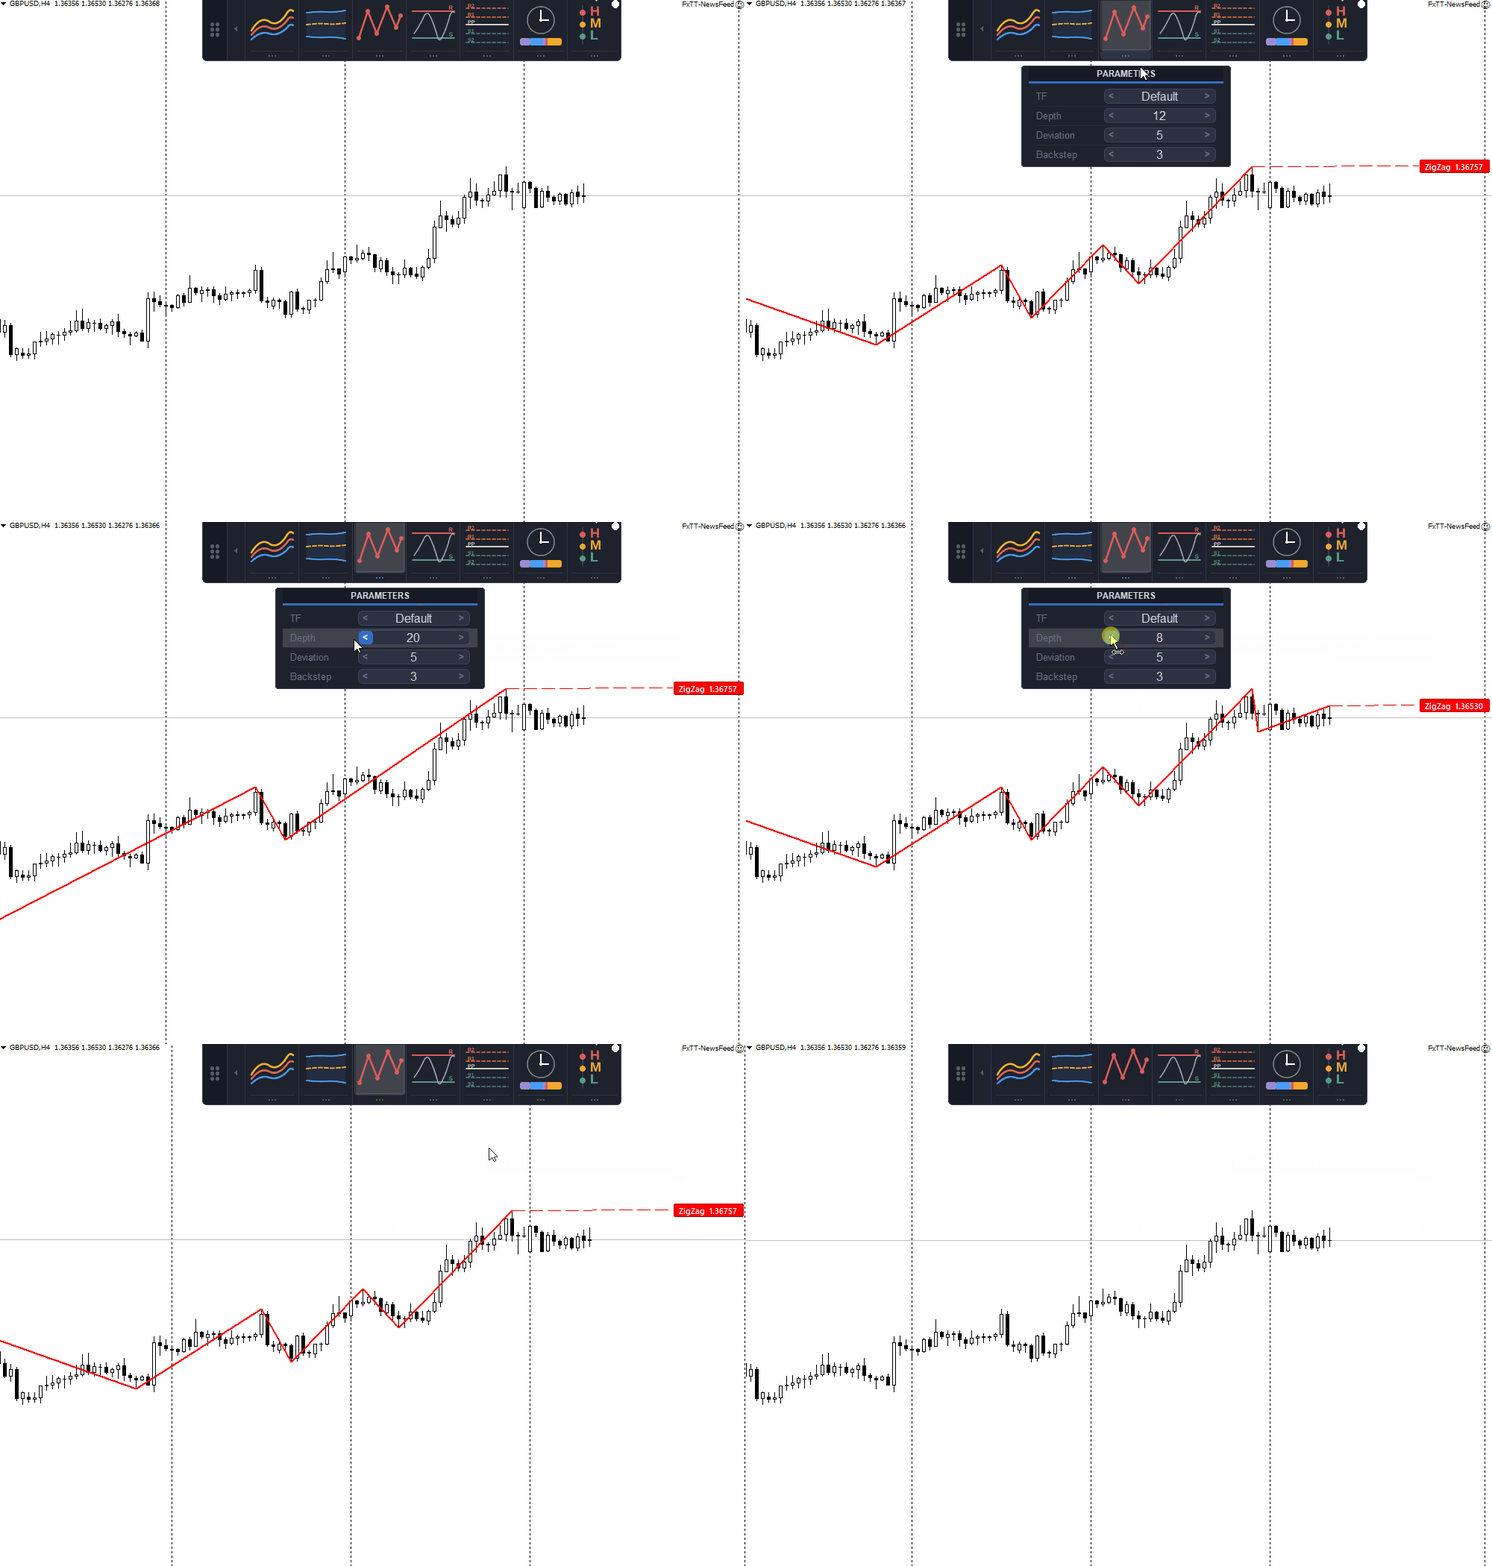
- ZigZag: swing structure from depth, deviation and backstep
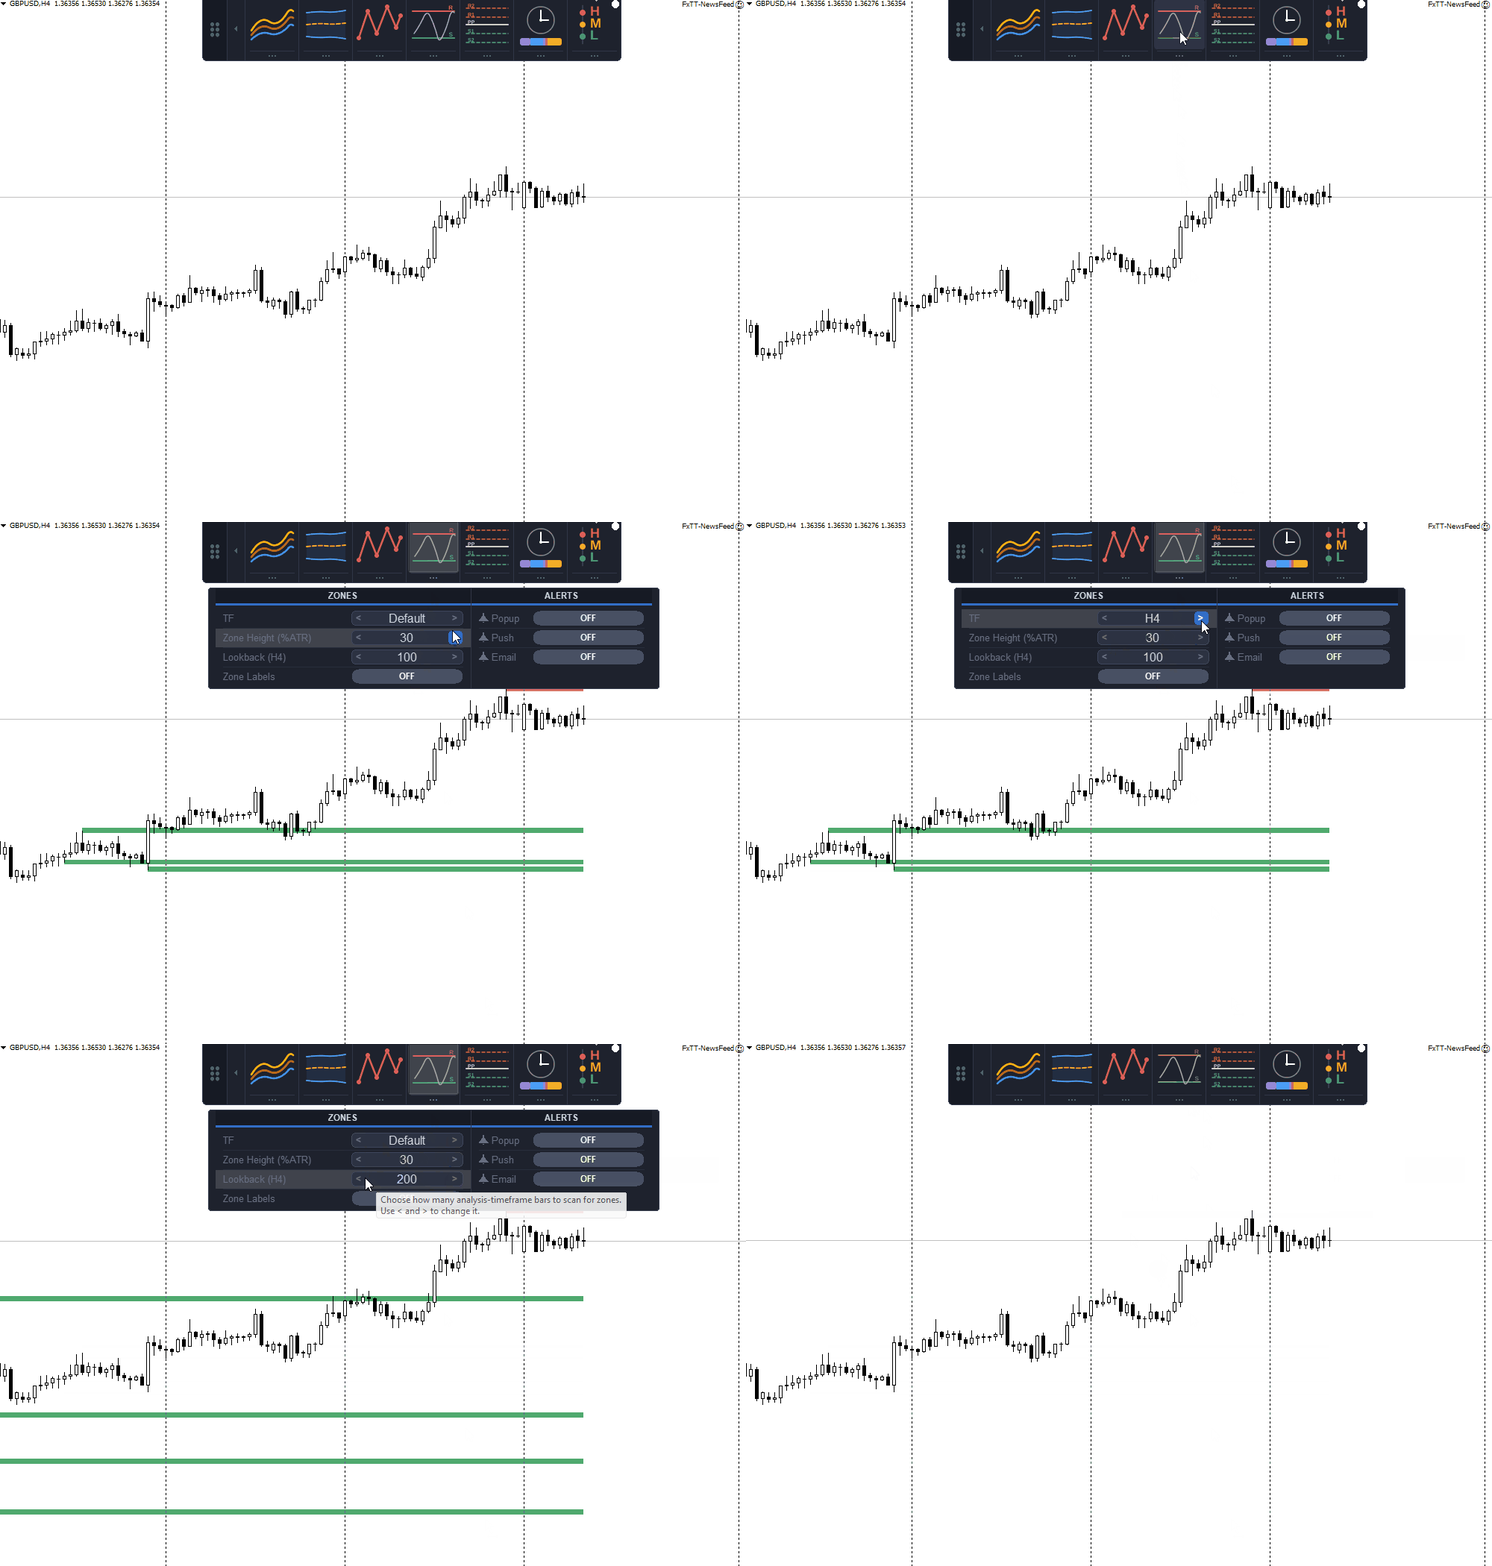
- Support and Resistance: swing-based zones scaled to ATR, ranked by number of tests
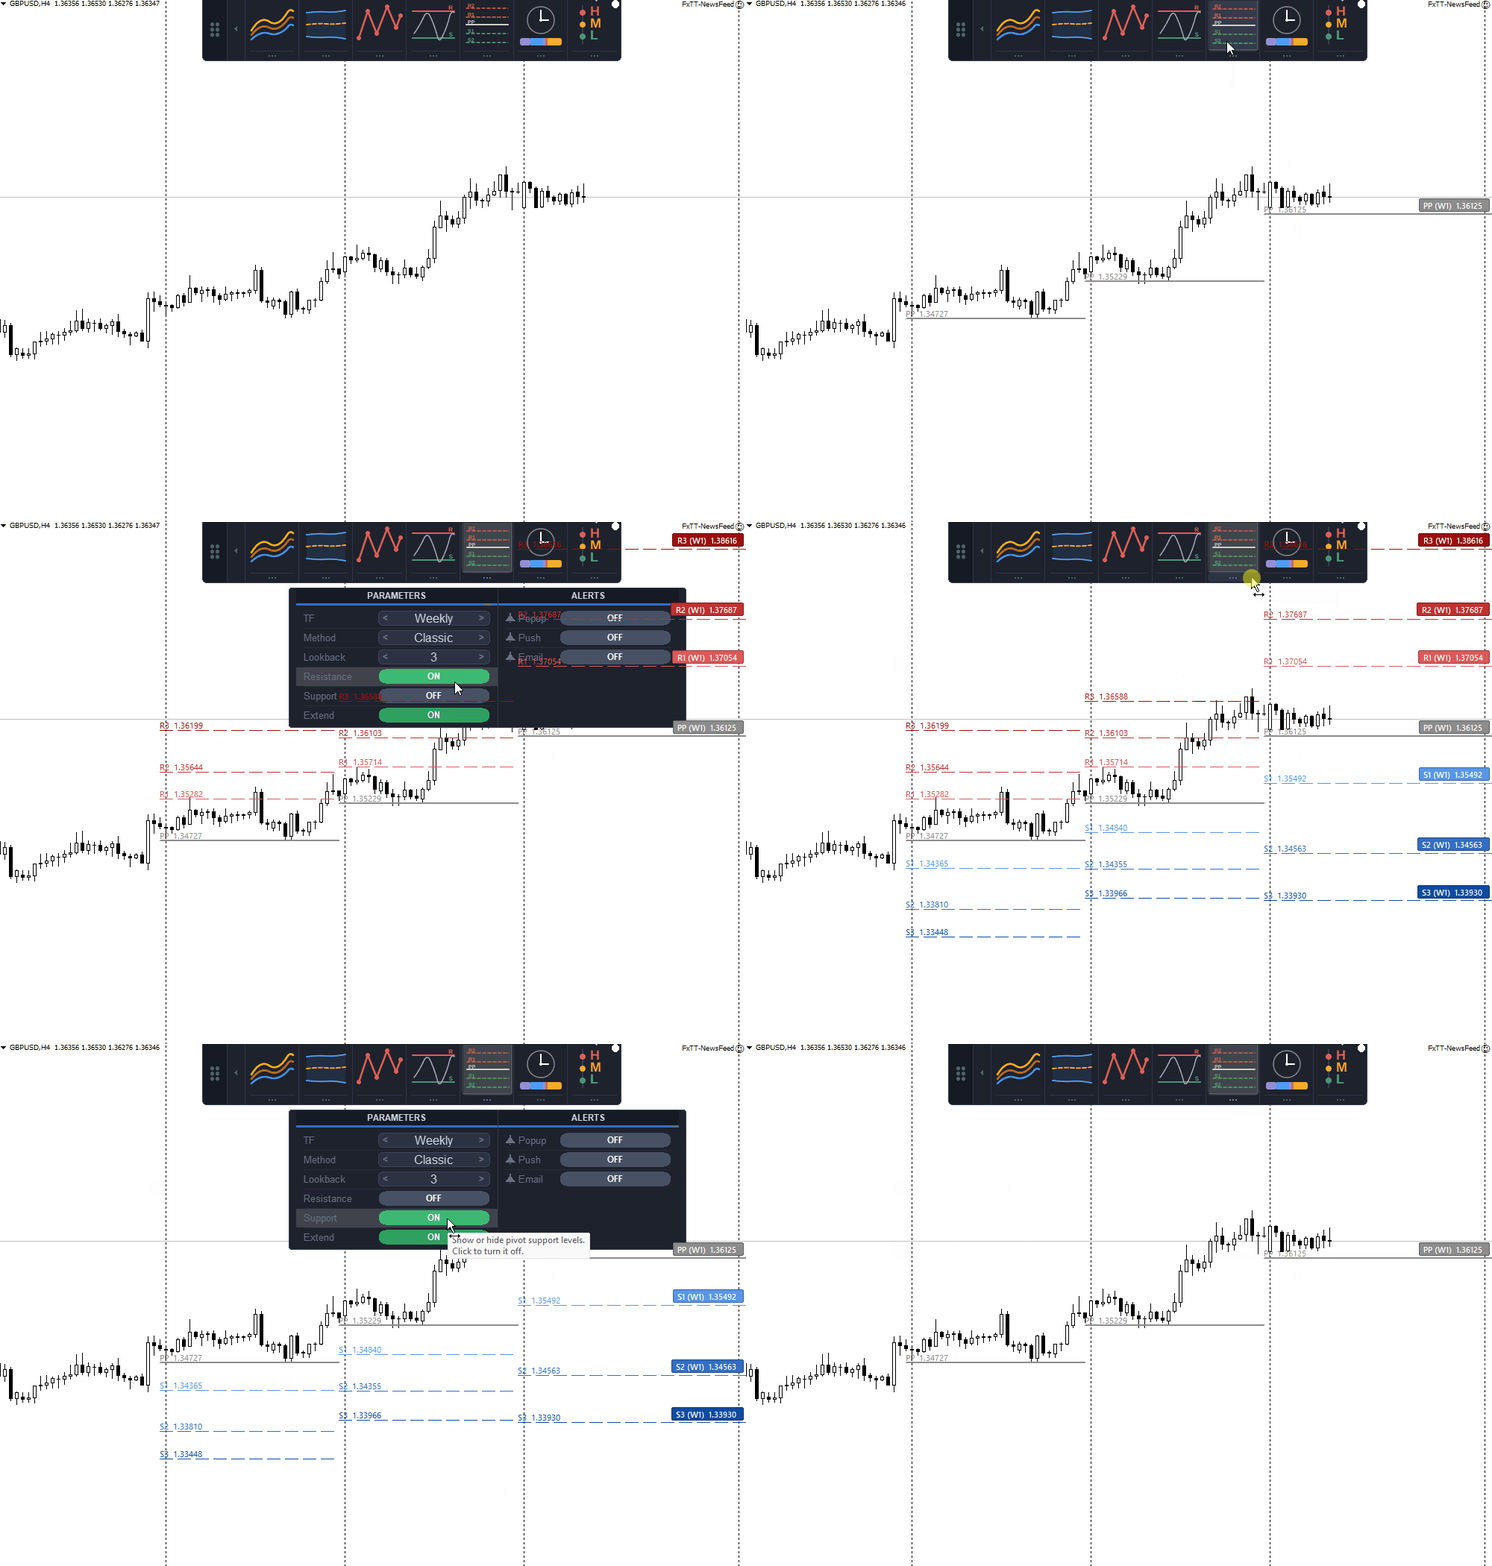
- Pivot Points: daily, weekly or monthly pivots in Classic, Fibonacci, Camarilla, Woodie or DeMark form
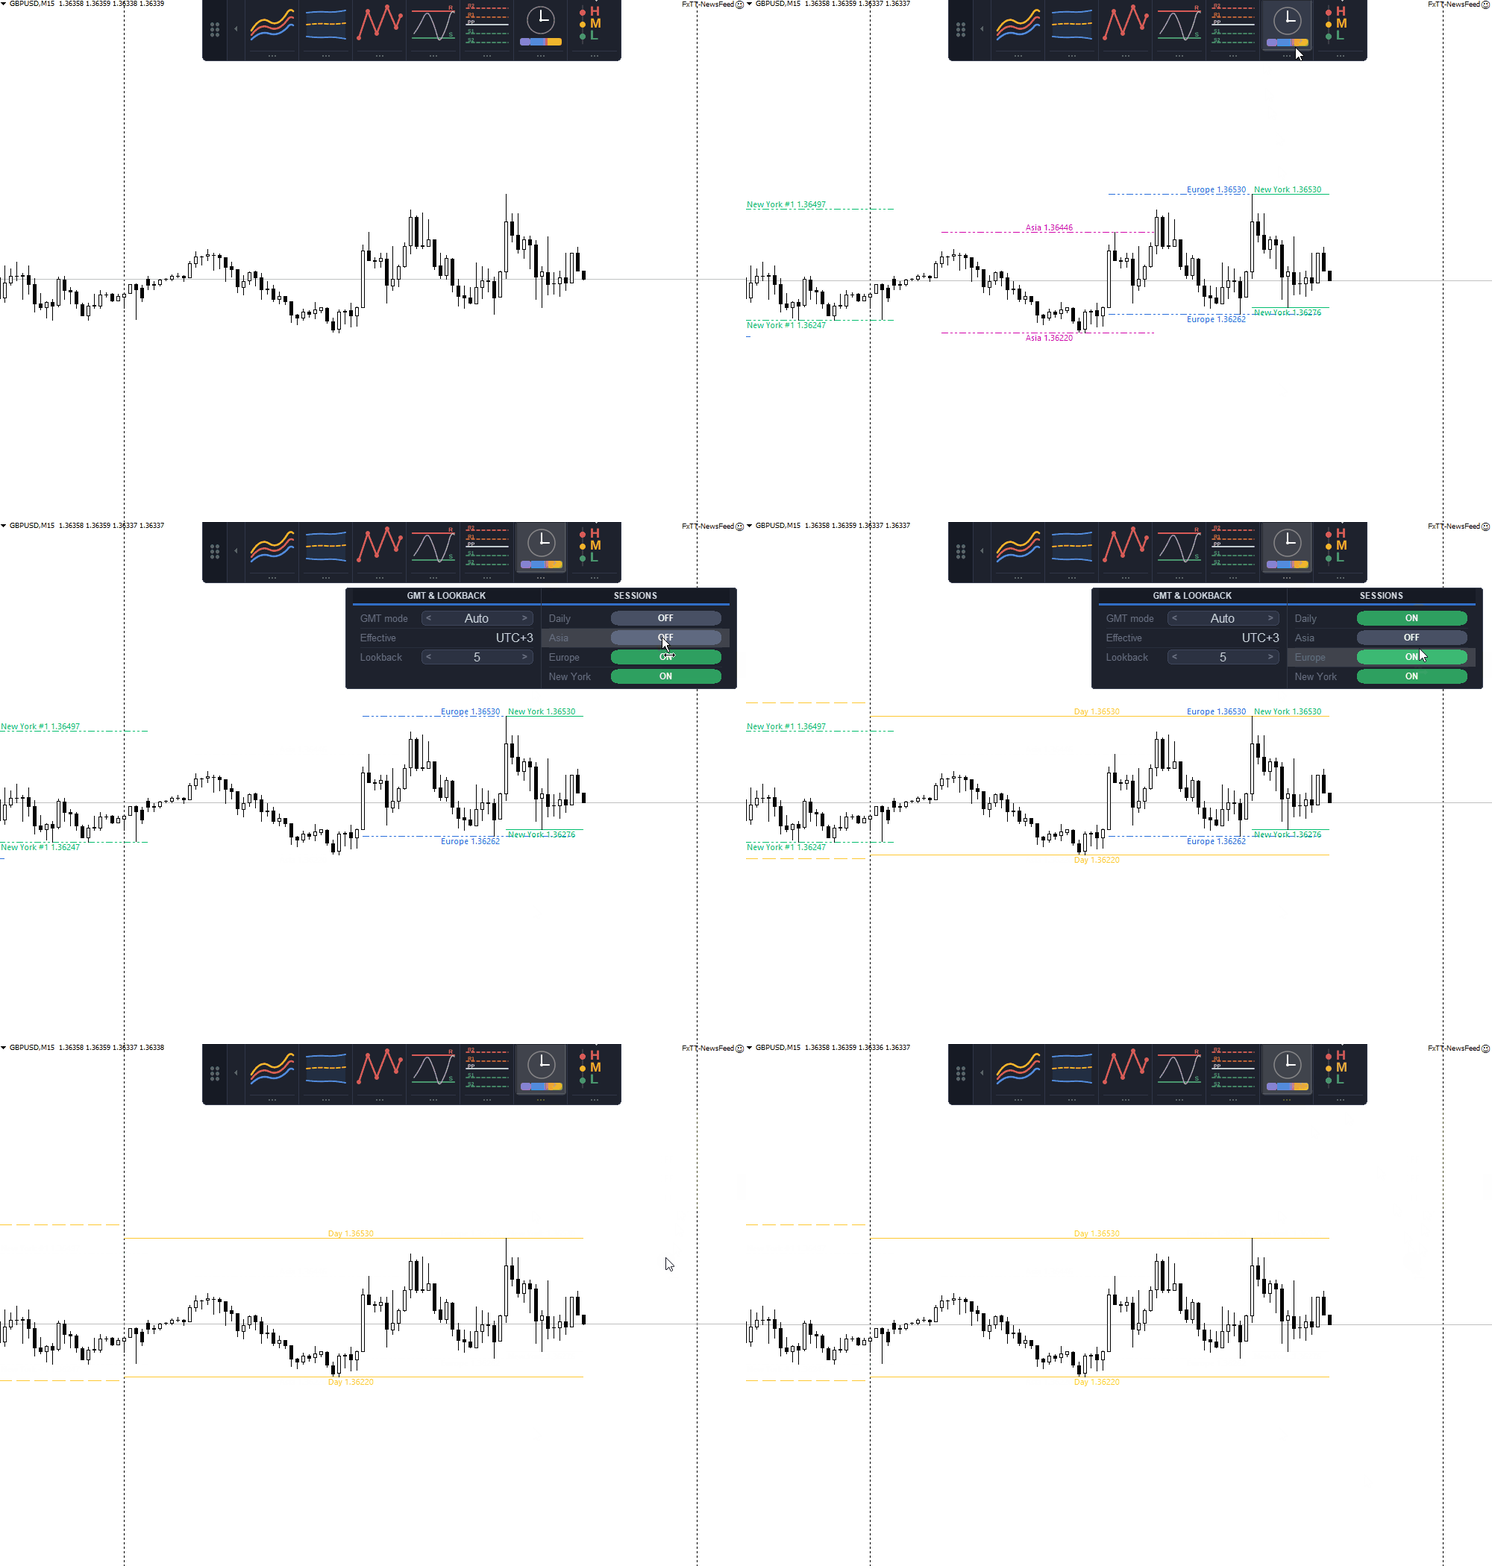
- Sessions: Asia, Europe and New York high and low levels with automatic broker GMT offset
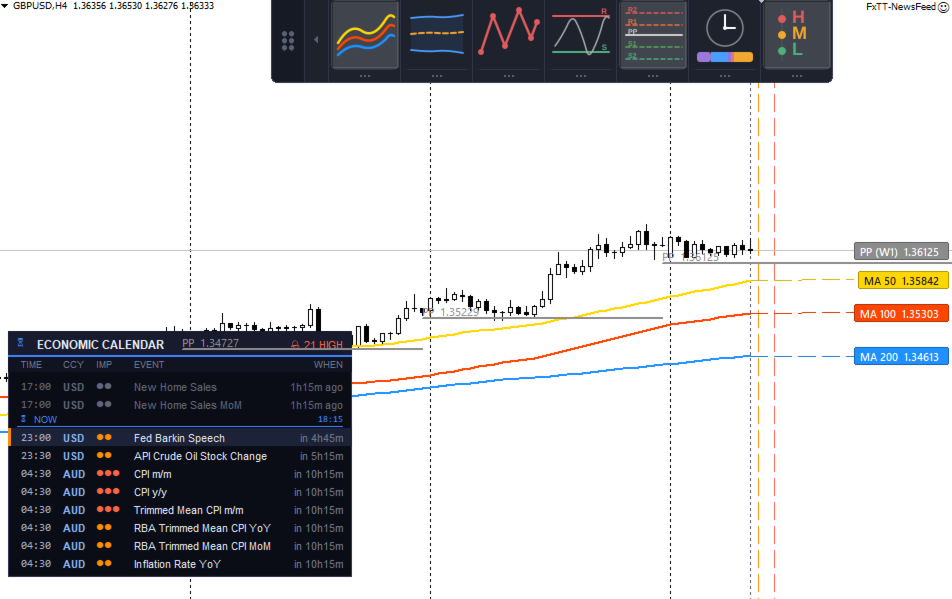
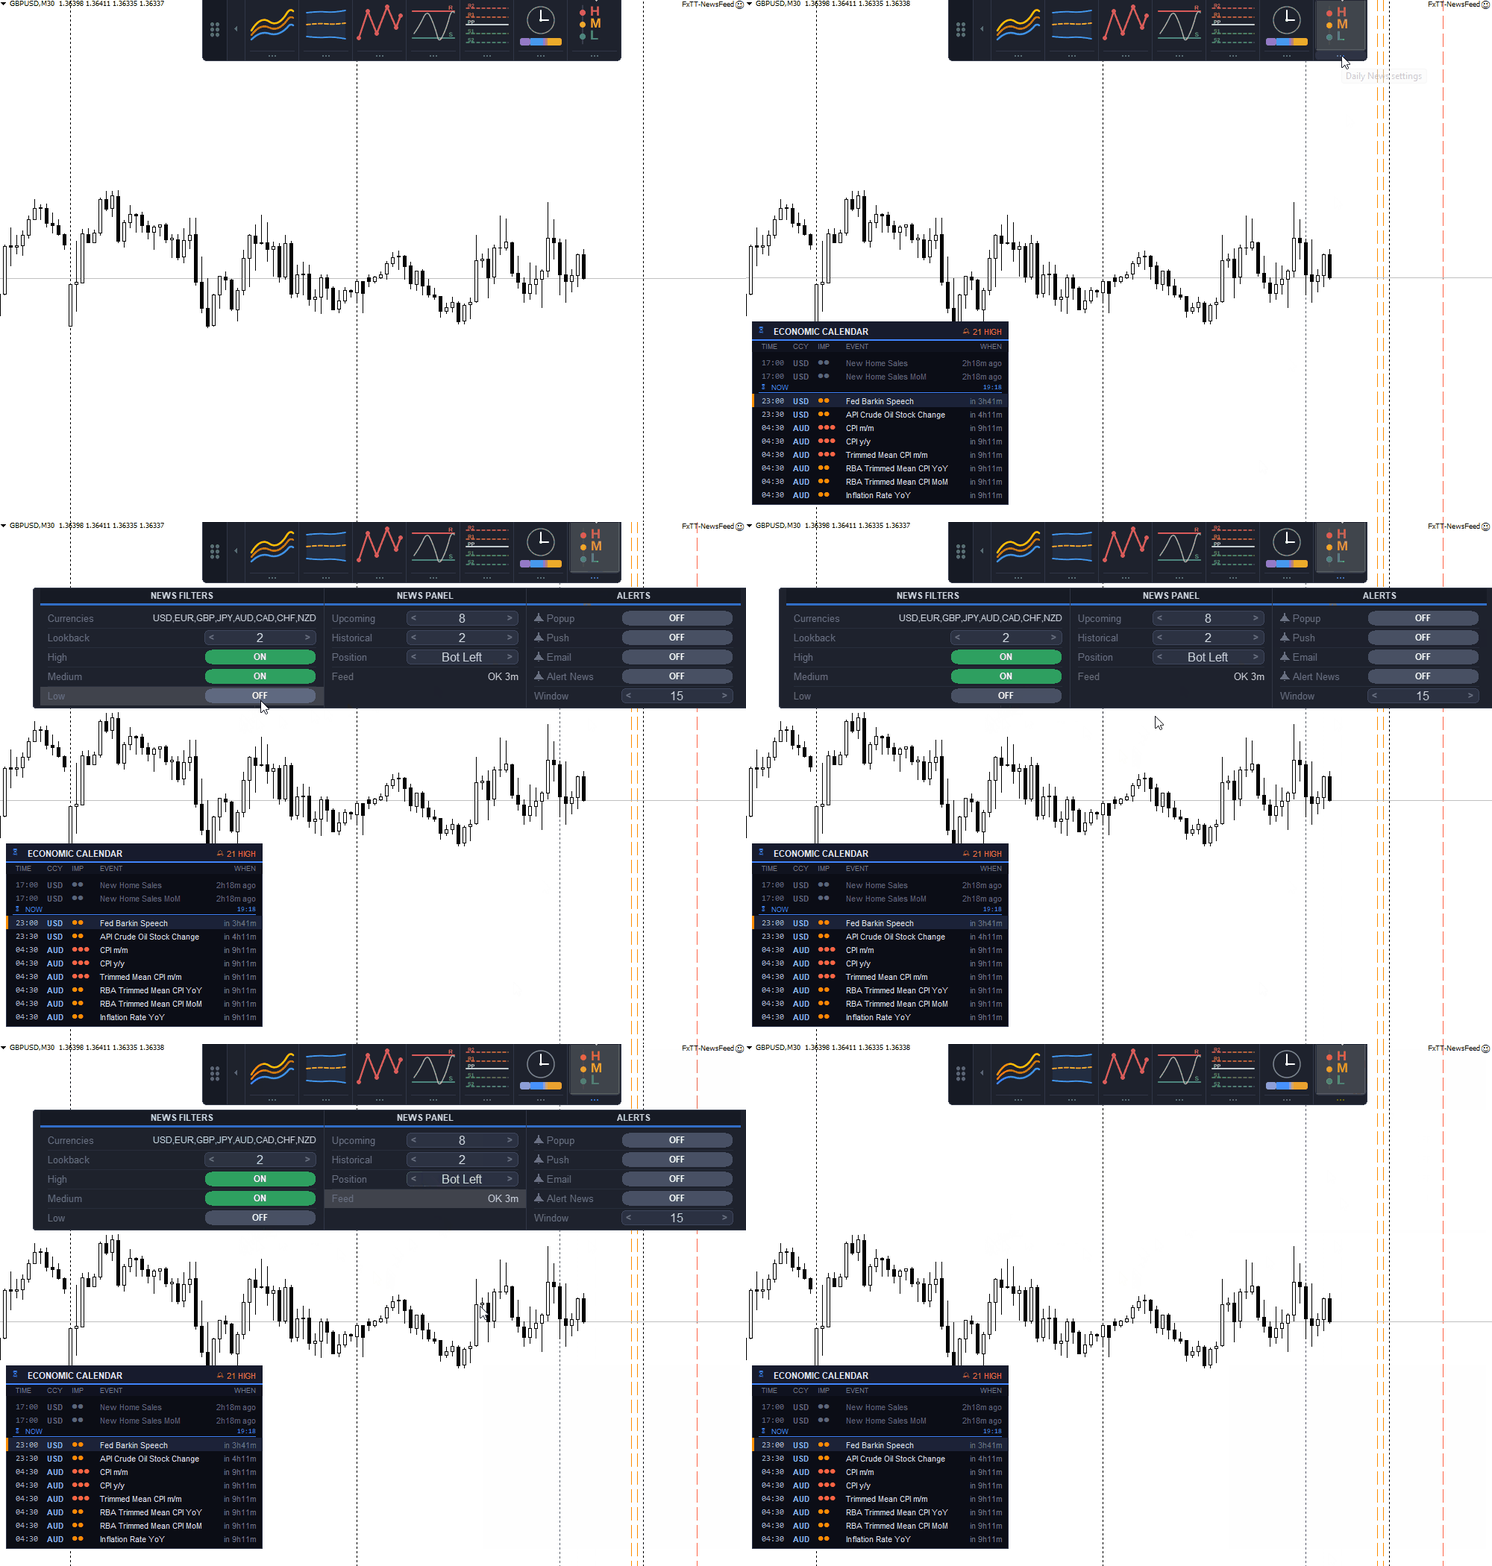
- Daily News: economic calendar events as vertical lines and an on-chart panel, fed by a free companion program (see Daily News below)
On-chart control
- Draw or remove a tool with one click on its icon
- Open a tool's settings drawer from the strip below its icon
- Step periods, timeframes, methods and other values with arrow buttons
- Toggle parts of a drawing on and off inline
- Every control has a tooltip, including why it's locked
- Drag the panel anywhere and dock it to any chart edge
- Collapse the panel to a strip when you need the chart clear
- Choose icon size, dark or light theme, button text and checkboxes
Alerts
- Popup, push and email delivery set separately per tool
- Alerts when price reaches a moving average line, two moving averages cross, price reaches a Bollinger band, price reaches a support or resistance zone, or price reaches a pivot level
- Alert a configurable number of minutes before a filtered news event
- One alert per level per bar, no repeated messages from a single candle
Chart persistence
- Panel position and docking edge saved per chart
- Active tools and drawer parameters restored on reload
- The indicator checks restored values before use and falls back to defaults if invalid
- Persistence can be switched off in the inputs
Performance and resource use
- One indicator instance instead of seven, with a single set of chart buffers
- A switched-off tool uses no calculation and draws nothing
- Chart updates are incremental. Only bars added since the last update get recalculated
- No DLL, no external library and no internet request from the indicator itself; Daily News reads a local file kept current by the free companion program described below
Basic usage
- Attach ChartDeck PRO to a chart
- Click a tool icon to draw it
- Click the settings strip below the icon to open its parameters
- Adjust timeframe, periods and display with the arrow and toggle controls
- Enable popup, push or email alerts if needed
- Drag the panel to an edge and collapse it once configured
- Save the chart as a template to reuse the setup elsewhere
Tool details
Triple MA
- Period, timeframe, method and applied price set per line
- Each line can be hidden while the others stay active
- Cross alerts follow the visible lines and cover all three line pairs
Bollinger Bands and ZigZag
- Both can run on a higher timeframe than the chart
- ZigZag needs no extra indicator file and no iCustom call
Support and Resistance
- Zone height is a percentage of ATR, so one setting works across low- and high-volatility symbols
- Lookback is expressed in bars of the analysis timeframe
- Zone labels can be shown or hidden
Pivot Points
- Up to 50 historical pivot periods, each bounded to its own period
- Resistance and support levels display independently
- Current-period levels can extend to the chart's right edge
Sessions
- Asia, Europe and New York sessions selected individually
- Broker GMT offset is automatic or manual
- Number of past sessions shown is configurable, with an optional daily high and low
Daily News
- MQL4 has no built-in economic calendar, so events come from the free FxTT News Feed companion, attached once to any chart in the terminal and shared by every ChartDeck PRO chart there
- Events are filtered by currency and by high, medium or low impact
- The panel shows upcoming events with a countdown and a configurable number of past events
- A read-only Feed field reports status as OK, Stale, No feed, Blocked or Bad file
- Panel corner and row count are set in the drawer
Symbol and timeframe compatibility
ChartDeck PRO runs on any symbol and timeframe in MetaTrader 4, including forex, metals, indices and commodities. Each chart stores its own configuration. Moving averages, Bollinger Bands, ZigZag, support and resistance and pivots work on all timeframes. Sessions applies to intraday charts, since one D1 candle already spans a full trading day.
Input parameters
Panel
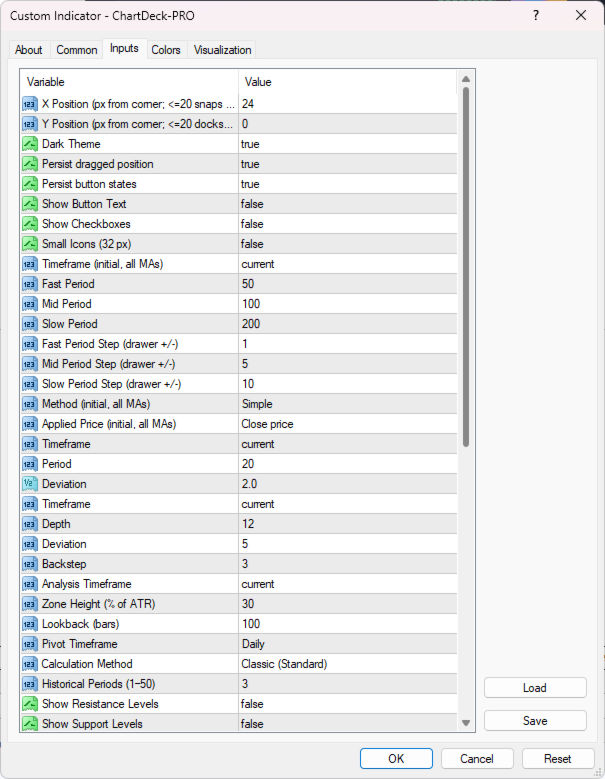
- Screen position, dark theme, icon size, button text, checkboxes
- Persistence of dragged position and of button states
Tools
- Triple MA: timeframe, three periods, per line stepping, method, applied price
- Bollinger Bands: timeframe, period, deviation
- ZigZag: timeframe, depth, deviation, backstep
- Support and Resistance: analysis timeframe, zone height in percent of ATR, lookback bars
- Pivot Points: pivot timeframe, calculation method, historical periods, level display, extension
- Sessions: automatic or manual GMT offset, sessions to show, session selection, daily high and low
- Daily News: currencies, days to load, impact filters, panel rows, panel position, read-only feed diagnostic
Alerts
- Startup state of popup, push and email delivery for every tool
- Moving average cross alerts, news alerts and news lead time in minutes
Frequently asked questions
Does the indicator generate buy or sell signals?
No. It draws standard analysis tools and reports the events you enable through alerts.
How many indicators are loaded on the chart?
One. All seven tools run inside a single ChartDeck PRO instance.
Can I use only some of the tools?
Yes. Only the tools switched on in the panel are calculated and drawn.
Can a tool run on a higher timeframe than the chart?
Yes. Each tool has its own timeframe field, which can be set to any period at or above the chart period.
Does it repaint?
Completed values don't change. The current ZigZag leg can still move while the forming bar develops, as with any swing-based method.
Which timeframes does the Sessions tool cover?
Intraday charts, where session high and low levels are separated on the time axis.
Where does the news data come from?
MetaTrader 4 has no built-in economic calendar. Daily News reads a local file kept current by the free FxTT News Feed Expert Advisor, a separate program attached once to any chart. The indicator itself makes no internet requests.
Does Daily News need anything beyond the indicator?
Yes, once: attach the free FxTT News Feed Expert Advisor to any chart in the terminal, and allow its calendar address in the terminal's WebRequest settings. One instance serves every ChartDeck PRO chart in that terminal; the indicator's Feed field confirms when data is flowing.
Are settings shared between charts?
No. Each chart keeps its own panel position, active tools and parameters. A chart template copies a configuration to another chart.
How can I get support?
Through MQL5 product comments and MQL5 messaging, in English and Spanish.
Important notes
- This is a chart analysis and alert tool. It places no orders and requires no Algo Trading permission
- No DLL and no internet connection are used by the indicator itself
- Daily News depends on the free FxTT News Feed Expert Advisor and a local file it maintains; without that companion running, Daily News shows no events rather than failing
- Push notifications require a MetaQuotes ID in the terminal, and email alerts require the terminal mail settings
- Panel position, active tools and parameters are stored per chart and can be switched off in the inputs