Indicator Test Report MT4
- Utilities
-
Narayanan Mohanan Mohanan Krishnan
 I build measurement tools for MetaTrader. They describe what the market has done, and state the limits of each measurement rather than hiding them.
 - Version: 3.10
Indicator Test Report for MetaTrader 4 — an MT4 repaint checker and indicator tester that shows how any indicator actually behaves
You cannot see inside a compiled indicator. The Indicator Test Report loads any indicator — bought, written, or built into MetaTrader — and answers the question a description cannot: does it repaint, how much history does it need, and what does it really publish? It reports behaviour. It does not grade.
Load any indicator into the Strategy Tester and get a plain-language report on twelve aspects of its behaviour: how many buffers it publishes, how much history it needs before its values mean anything, whether values on closed bars ever change afterwards, and what it costs to read.
There is no score, no pass mark and no verdict on whether an indicator is good — only what was observed, and what that does and does not prove.
What it answers
1. Buffers. How many numbered data series the indicator actually publishes, and the highest index that responds. This is often more than the chart shows: a two-line indicator may publish six buffers, and an EA reading by index needs the real number. Where the indices are not contiguous, the report says so — indexing by counting would read the wrong series.
2. Calculation state. How many bars the target has computed against how many exist. Zero with populated buffers is a real, named state, not an error.
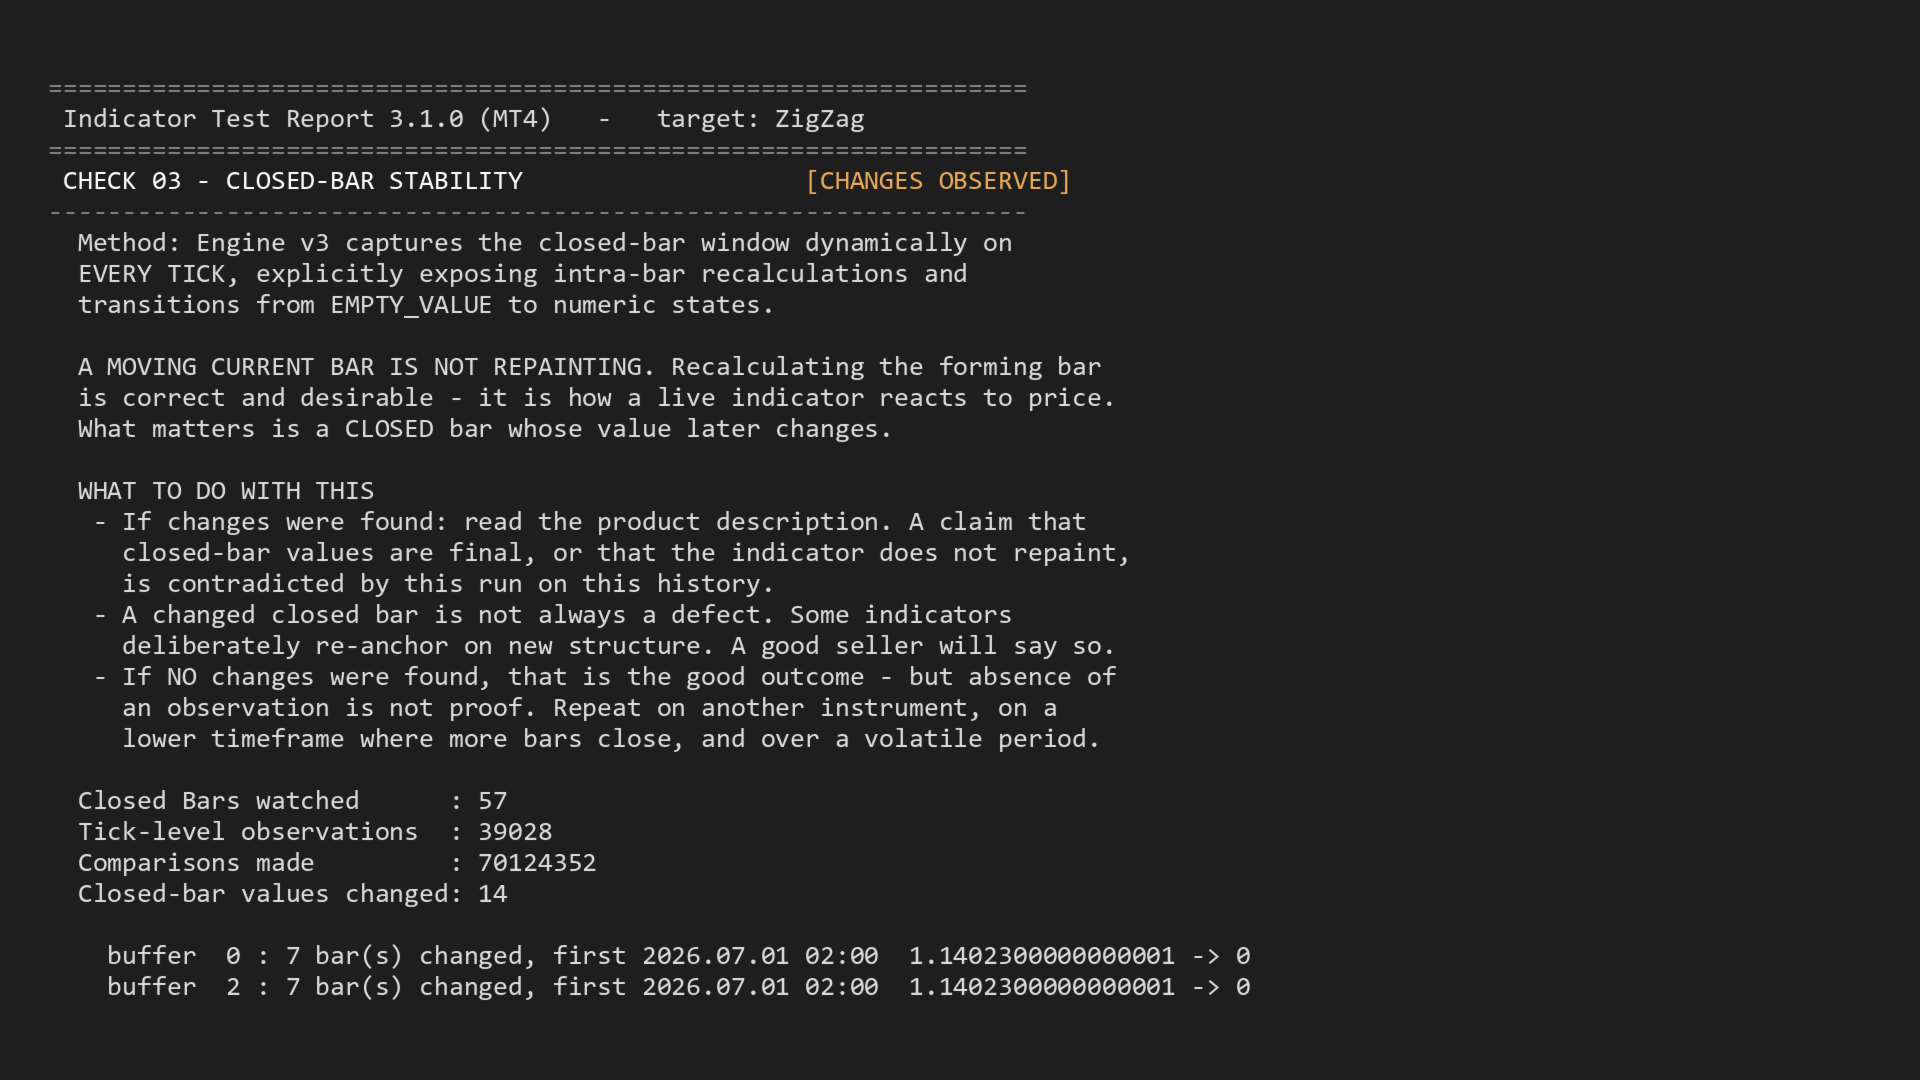
3. Closed-bar stability. The first value seen for each bar is frozen, then compared against every later read. If a value on an already-closed bar changes afterwards, the report gives the bar time, the buffer index and both values. A moving current bar is not repainting — recalculating the forming bar is correct and desirable. What matters is a closed bar whose value later changes.
4. Warm-up. The number of bars each buffer needs before it holds any value at all, measured at the oldest bars available rather than in the recent window where every answer would be zero. Buffers legitimately differ: a signal line needs more history than the series it smooths. The first fifty bars on your chart may not be meaningful yet.
5. Intrabar signal flicker. Whether the forming bar flashes between empty and a numeric signal before closing. Normal for a signal indicator; it matters if your EA acts on the forming bar.
6. Buffer access cost. The microsecond cost of retrieving values, per bar, so you can budget an EA that reads several values per tick. Relative figures for comparing indicators, not absolute VPS numbers.
7. Output domain. The smallest and largest value each buffer emitted, to sixteen decimal places — for sizing thresholds in an EA. These are the observed range, never the possible range.
8. Signal persistence. For arrows, dots and flags: if a value appeared on the forming bar, was it still there at the close? Continuous lines score 100% by construction and are marked as such, because that number is arithmetic rather than a finding.
9. Not-a-number values. Whether any buffer emitted a value that is not a number. Every comparison against a NaN is false — including greater-than and less-than — so a threshold test never fires and reports no error, and any arithmetic touching one produces NaN in turn. This is a defect in the target, and it is invisible to a guard written against EMPTY_VALUE alone.
10. Chart object footprint. How many chart objects appeared while the target ran, and — on a live chart — how many were still there after it was removed. Panel, zone and dashboard indicators draw with objects rather than buffers, so for those products every other check measures the empty half. An indicator that does not clean up leaves debris you clear by hand.
11. Model dependence. Run twice with only the tester model changed. Every Tick and 1-Minute OHLC are different simulated price paths, so an indicator that deliberately reacts to intrabar movement can legitimately differ. It matters when the target claims closed-bar values are final.
12. History dependence. Run twice with only the date range changed. A difference means the target reports different values for the same bar depending on how much history preceded it — the defect that makes a backtest disagree with a live chart.
Try it on something you already know
It reads anything reachable through iCustom, including MetaTrader's own indicators. Point it at ZigZag: everyone knows ZigZag repaints, and the report will show you the bars that changed and both values. Point it at Ichimoku and watch the two future-shifted spans behave differently from the three that are not. Checking the tool against an indicator whose behaviour you already know is the fastest way to decide whether to trust it on one you just bought — and it costs nothing.
How this tool was tested
Every check was verified against purpose-built indicators that misbehave deliberately: one that rewrites every bar in its history on every tick, one that emits not-a-number values, one that needs 399 bars of warm-up, one that leaves chart objects behind when it is removed. The checks caught them, with the bar times and the before-and-after values. A tool that reports on other people's indicators should be able to say how it was tested itself.
The engines are also run against each other. The same indicator measured on MetaTrader 4 and MetaTrader 5 agrees on ten of the twelve checks; the two that differ are platform facts, labelled in the report — MetaTrader 4 has no BarsCalculated and no way to unload an indicator early, so those checks say what they could not measure rather than reporting a comfortable zero.
If you write indicators rather than buy them
The same report answers a different question: what does my own product actually do, and can I say so in the description? A claim that closed-bar values are final is worth more when it comes with the number of comparisons behind it — and it is better to find a repaint yourself than to have a reviewer find it.
Run it on both platforms and the pair will show you where your MT4 and MT5 builds diverge: different buffer counts, a warm-up that moved, a value that changes on one and not the other. That divergence normally reaches you as a one-star review from someone who bought both.
The generated snippet is the integration documentation you would otherwise write by hand — every buffer named, with its warm-up, its range, and whether it goes empty. Ship it, or paste it into your own description. It is your product's behaviour, measured, not a claim.
What it does not do
It will not tell you whether a signal has an edge, whether an indicator is worth buying, or whether a strategy is profitable. It does not grade, score or rank. It does not read source code — only observable behaviour through the documented buffer interface. It runs the target on its own default inputs.
A finding is not a fault
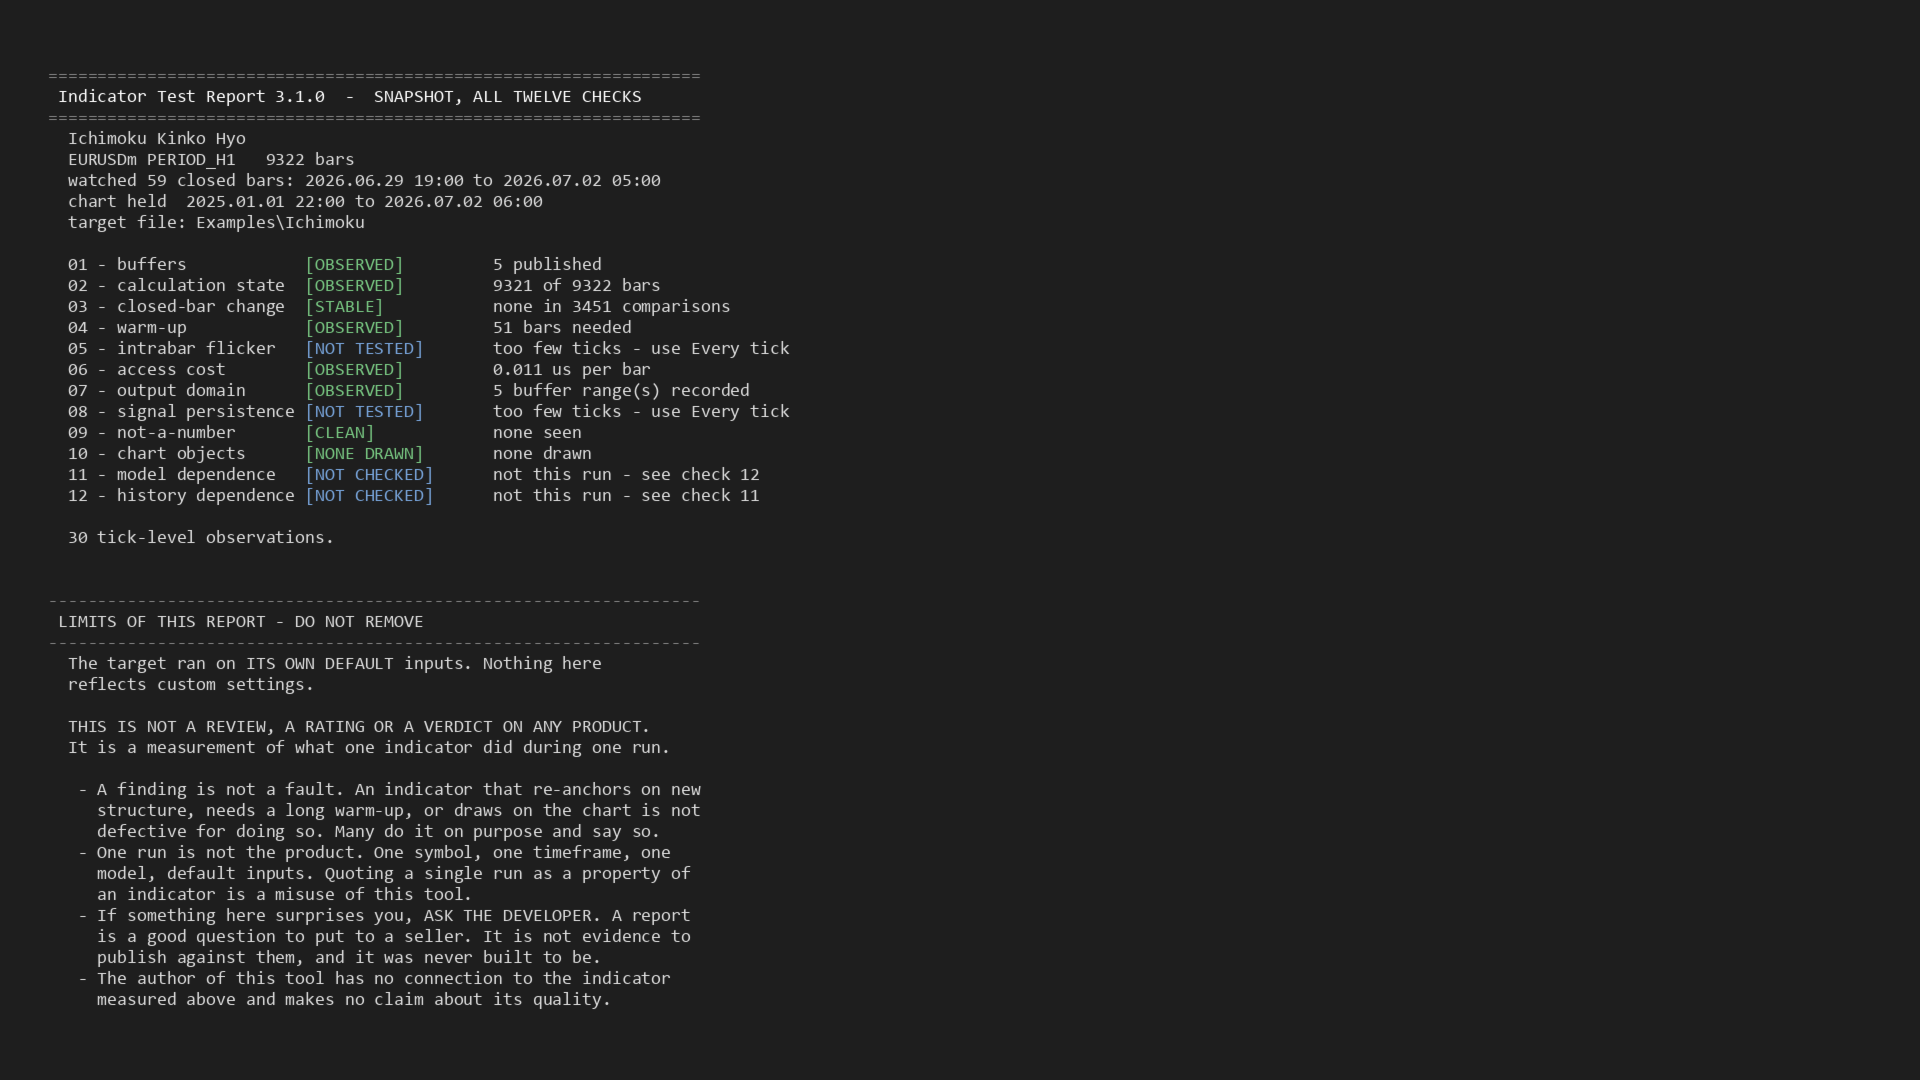
Repainting, a long warm-up, intrabar movement and chart objects are design choices, and many good indicators make them deliberately. This tool measures what happened; only the seller's own description can say whether it was intended. Every report carries that sentence, and one more: if something surprises you, ask the developer. A report is a good question to put to a seller. It is not evidence to publish against them, and it was not built to be.
A clean result is not proof
Every Indicator Test Report says so in its own text. One run is one symbol, one timeframe, one period, one tester model. The report states which checks a given run could not test — a run with too few ticks cannot test intrabar behaviour, and it says so rather than reporting a comfortable zero. Absence of an observation is not proof of absence.
Each report ends with a one-screen summary of all twelve checks, plus a table of every earlier run on the same target, so several runs across different conditions can be read as a set.
Inputs
- Indicator name — the target, exactly as it appears in the Navigator, including its folder. A Market product sits under Market\ and its own name; the MetaTrader samples under Examples\. Getting this wrong is the one mistake that stops the run, and the report says so in plain language rather than failing silently.
- Wait for this many bars first — the report does not start until the chart holds this much history. Default 500.
- Closed bars to watch for repainting — how far back each tick re-reads and compares. This is the depth of check 3. Default 300.
- New bars to watch before reporting — the sample size. The run ends after this many bars have closed, so a smaller number is a weaker test, not a shortcut. Default 200.
- Max history to probe for warm-up — how far back to look for the first real value on each buffer. Default 10000.
- Tolerance for numeric repaint checks — below this a difference is treated as floating-point noise rather than a change. Scales with the magnitude of the values, so a price series and a volume series are judged on the same terms. Default 0.00000001.
- Baseline: Auto / Lock / Reset — decides what a second run compares against. Auto is what most people mean by running a target twice: the first run sets the reference and later runs compare without replacing it. Default Auto.
- Run label — how you declare what you changed between two runs. MetaTrader gives a program no way to see which tester model is running, so the label is the only way the report can tell a model change from a repeat.
- Target display name — a readable name for the report header. The file path is still shown beside it, because a display name must never replace the identity of what was measured.
- Write a ready-to-use EA snippet — on by default. Turn it off if you only want the report.
- Output file prefix — lets two runs on the same target write to separate files instead of sharing one summary.
What the screenshots show
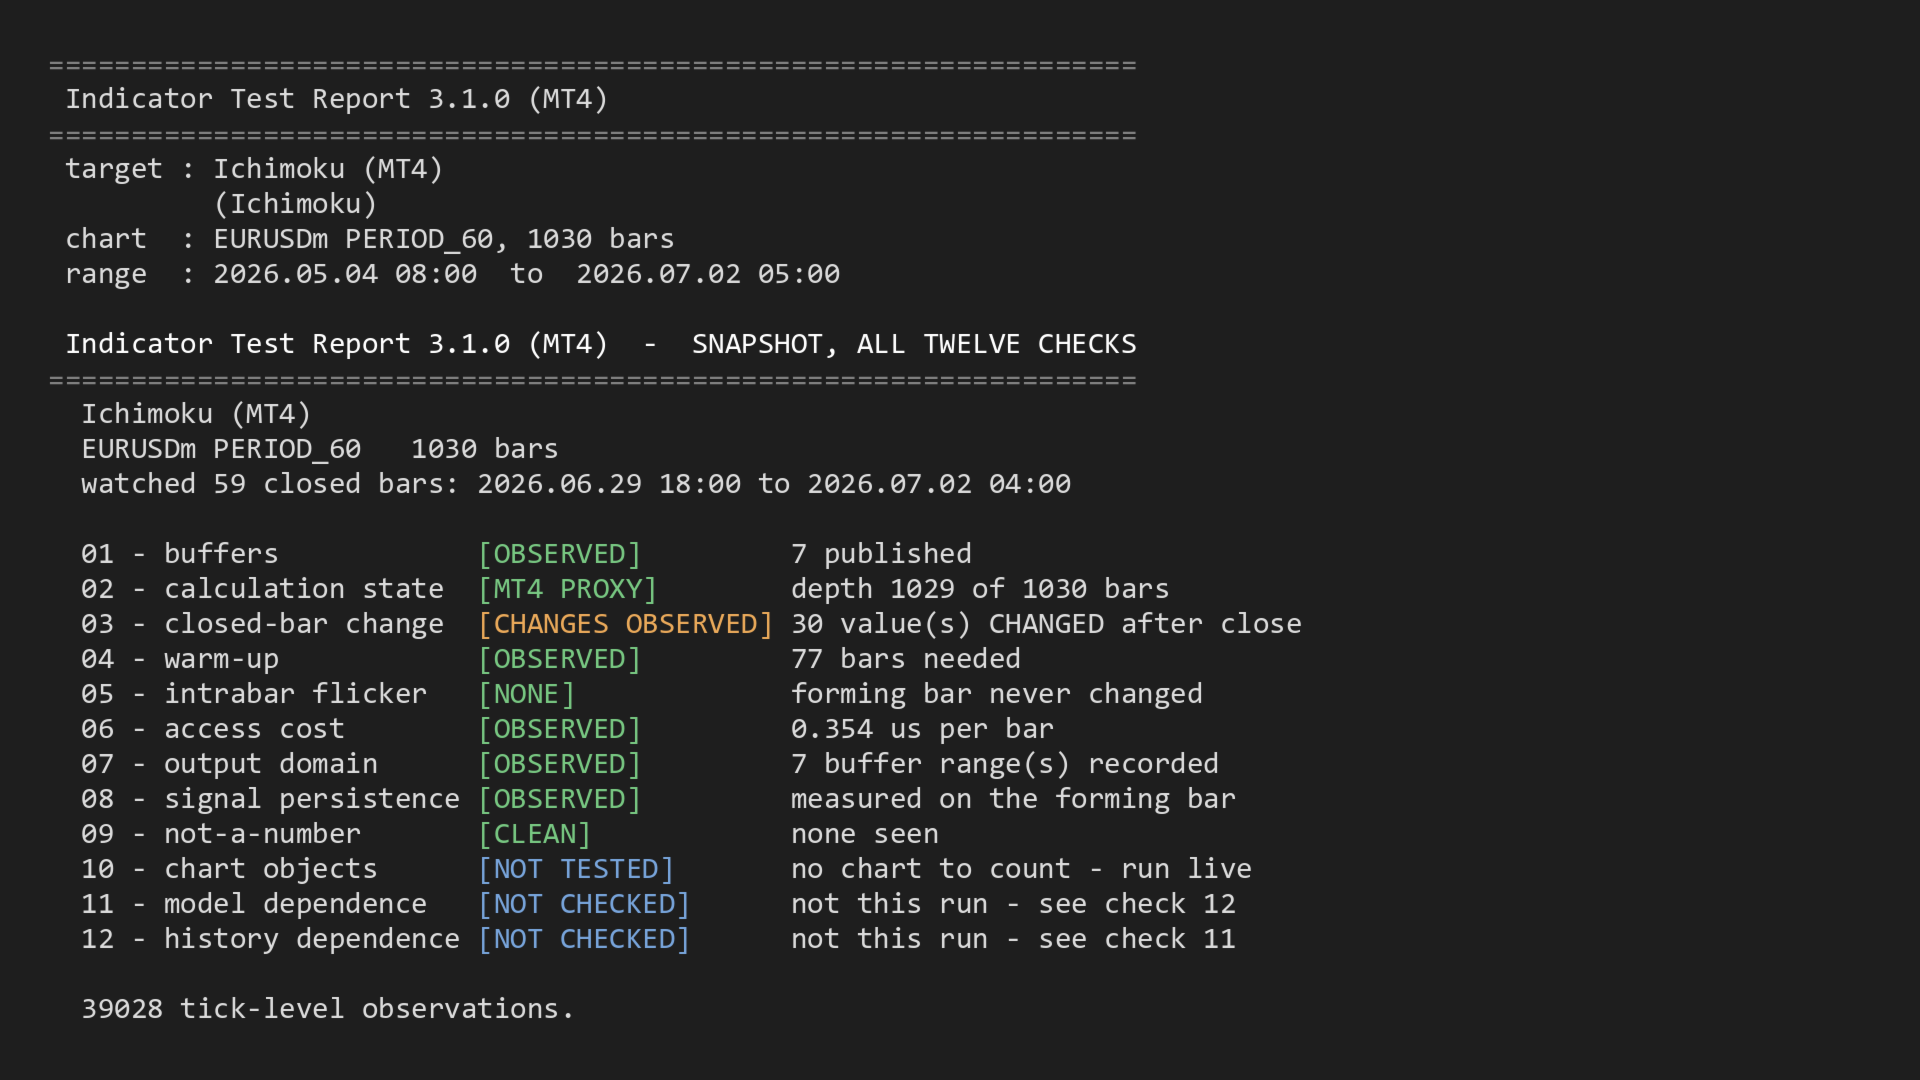
- The snapshot. All twelve checks on one screen — every run ends with this block, whatever else the report contains.
- A finding. A closed bar whose value changed, with the bar time and both values. This is what the tool is for; the rest is context.
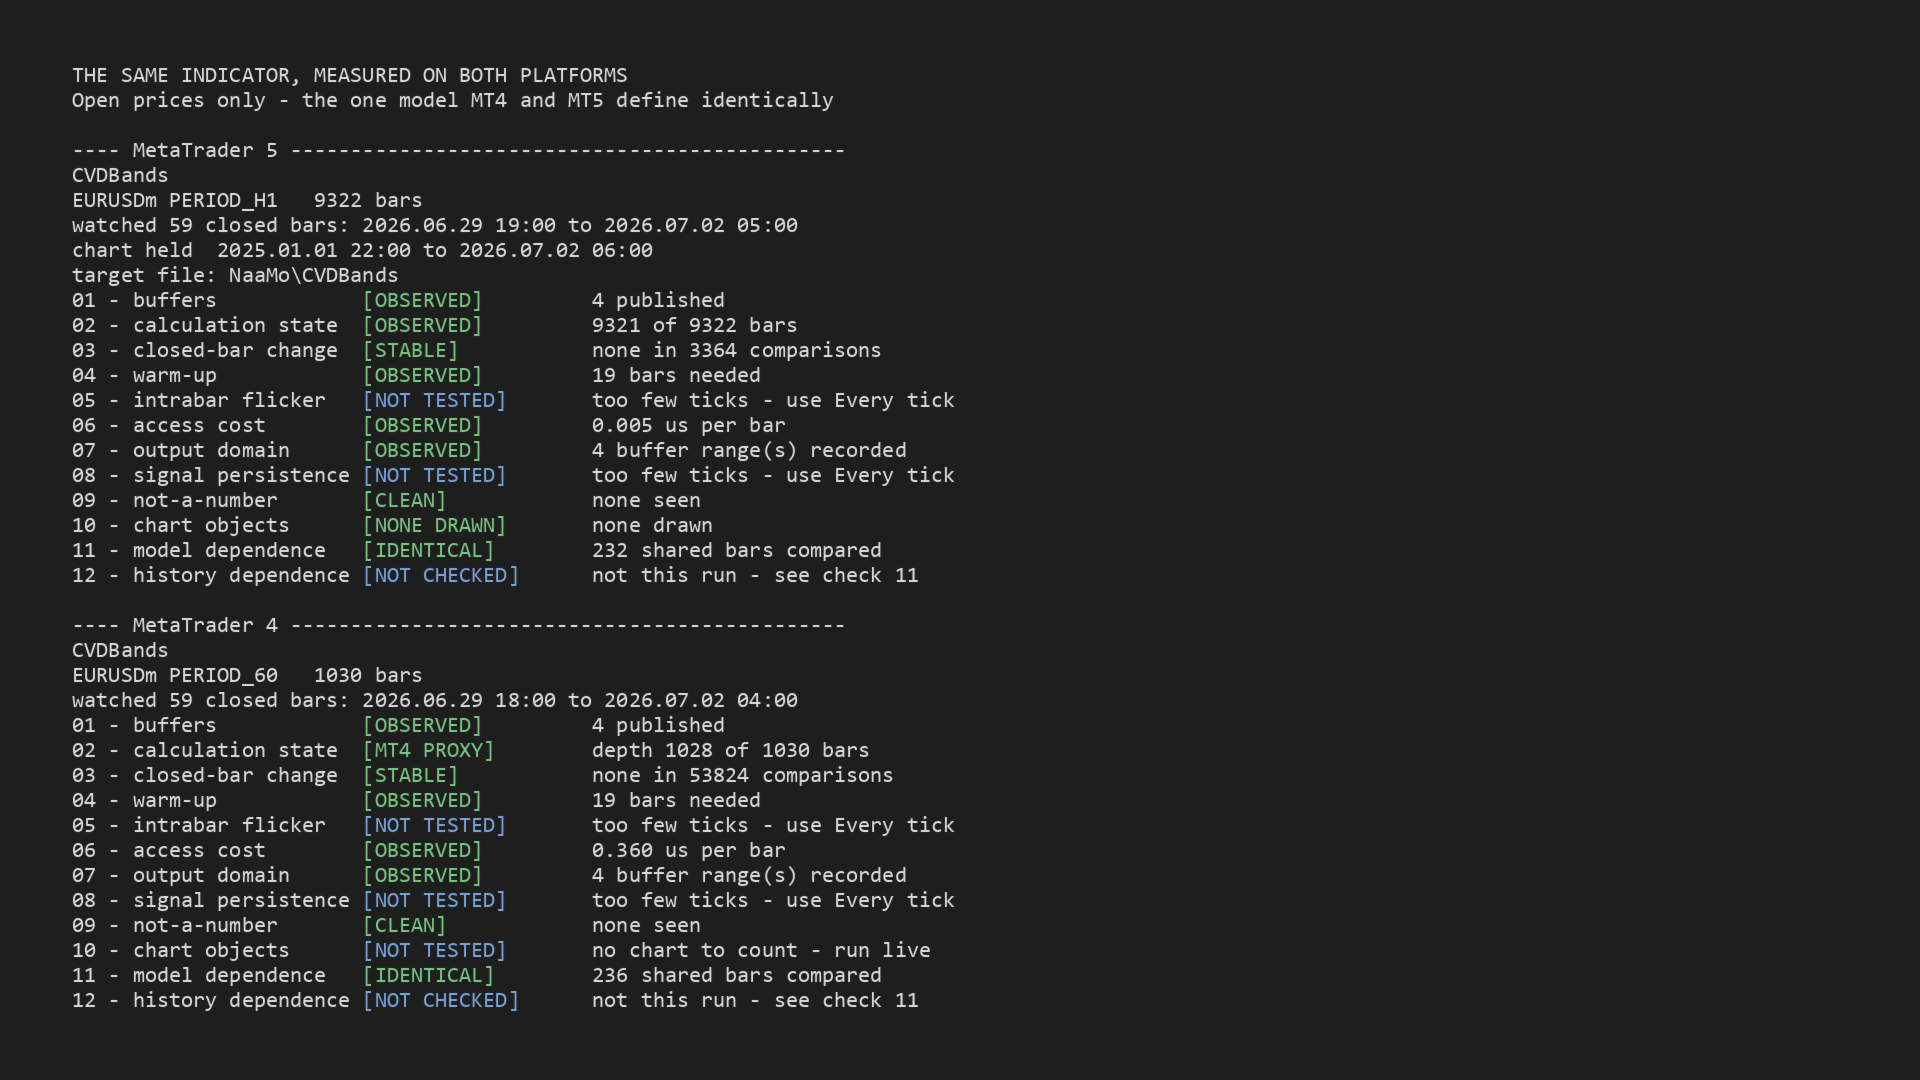
- Both platforms. The same indicator measured on MetaTrader 4 and MetaTrader 5, so the two reports can be compared line by line.
- An honest refusal. A run that could not test something and says so, instead of printing a zero that would read as a pass.
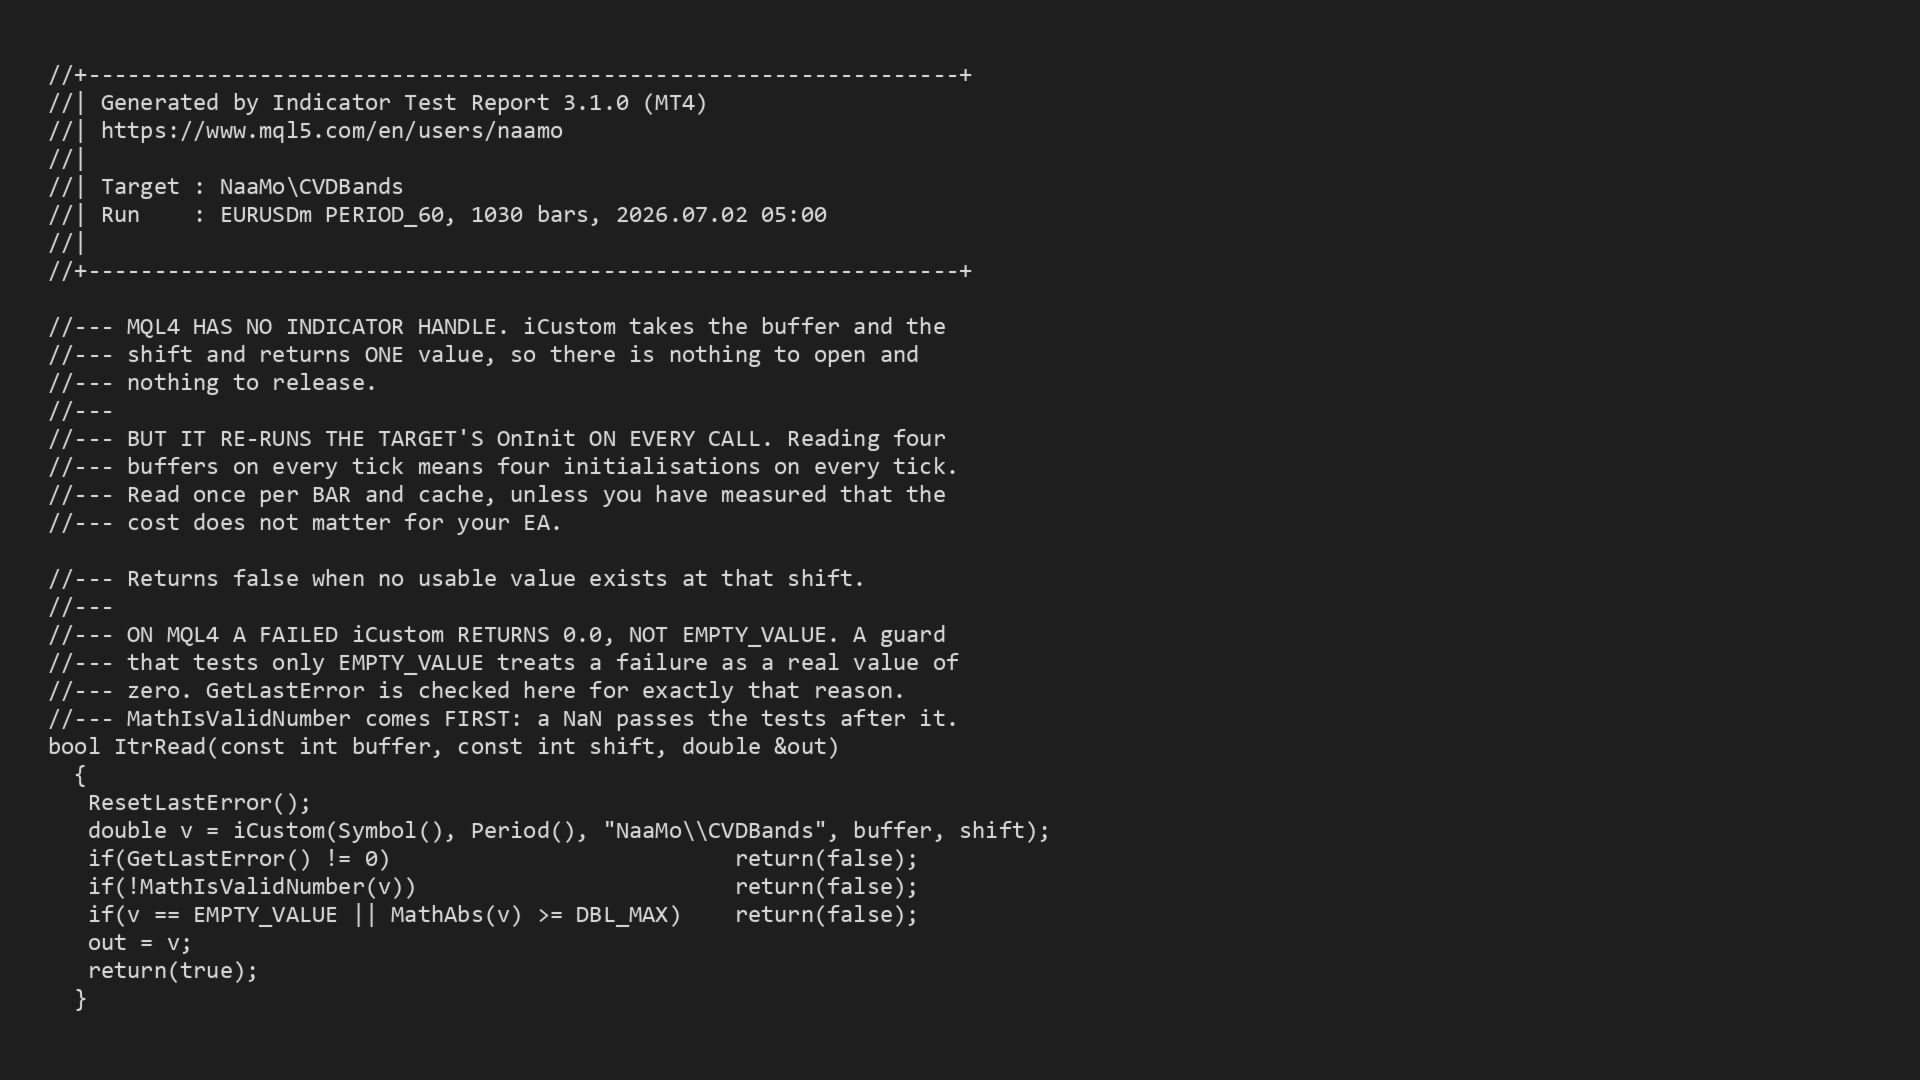
- The generated snippet. A ready-to-use .mqh file written by the run, with every buffer named and a read function already in place.
Reading the screenshots
Amber is not red. An amber verdict means a behaviour was found and here is the evidence, not this indicator is broken. Repainting, a long warm-up and chart objects are design choices, and many good indicators make them deliberately — the report gives you the bar time and both values so you can ask the developer about it, which is what that page tells you to do.
The blue verdicts are the ones worth understanding. [NOT TESTED] and [NOT FOUND] mean the run could not measure something — too few ticks, or a scan that reached its ceiling. They are not passes. Most tools would print a comfortable zero there; this one tells you the question was not answered, which is the difference between a measurement and a reassurance.
The parity image shows the same indicator measured on both platforms so the two reports can be compared line by line. The finding shown in the images comes from a deliberately broken test indicator written for the purpose, not from a product on the Market.
About the screenshots. Every image is captured from a real run: the reports are the files the tool writes, not mock-ups. These images are captured on MetaTrader 4, because two of the twelve checks legitimately read differently there and showing MetaTrader 5 output in an MetaTrader 4 listing would misrepresent it. The parity image shows both platforms side by side on the same indicator: ten of the twelve checks are identical, and the two that differ are named in the report. Those two are a matter of what the PLATFORM can provide, not of how carefully the port was written: MQL4 has no BarsCalculated function, and no way to unload an indicator early. Nothing was left out of the MetaTrader 4 build — it reports everything MetaTrader 4 is capable of reporting, and says so where it cannot. This tool is built to state what it could not measure, and that applies to its own listing first.
Output
A text report, a CSV baseline for cross-run comparison, and an accumulating summary — one row per run — written to the shared Files folder so they survive between runs. Every differing value is written to its own CSV when a comparison finds one.
And a ready-to-use code snippet: a compilable .mqh naming every live buffer, its warm-up, its observed range, and whether it goes empty — with a read function already written for the platform you ran on. It is what a caller would otherwise discover by trial. If the run found closed-bar changes or NaN values, the snippet says so at the top and points its example at a buffer with no finding against it.
Credit where it is due
The buffer-reading approach follows ICustom Indicator Tester by Piotr Latoszynski, free in the Market since 2020. The freeze-and-compare method for detecting changed closed-bar values was described by Brahim Ben Abla in mql5.com post 772704 (17 July 2026), with real numbers; the method is his, only the shipping is mine.
What differs on MetaTrader 4
Ten of the twelve checks read identically to the MetaTrader 5 build on the same indicator. Two cannot: MQL4 has no BarsCalculated, so the calculation state is an empirical probe and is labelled [MT4 PROXY]; and MQL4 cannot unload an indicator early, so the chart-object cleanup question is answered only on a live chart and reads [NOT TESTED] in the Strategy Tester. Both are named in the report rather than hidden. Neither is a limitation of this tool or a shortcut in the port: they are the capacity of MetaTrader 4 itself, and the report says which of the two it is looking at rather than reporting a comfortable zero.
Notes
- This is an Expert Advisor that writes a report. It never trades. It places no orders, opens and closes no positions, and touches nothing in your account — it reads an indicator and writes text files.
- AutoTrading must be enabled. MetaTrader gates every Expert Advisor behind that permission whether or not it trades, so with the button off the terminal stops calling the program and you will see no report and no error. Attach it to a demo account if you would rather not enable it on a live one; the result is identical, because nothing here depends on the account.
- Runs in the Strategy Tester, and on a live chart where a check needs real ticks. Reads the target through the documented iCustom interface.
- Some targets that build their own indicator handles internally never report a calculated state. The report names that case rather than reporting a zero.
- Output goes to the shared Files folder, so reports survive between runs and accumulate one summary row each.
- Multiple instances are supported. Two charts can measure different symbols at the same time, and both runs append to the same accumulating summary rather than overwriting each other — tested with two instances finishing one second apart. Give them different output prefixes if you would rather keep the two histories separate.
- No external dependencies. It calls no library and no other indicator.
| More tools from this developer I build MetaTrader indicators and Expert Advisors with an emphasis on clean, documented code — closed-bar logic, validated buffers, and no dependencies on other indicators. This tool exists because I wanted to check that claim on my own work before asking anyone to believe it. Found something in a report you did not expect, or want a check the twelve do not cover? Send me a private message — I am happy to answer. |
Developed and maintained by Narayanan Mohanan, ML/Python/MQL Developer.