OBVCD Pro
- Indicators
-
Narayanan Mohanan Mohanan Krishnan
 I build measurement tools for MetaTrader. They describe what the market has done, and state the limits of each measurement rather than hiding them.
 - Version: 1.20
- Updated: 4 August 2026
- Activations: 10
OBVCD Pro is a momentum oscillator that applies convergence/divergence analysis to On-Balance Volume (OBV) instead of price, combining adaptive volatility bands with a 5-state regime classifier that can be read visually on the chart or consumed directly by an Expert Advisor.
Most classical oscillators analyse price alone. OBVCD Pro calculates convergence and divergence from cumulative volume flow, so it measures the participation behind a market move rather than only the movement itself. The result is reduced to a single regime value that is equally usable by a discretionary trader and an algorithmic system.
How it Works
On-Balance Volume (OBV) is calculated from the selected volume source. Tick Volume is used by default, and Real Volume is applied automatically where the broker supplies it.
A fast and a slow moving average are calculated over the OBV series (EMA 12 and EMA 26 by default). The difference between them forms the OBVCD Histogram. A Signal Line is then calculated over that histogram, using a 9-period SMA by default.
Upper and lower volatility bands are calculated from a 20-period standard deviation with a 1.618 deviation multiplier. The bands can be applied either to the Signal Line or directly to the Histogram.
Because the bands are based on standard deviation, they widen automatically during periods of high market activity and contract when activity falls. This allows one set of default settings to remain usable across very different instruments, instead of relying on fixed thresholds.
The 5-State Momentum Logic
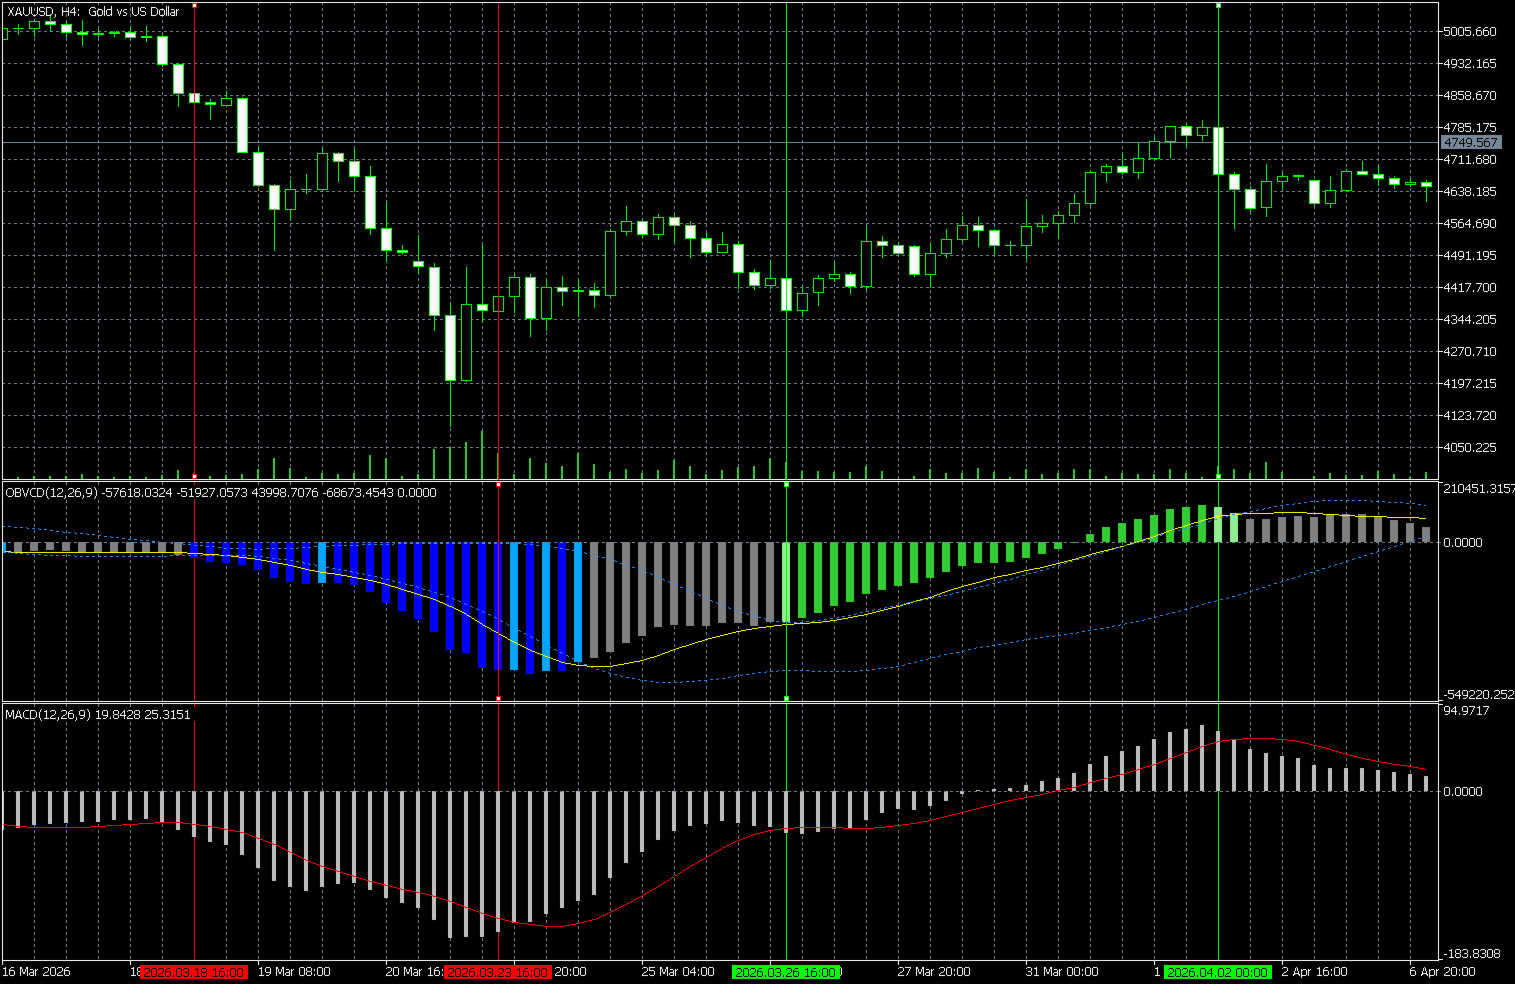
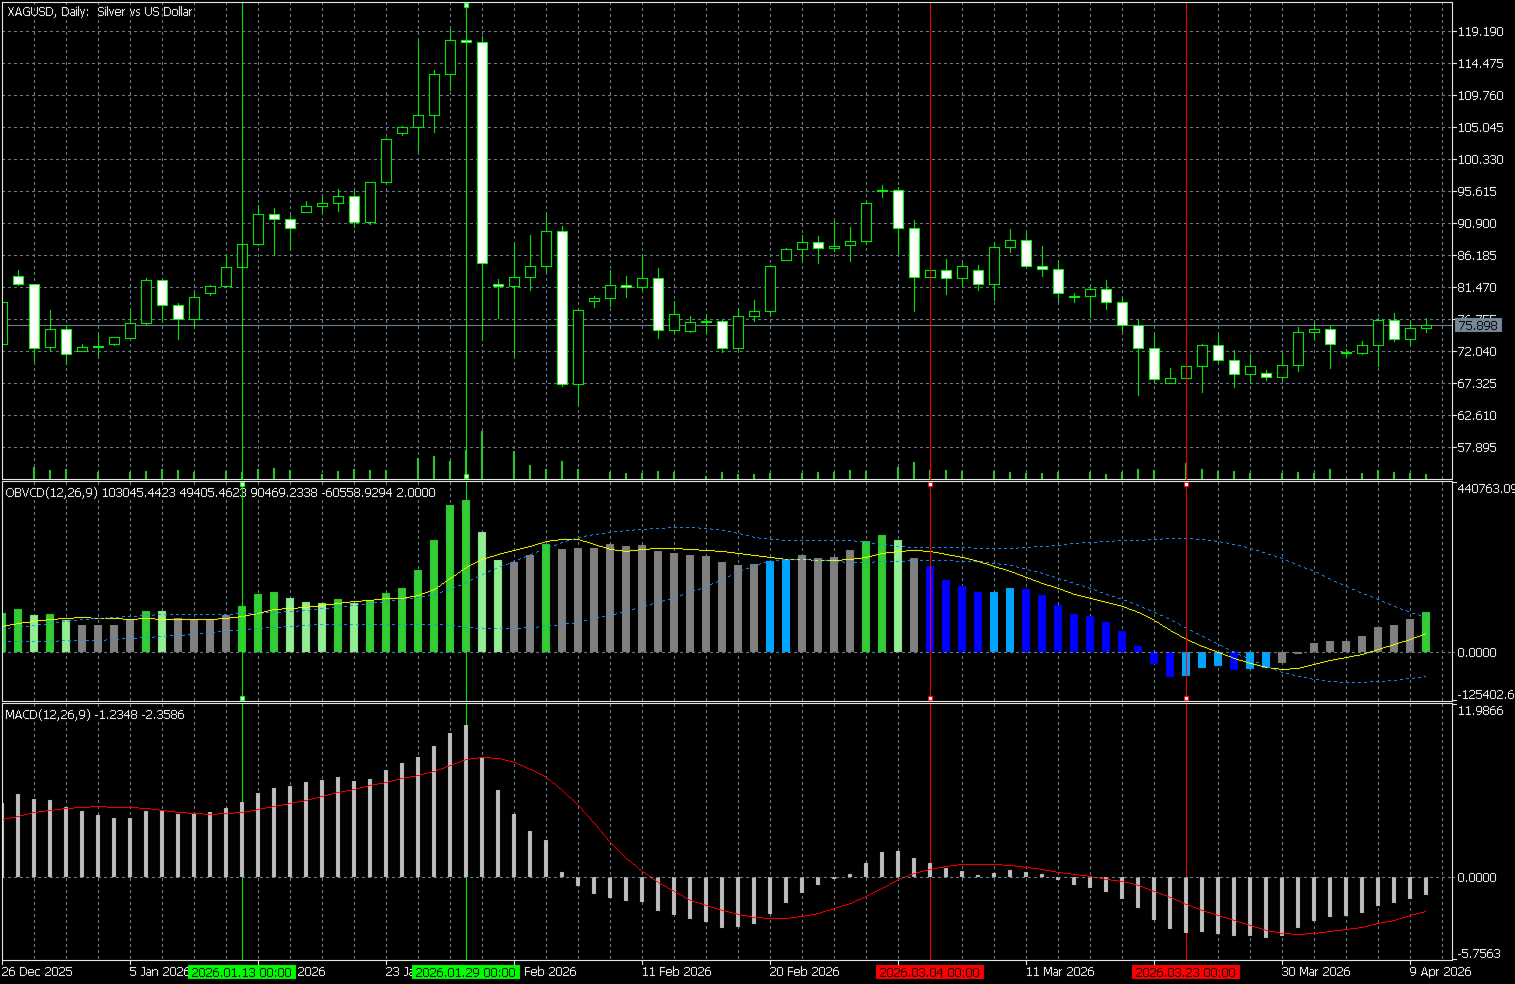
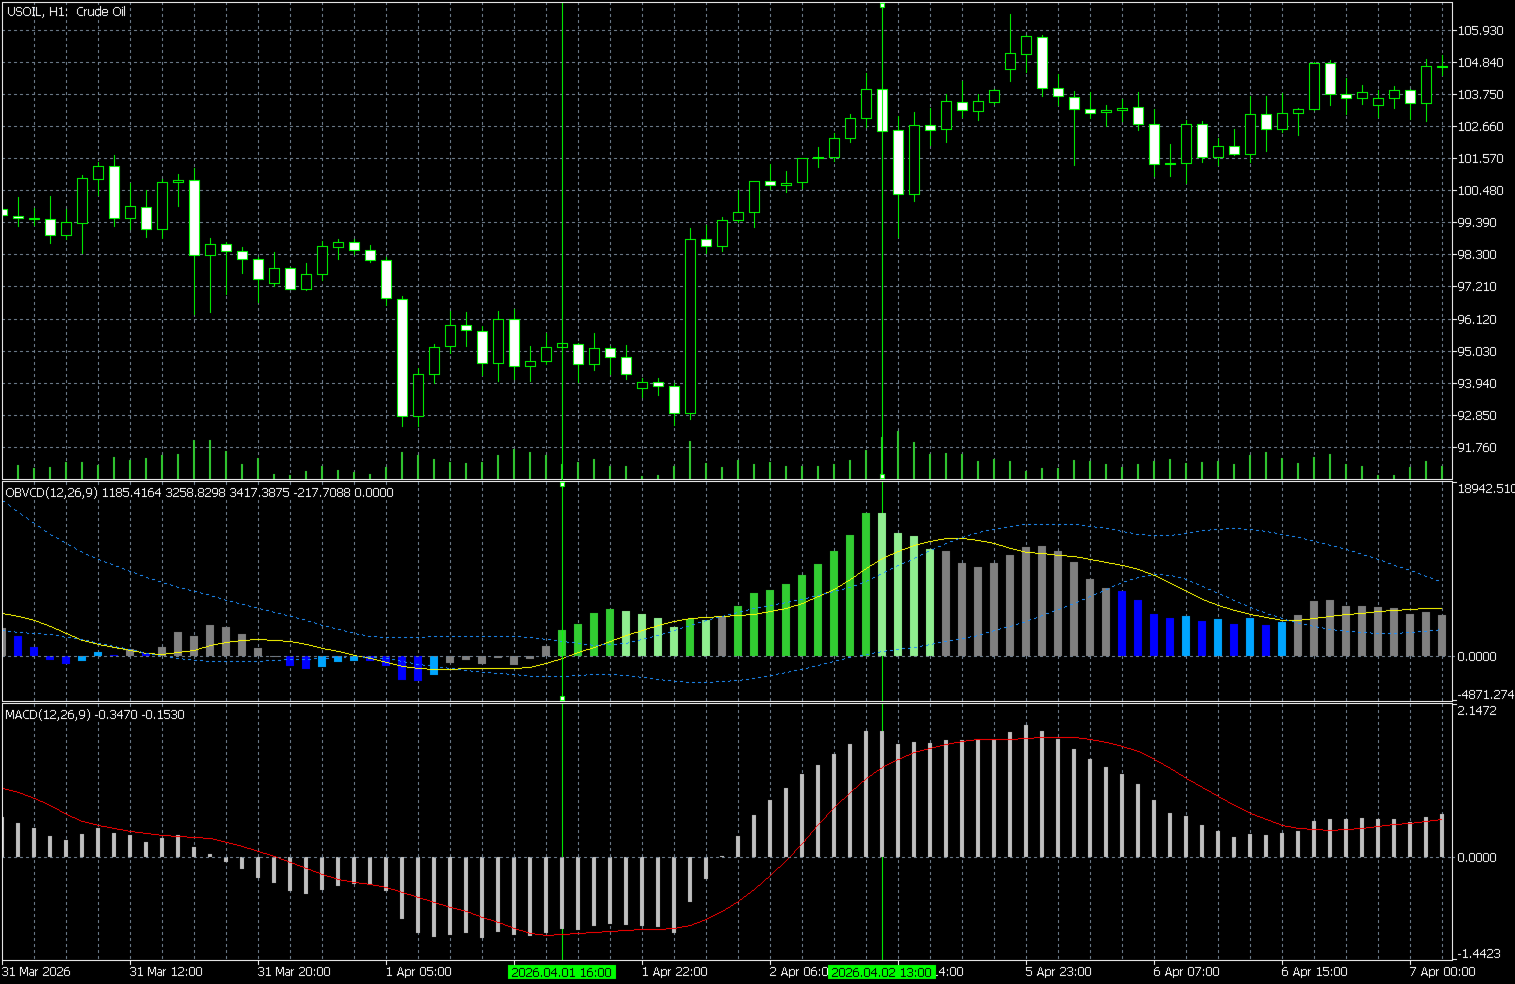
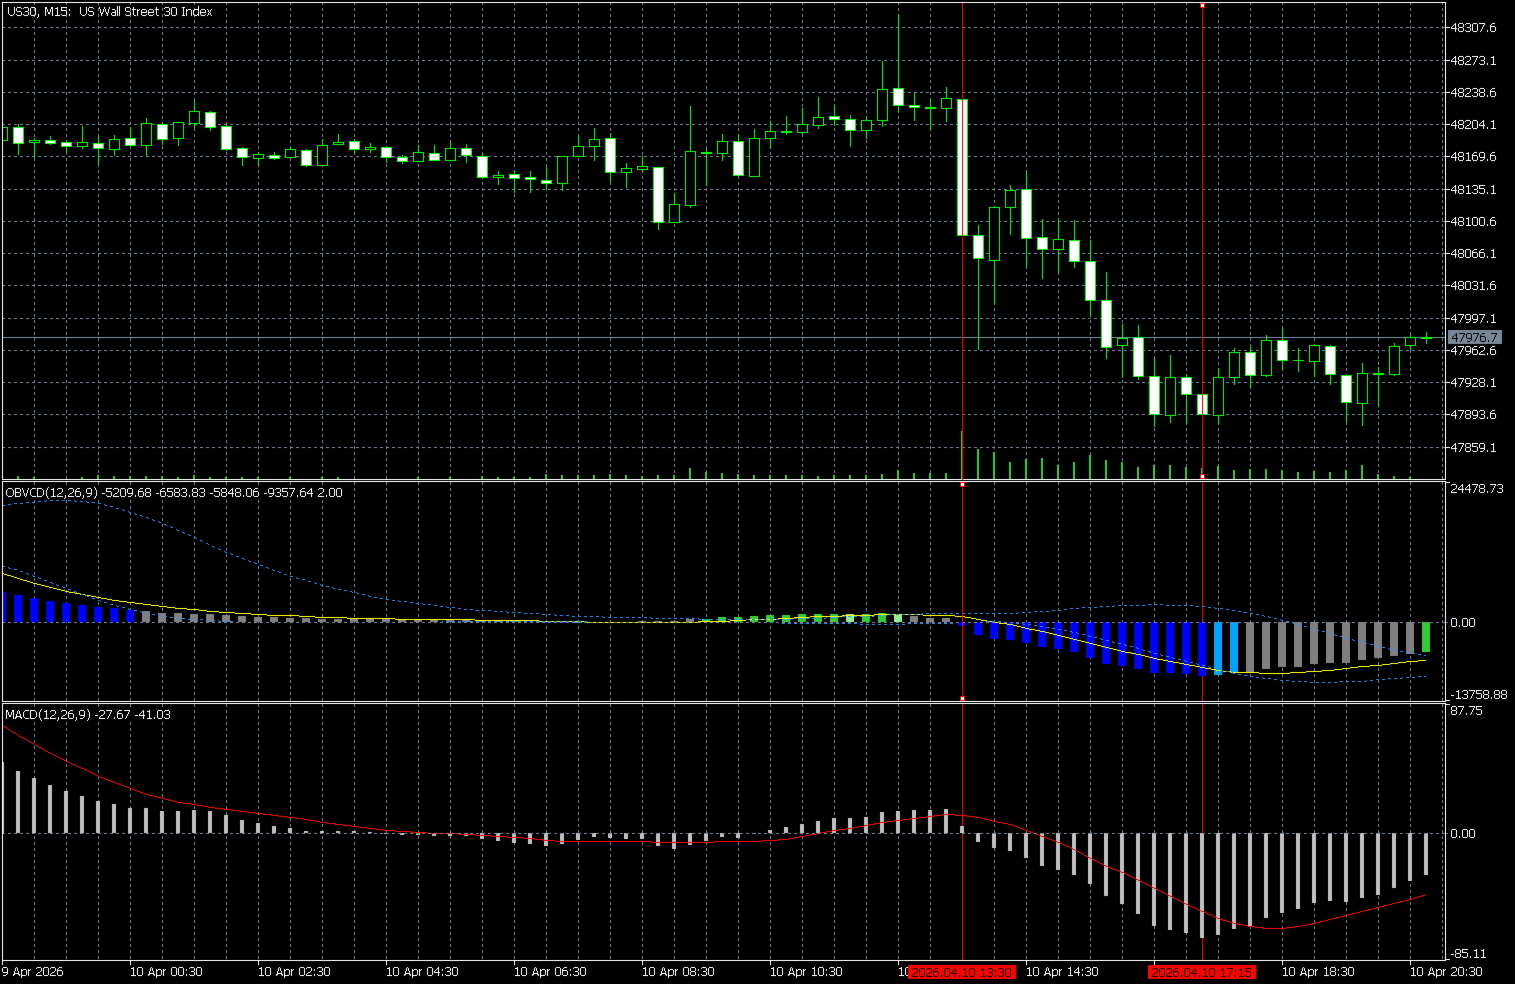
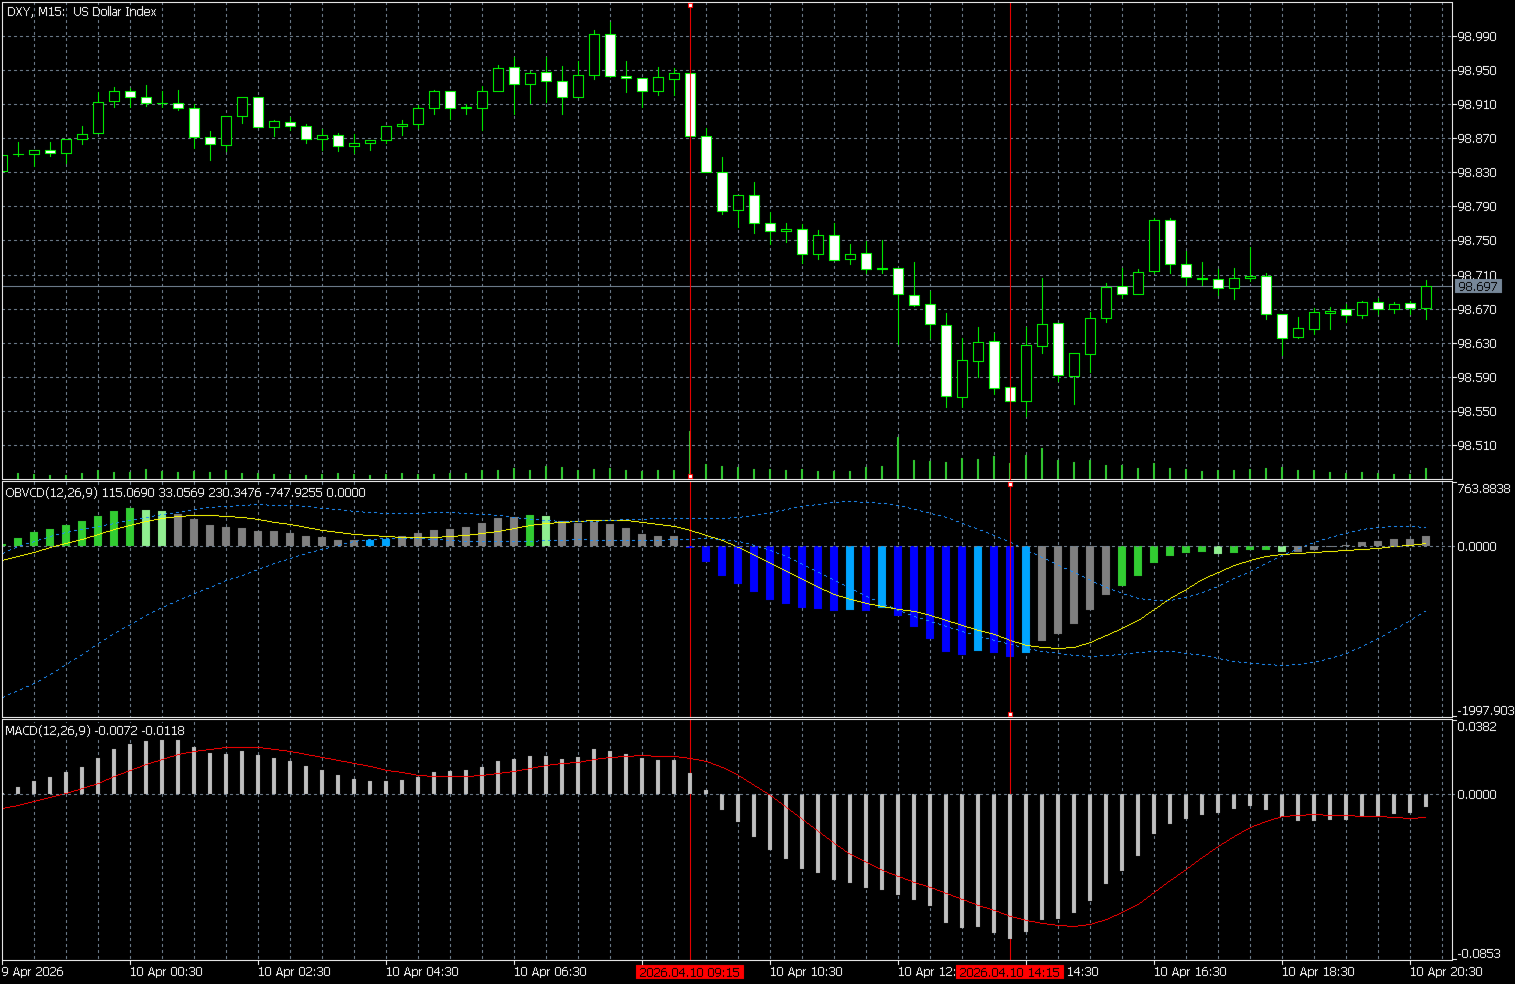
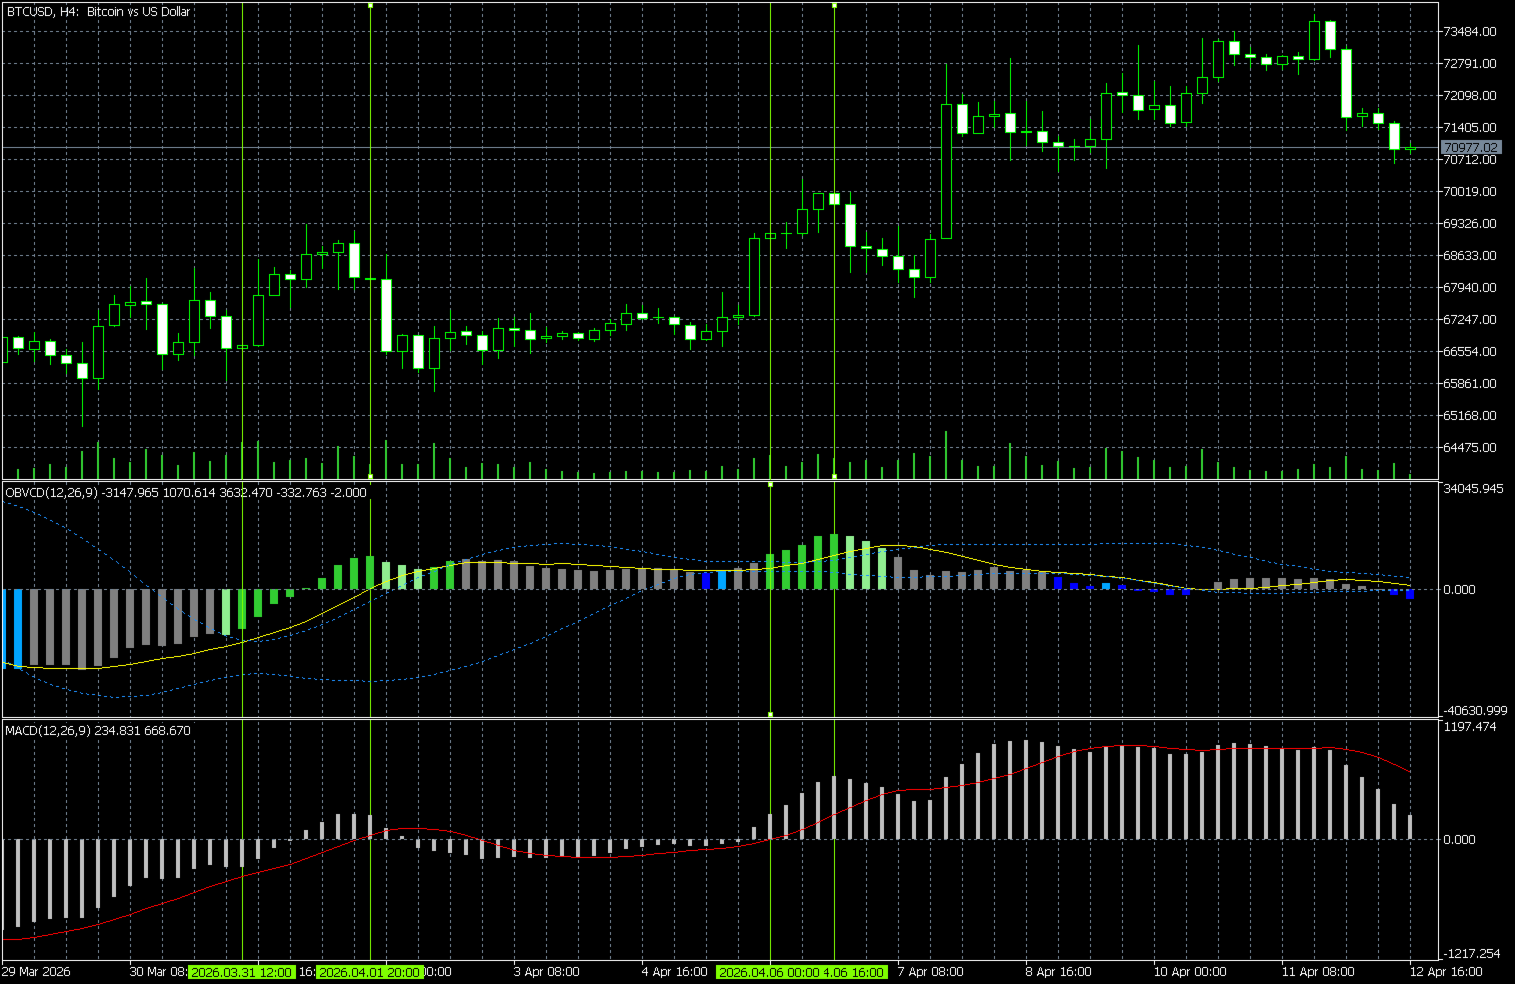
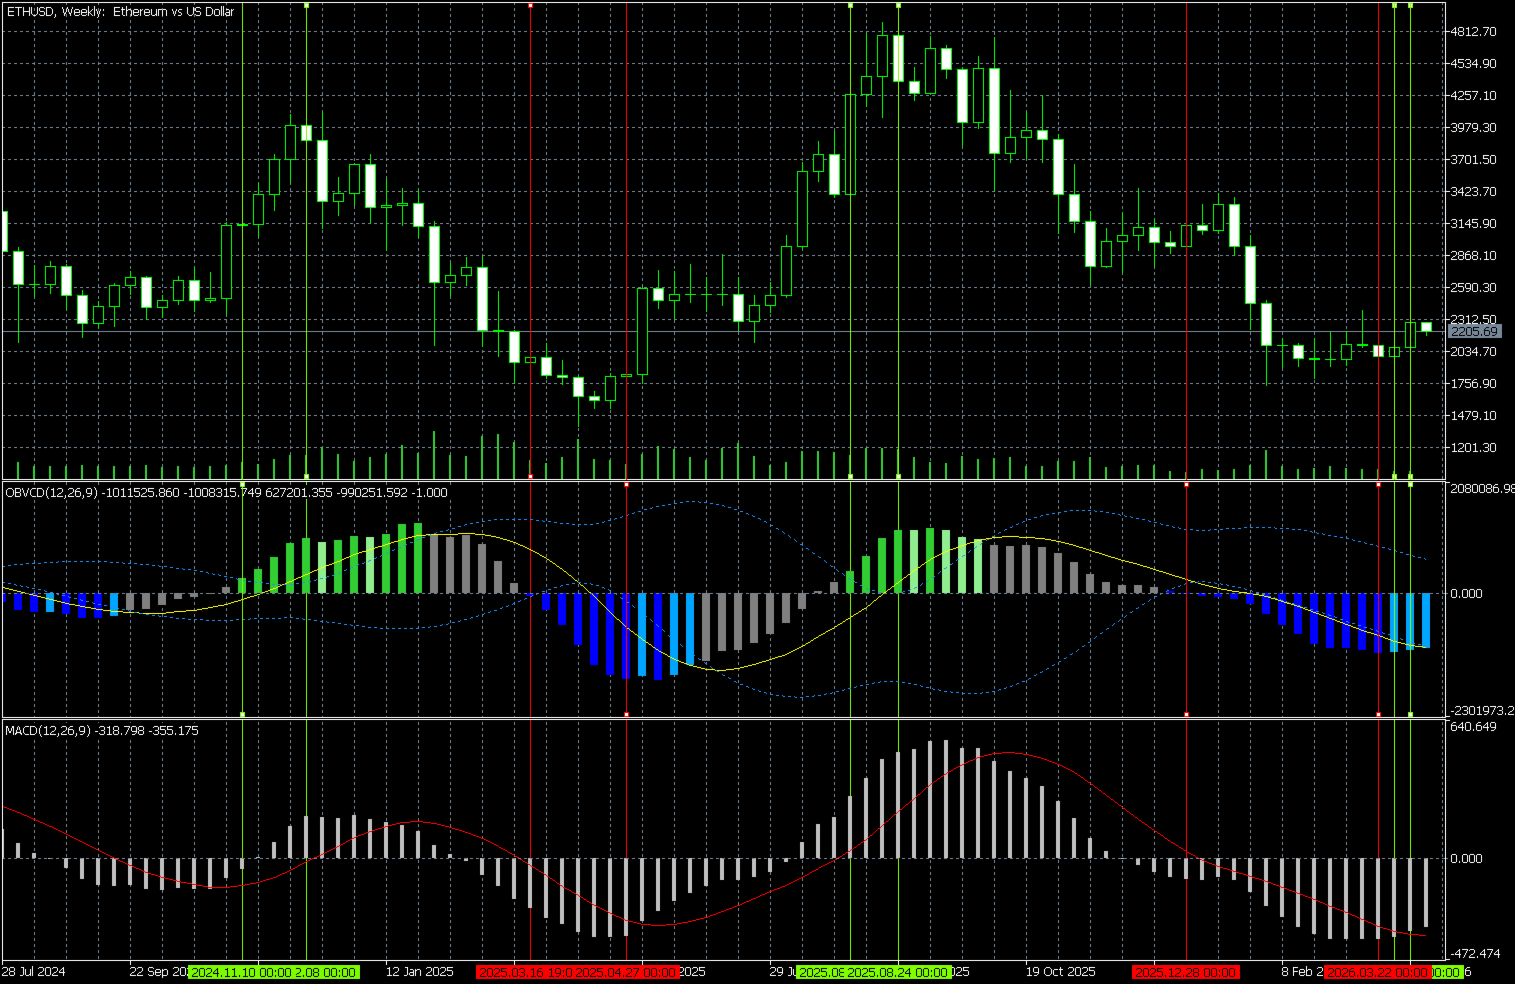
The colour-coded histogram evaluates the position of momentum relative to the adaptive volatility bands and classifies every completed bar into one of five market states.
- Strong Bullish (Lime Green) — the histogram is above the upper band and bullish momentum continues to expand. Value: +2
- Weak Bullish (Light Green) — the histogram remains above the upper band, but bullish momentum is beginning to fade. Value: +1
- Consolidation (Gray) — the histogram is inside the bands, indicating a neutral or ranging market. Value: 0
- Weak Bearish (Orange) — the histogram is below the lower band, but selling pressure is beginning to ease. Value: −1
- Strong Bearish (Red) — the histogram is below the lower band and bearish momentum continues to expand. Value: −2
The key characteristic of this logic is the distinction between a move that is extended and one that is still expanding. A band breach on its own does not indicate that a move retains its strength; the direction of momentum is what separates continuation from exhaustion.
Algorithmic and EA Integration
The calculated market state is written to a dedicated buffer, so an Expert Advisor can read a finished value without inspecting colours and without re-implementing the internal logic.
Buffer 5 returns one of the following values:
- 2.0 = Strong Bullish
- 1.0 = Weak Bullish
- 0.0 = Consolidation
- −1.0 = Weak Bearish
- −2.0 = Strong Bearish
Obtain the indicator handle with iCustom() and read the value with CopyBuffer(). Reading Shift 1 — the last fully completed bar — is recommended, as that value is final and will not change.
Public Buffer Map
- Buffer 0 — OBVCD Histogram
- Buffer 1 — Histogram colour index
- Buffer 2 — Signal Line
- Buffer 3 — Upper Band
- Buffer 4 — Lower Band
- Buffer 5 — Regime Bias
Please note that Buffer 1 holds the histogram colour index, so the data buffers are not numbered consecutively with the visible plots — the Regime Bias is Buffer 5, not Buffer 4. Buffers 6 to 8 are used exclusively for internal calculations and are not part of the public interface.
Inputs
- Volume source — Tick Volume (default) or Real Volume where supported by the broker
- Fast moving average — period 12, EMA by default
- Slow moving average — period 26, EMA by default
- Signal moving average — period 9, SMA by default
- Supported MA methods — EMA, SMA, SMMA and LWMA
- Enable Bollinger Bands — enabled by default
- Bands applied to — Signal Line (default) or Histogram
- Bands period — 20
- Bands deviation — 1.618
With Bollinger Bands disabled, the indicator operates as a classical OBV convergence/divergence oscillator with a signal line, and the Regime Bias returns 0 on every bar.
Cross-Asset Application
The default settings are a reasonable starting point for most instruments. In practice, parameters should be reviewed for the specific instrument and timeframe in use.
- Metals (XAUUSD, XAGUSD) — helps identify volume accumulation and distribution phases as additional context alongside price structure.
- Energy (USOIL) — tracks changes in volume participation during directional market movement.
- Indices and Forex (US30, DXY) — the adaptive bands filter market noise, so a change of state reflects a genuine shift in volume participation rather than a random fluctuation.
- Cryptocurrency (BTCUSD, ETHUSD) — the smoothing keeps readings legible under high volatility, making momentum changes clearer.
Calculation Behaviour
All values are calculated exclusively from completed historical data. Once a bar closes, its values do not change again. Only the currently forming bar updates as new ticks arrive.
For confirmed readings, Shift 1 should be used rather than Shift 0. The indicator uses no look-ahead data and does not repaint values after a bar has closed.
Who it is For
- Discretionary traders who want a volume-participation read to confirm whether a market move is genuinely supported, and to distinguish continuation from weakening momentum.
- Algorithmic traders and EA developers who want a ready-made, documented regime filter with a stable interface, without re-implementing the internal logic.
Notes
- Displayed in a separate indicator window.
- 5 plots.
- 9 indicator buffers.
- A semi-transparent histogram keeps the pane readable when used alongside other indicators.
This indicator is a tool for technical analysis and market-condition filtering. It is not a trading system, it does not generate trading signals, it does not provide investment advice, and it does not open or manage trades automatically.
A free demo version is available for evaluation in the MetaTrader 5 Strategy Tester before purchase.
Developed and maintained by Narayanan Mohanan, MT5/MQL5 Developer.