Anchored Volume Delta with Adaptive Bands

This indicator plots Cumulative Volume Delta (CVD) — the running total of each bar's volume, signed by the direction the bar closed — inside adaptive standard-deviation bands. It answers a question price alone does not: is the move being carried by participation, or is it drifting?

The cumulative total restarts at an anchor you choose — daily, weekly or monthly — so the reading is always relative to the current session, week or month rather than to the beginning of chart history. That single control is what makes the same indicator useful on a five-minute forex chart and on a daily equity chart, and it is what separates this from a plain cumulative volume line that only ever grows from wherever your history happens to start.

How it works

Each bar contributes its volume to a running total: added when the bar closes above the previous close, subtracted when it closes below, and left unchanged when the close is flat. Tick volume is used by default. Real volume can be selected instead, and where the broker supplies none the calculation falls back to tick volume for that bar.

A 20-period basis and its standard deviation are then calculated over that cumulative series, and the upper and lower bands are placed at a chosen multiple of the deviation. Because the bands are built from the series' own variability, they widen when participation becomes volatile and contract when it settles — no fixed thresholds to re-tune per instrument.

When the cumulative total reaches an anchor boundary it resets to zero and begins again. On the chart this appears as a clean restart in the line, and the bands re-form around the new period.

What the bands show

A move outside the bands means volume flow has become statistically unusual for that instrument's recent behaviour. A return inside means it has normalised. Neither is a signal to act — they are a description of where participation currently sits relative to its own recent range.

Three readings traders commonly take from this display:

Band contact. The CVD line reaching the upper band marks buying flow stretched relative to its recent range; the lower band marks the same for selling flow. In the screenshots these points are marked in red at the upper band and green at the lower band. What follows a stretched reading is not fixed — flow can normalise, or it can keep extending while the bands widen around it.

Confirmation. Price makes a new high or low and the CVD line makes one too. Participation is travelling with price.

Divergence. Price makes a new low while the CVD line makes a higher low, or the reverse at a high. Price has moved but the volume flow behind it has not followed. This is context, not a prediction — divergences resolve in both directions, and they can persist far longer than expected.

Inputs

  • Applied volume — Tick Volume (default) or Real Volume where the broker supplies it
  • Anchor period — Continuous, Daily (default), Weekly or Monthly
  • Bands period — 20
  • Bands deviation — 2.0

An anchor must be coarser than the chart period to mean anything: a daily anchor on a daily chart would reset on every bar. When that happens the indicator falls back to a continuous series, states the reason in the Experts log, and shows the anchor actually in use in its short name — so what you see labelled is always what is running.

Buffers

  • Buffer 0 — CVD line
  • Buffer 1 — Upper band
  • Buffer 2 — Basis
  • Buffer 3 — Lower band

All four are readable from an Expert Advisor or another indicator with iCustom() and CopyBuffer(). Read shift 1 — the last fully closed bar — for values that will not change.

The indicator is self-contained: it creates no handles to other indicators, so the only handle your code manages is the one it creates itself.

Across instruments

The screenshots show the indicator on five asset classes and all three anchor settings, with nothing changed but the anchor. In each one, red marks contact with the upper band, green marks contact with the lower band, and yellow trendlines mark a divergence between price and volume flow.

  • US30 H1, daily anchor — the fullest example, showing both kinds of divergence. On 29 July price drives to a decisively lower low while the CVD line holds a higher low: the selling is not carried by matching volume flow, and price works back up over the following sessions. Earlier, on 28 July, the reverse — flow reaches the upper band while price has already begun rolling over from its high.
  • XAUUSD H1, daily anchor — price posts a lower low into 24 July while the CVD line posts a higher low, with both legs marked on the price and indicator panes.
  • GBPJPY M5, daily anchor — an intraday session where selling flow carries the line through the lower band, then flattens and settles inside the bands while price stabilises.
  • BTCUSD H4, weekly anchor — a longer horizon on a market that trades continuously, where a weekly anchor suits the timeframe better than a daily one. Band contact is marked at both extremes.
  • GOOGL Daily, monthly anchor — an equity on a daily chart, where only a monthly anchor is coarse enough to leave the cumulative series intact. The monthly restarts are visible as clean breaks in the line.

Calculation behaviour

Values are calculated only from completed data. Once a bar closes its value is final and does not change. Only the currently forming bar updates as new ticks arrive, and it settles at that bar's close. The indicator uses no look-ahead data and does not repaint closed bars.

The cumulative series is rebuilt deterministically, so the same chart and settings always produce the same values regardless of when the indicator was attached or how the history was loaded.

Notes

  • Separate indicator window, 4 plots, 4 buffers.
  • Around 20 bars of history are required before the bands begin to draw.
  • Tick volume is a proxy for traded volume. On instruments where the broker supplies real volume, selecting it gives a more faithful reading.
  • No external dependencies. The cumulative series, the basis and the standard-deviation bands are all calculated inside the indicator. It does not call any other indicator, so there are no handles to fail, nothing to install alongside it, and no dependency on the state of your standard indicator folder.

This indicator is a tool for technical analysis and market-condition filtering. It is not a trading system, it does not generate trading signals, it does not provide investment advice, and it does not open or manage trades automatically. No performance claims are made for it.

Free to download and use. If you find it useful, a rating helps other traders find it.

More tools from this developer

I build MT5 indicators and Expert Advisors with an emphasis on clean, documented, no-repaint code — closed-bar logic, validated buffers, and no dependencies on other indicators.

See all published products →

Questions about the calculation, the buffers, or using this in your own EA? Send me a private message — I am happy to answer.

Developed and maintained by Narayanan Mohanan, MT5/MQL5 Developer.

Recommended products
Basic Vwap
james mugendi
4 (1)
Simple Vwap with the daily, weekly and monthly VWAP is the abbreviation for   volume-weighted average price , which is a technical analysis tool that shows the ratio of an asset's price to its total trade volume. It provides traders and investors with a measure of the average price at which a stock is traded over a given period of time. How it's used Identify entry and exit points:   Traders can use VWAP to determine when to buy or sell an asset.   Understand price trends :  Traders can use V
FREE
Master HMA
Leonel Alberto Jose Quintana
Master HMA for MetaTrader 5 Master HMA is a technical indicator for MetaTrader 5 that combines different Hull Moving Average calculations into a visual structure designed to analyze price direction, slope, and movement behavior. The indicator uses three HMA periods: Fast, Main, and Slow. The relationship between these lines helps identify changes in the movement structure and follow different market phases. The Main HMA uses different colors to represent the states identified by the system. The
FREE
Donchian Breakout And Rsi
Mattia Impicciatore
4.33 (3)
General Description This indicator is an enhanced version of the classic Donchian Channel , upgraded with practical trading functions. In addition to the standard three lines (high, low, and middle), the system detects breakouts and displays them visually with arrows on the chart, showing only the line opposite to the current trend direction for a cleaner view. The indicator includes: Visual signals : colored arrows on breakout Automatic notifications : popup, push, and email RSI filter : to val
FREE
MSX Hybrid Heiken Scalper
Som Prakash Gehlot
5 (1)
MSX Hybrid Heiken Scalper Overview MSX Hybrid Heiken Scalper is a MetaTrader 5 indicator based on a modified Heiken Ashi methodology with closed-bar smoothing. The indicator is designed to display trend direction through color-coded candles while reducing sensitivity to short-term market fluctuations. All calculations are performed using completed candles, allowing historical values to remain fixed after bar close. Features • Modified Heiken Ashi calculation • Closed-bar processing • Color-code
FREE
LT Donchian Channel
Thiago Duarte
4.86 (7)
Donchian Channel is an indicator created by Richard Donchian. It is formed by taking the highest high and the lowest low of the last specified period in candles. The area between high and low is the channel for the chosen period. Its configuration is simple. It is possible to have the average between the upper and lower lines, plus you have alerts when price hits one side. If you have any questions or find any bugs, please contact me. Enjoy!
FREE
Heiken Ashi Smoothwave
Alexandre Vincent Traber
Overview Heiken Ashi Smoothwave transforms your chart into smoothed Heiken Ashi candles directly on the main chart window, replacing standard candles for a cleaner trend view. No separate window, no clutter. How it works Calculates Heiken Ashi OHLC values from real price data each bar. Plots colored Heiken Ashi candles directly over the main chart. Automatically hides the native chart candles so only the Heiken Ashi candles are visible. Restores standard candles automatically when the indicator
FREE
The indicator highlights the points that a professional trader sees in ordinary indicators. VisualVol visually displays different volatility indicators on a single scale and a common align. Highlights the excess of volume indicators in color. At the same time, Tick and Real Volume, Actual range, ATR, candle size and return (open-close difference) can be displayed. Thanks to VisualVol, you will see the market periods and the right time for different trading operations. This version is intended f
FREE
JT360 DNA Mini PnL Pointer V1.04 Public Компактно. Наглядно. Всегда перед глазами. JT360 DNA Mini PnL Pointer — это лёгкий индикатор для MetaTrader 5, который отображает суммарную текущую прибыль или убыток по всем открытым позициям текущего символа графика. Компактная индикация непосредственно на графике объединяет PnL относительно первоначального риска в формате R, тонкую мини-полоску и настраиваемую цветовую матрицу. Фирменные цвета JT360 — бирюзовый и пурпурный — выделяют крайние значения и
FREE
Overview Experience professional-grade order flow analysis with the Anchored Volume Profile , an ultra-lightweight, high-performance volume distribution indicator designed exclusively for MetaTrader 5. Built from the ground up using raw memory canvas mechanics, this indicator eliminates the massive CPU lag, UI flickering, and chart freezing commonly associated with standard rectangle-object profiles. By processing native terminal tick volume into directional matrices, this tool provides a visu
FREE
HTF Candles Nika overlays full-size candles from any higher timeframe directly onto your current chart in MetaTrader 5. It gives you a clear multi-timeframe view without leaving your chart. Key Features - Draws higher timeframe candles as filled rectangles with wicks on the current chart - Supports standard candlestick and Heiken Ashi display modes - Live countdown timer showing time remaining until the current HTF candle closes - Customizable colors for bullish and bearish candles - Auto or m
FREE
Renko subwindow
Alexandre Vincent Traber
Overview Renko SubWindow plots a Renko brick chart as colored candles inside a separate indicator window, without affecting the main chart. Brick size can be fixed in points or calculated dynamically from ATR for adaptive volatility-based bricks. How it works Reconstructs Renko bricks from closing prices of the current symbol/timeframe history. Each brick forms once price moves beyond the defined brick size from the last brick's close. Bricks are rendered as colored candles: bullish (up) and bea
FREE
Indicator Description 4 Hull MA Color + Envelopes is a powerful trend-following indicator for MetaTrader 5 that combines four Hull Moving Averages (HMA) with Moving Average Envelopes to clearly identify market direction, trend strength, and potential reversal or pullback zones. This indicator is designed to reduce noise, react quickly to price movement, and provide a clean visual structure for professional trading.   Key Features   4 Hull Moving Averages (20, 50, 100, 200) Automatic color change
FREE
Value Chart Candlesticks
Flavio Javier Jarabeck
4.57 (14)
The idea of a Value Chart indicator was presented in the very good book I read back in 2020 , " Dynamic Trading Indicators: Winning with Value Charts and Price Action Profile ", from the authors Mark Helweg and David Stendahl. The idea is simple and the result is pure genius: Present candlestick Price analysis in a detrended way! HOW TO READ THIS INDICATOR Look for Overbought and Oversold levels. Of course, you will need to test the settings a lot to find the "correct" one for your approach. It
FREE
Phoenix Delta Volume
Nigel Nii Darku Narnor Darko
5 (1)
This is the Phoenix Institutional SMC Dashboard (Emerald-Teal Edition). It is engineered to provide retail traders with the same "Volume-at-Price" clarity used by institutional desks. Below is a full breakdown of the benefits, the high-confluence logic for entries, and how to manage your trades using the current visual engine. Strategic Benefits to the User Sentiment over Price: Most indicators only look at where the price is. This dashboard tells you how much effort (Volume Delta) was required
FREE
MIDAS Super VWAP
Flavio Javier Jarabeck
4.27 (11)
Imagine VWAP, MVWAP and MIDAS in one place... Well, you found it! Now you can track the movement of Big Players in various ways, as they in general pursue the benchmarks related to this measuring, gauging if they had good execution or poor execution on their orders. Traders and analysts use the VWAP to eliminate the noise that occurs throughout the day, so they can measure what prices buyers and sellers are really trading. VWAP gives traders insight into how a stock trades for that day and deter
FREE
Are you tired of drawing trendlines every time you're analyzing charts? Or perhaps you would like more consistency in your technical analysis. Then this is for you. This indicator will draw trend lines automatically when dropped on a chart. How it works Works similar to standard deviation channel found on mt4 and mt5. It has 2 parameters: 1. Starting Bar 2. Number of bars for calculation The   starting bar   is the bar which drawing of the trend lines will begin, while the   number of bars for c
FREE
Follow The Line MT5
Oliver Gideon Amofa Appiah
4.6 (35)
This indicator obeys the popular maxim that: "THE TREND IS YOUR FRIEND" It paints a GREEN line for BUY and also paints a RED line for SELL. (you can change the colors). It gives alarms and alerts of all kinds. IT DOES NOT REPAINT and can be used for all currency pairs and timeframes. Yes, as easy and simple as that. Even a newbie can use it to make great and reliable trades. NB: For best results, get my other premium indicators for more powerful and reliable signals. Get them here: https://www.m
FREE
Rainbow MT5
Jamal El Alama
4 (1)
Description : Rainbow MT5 is a technical indicator based on Moving Average with period 34 and very easy to use. When price crosses above MA and MA changes color to green, then this is a signal to buy. When price crosses below MA and MA changes color to red, then this is a signal to sell. The Expert advisor ( Rainbow EA MT5 ) based on Rainbow MT5 indicator is now available here . MT4 version is available here .
FREE
IBI Vwap
Brahim Eljaziri
IBI Vwap draws the Volume-Weighted Average Price calculated on the real volume of the exchange , with ±1 and ±2 standard-deviation bands. What you see VWAP : the average price paid by all participants since the session start, weighted by real traded volume. Institutions use it as a benchmark: above it buyers are in control, below it sellers are. ±1 and ±2 standard-deviation bands : how far price stretches from its average. The ±2 band marks an extension zone. Short labels on the right: VWAP (wit
FREE
FVGs
Andrii Hurin
5 (10)
A simple indicator that automatically highlights all FVGs (Fair Value Gaps) formed on the chart, as well as FVGs on history. It is possible to select colors for FVGs of different directions (long or short), select the time interval, select the color of middle point and you can also choose whether to delete filled FVGs or leave them on the chart (the option is beneficial for backtesting). The indicator can be very useful for those, who trade according to the concept of smart money, ICT, or simply
FREE
Simple VWAP
Abraao Moreira
4 (1)
What you get One volume-weighted average price line drawn on the main chart, over a period you set. Bars with more traded volume weigh more in the average than quiet bars. Light on the terminal: history is calculated once, then only new bars are added. Free, with no external files or DLLs. How it works VWAP = sum(price[i] × volume[i]) / sum(volume[i]) The line is calculated from the start of the available history once, when the indicator is attached. After that each new bar extends the line wit
FREE
Weis Waves
Flavio Javier Jarabeck
2.83 (18)
The original author is David Weis, an expert in the Wyckoff Method. The Weis Wave is a modern adaptation of the 1930's Wyckoff Method, another expert in Tape Reading techniques and Chart Analysis. Weis Waves takes market volume and stacks it into waves according to price conditions giving the trader valuable insights about the market conditions. If you want to learn more about this subject you can find tons of videos in YouTube. Just look for "The Wickoff Method", "Weis Wave" and "Volume Spread
FREE
Friend of the Trend: Your Trend Tracker Master the market with Friend of the Trend , the indicator that simplifies trend analysis and helps you identify the best moments to buy, sell, or wait. With an intuitive and visually striking design, Friend of the Trend analyzes price movements and delivers signals through a colorful histogram: Green Bars : Signal an uptrend, indicating buying opportunities. Red Bars : Alert to a downtrend, suggesting potential selling points. Orange Bars : Represent cons
FREE
RSI back arrows
Smaylle Rafael Coelho Mariano
The   RSI Back Arrows   indicator is a powerful tool designed for traders who rely on the Relative Strength Index (RSI) to identify potential market reversals. This indicator specifically highlights when the RSI has exited the   oversold   or   overbought   zones, providing clear visual signals to inform trading decisions. Key Features: Visual Cues : The indicator marks arrows on the chart when the RSI crosses back into a neutral zone, making it easy to spot potential entry and exit points. Over
FREE
Period separators
Mykola Demko
5 (7)
The Period separators indicator separates time periods, specified by user. It supports all timeframes, greater or aliquot to current timeframe. In case of the incorect timeframe, the indicator modifies it to closest correct value. Additional bonus - the separation of non-standard time periods - MOON, MOON/2, MOON/4 (moon phases). The separators are plotted using the indicator's buffers. The indicator uses one graphic object for information about the progress and current bar properties. The graph
FREE
Easy VWAP
Luca Spinello
VWAP Indicator, the short form of Volume Weighted Average Price, is similar to a moving average but takes into consideration the tick volume of the candles. The indicator calculates the moving average multiplying the price of each candle for the tick volume in the candle. Said calculation weighs with more significance price where more transactions were made. Features: Visual styling customizable Period customizable Ease of use
FREE
Wavetrend with Crosses
Bambang Nugroho
5 (1)
Read This : Please provide comments and reviews for future improvements. WaveTrendPro_Indi v1.05 WaveTrend indicator with enhanced histogram visualization : Histogram is now scaled higher (adjustable via  HistScale ). Different colors for positive & negative bars, making trend direction clearer. Lightweight & responsive across pairs and timeframes. Perfect for scalpers, swing traders, and trend-following strategies. WaveTrendPro_Indi v1.05 Indikator WaveTrend dengan tampilan histogram yang le
FREE
Simple Trend Direction MT5
Khalaf Hamza Mohammad Yousef
This is a FREE Trend Direction Indicator for MetaTrader 5. Features: Identifies market trend direction Uses EMA 50 and EMA 200 Non-repainting logic Clear visual display Suitable for manual trading Free version includes: - Single timeframe - Trend direction only - No alerts If you need: Alerts Multi-timeframe version EA automation Custom modifications My Name is Khalaf Hamza , You can contact me for freelance work --> khalaf.hamza.hi@gmail.com
FREE
Tabajara V5
Flavio Javier Jarabeck
4.84 (37)
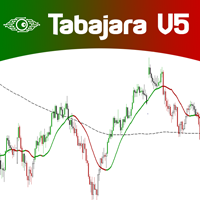
Metatrader 5 version of the famous Andre Machado's Tabajara indicator. If you don't know Andre Machado's Technical Analysis work you don't need this indicator... For those who need it and for those several friend traders who asked this porting from other platforms, here it is... FEATURES 8-period Moving Average 20-period Moving Average 50-period Moving Average 200-period Moving Average Colored candles according to the inflexion of the 20-period MA SETTINGS You can change the Period of all MA's
FREE
High Low Open Close
Alexandre Borela
4.98 (46)
If you like this project, leave a 5 star review. This indicator draws the open, high, low and closing prices for the specified period and it can be adjusted for a specific timezone. These are important levels looked by many institutional and professional traders and can be useful for you to know the places where they might be more active. The available periods are: Previous Day. Previous Week. Previous Month. Previous Quarter. Previous year. Or: Current Day. Current Week. Current Month. Current
FREE
Buyers of this product also purchase
Trend Sniper X
Sarvarbek Abduvoxobov
4.86 (43)
Trend Sniper X is a multi-timeframe trend-following indicator for MetaTrader 5 that helps traders identify trend direction and potential reversal points with clarity and precision. for MT4: https://www.mql5.com/en/market/product/193245 Price Information: The current price is promotional and is subject to change as upcoming updates and new features are released. Bonus Offer: To get the FREE Auto-Trade Assistant EA for this indicator, please message the author after purchasing. Code2Profit Channe
Smart Trend Trading System — MetaTrader 5 Message me on MQL5 after purchase to receive Smart Universal Expert Advisor for FREE, plus the online course, PDF manual, and private group access. STTS brings trend direction, entry and exit signals, reversal zones, and important price levels together on your chart. Follow the system manually, or connect a separate compatible EA for automated execution using your chosen settings. ONE SYSTEM. FOUR TRADING APPROACHES. STTS organizes its trading approaches
A new King in town - Indicator + Order management indications(tp1+tp2+tp3) + Optional Telegram Signal sender   INCLUDED (FREE) + Bonus EA Robot ( FULL TRADING  and SIGNAL SYSTEM ) Our best EA for Gold: Gold Slayer TRY > Reversion Queen  Expert advisor >JOIN Community Channel < NEW Free Automation EA link < click here ( disclaimer: this is new and still on testing and phase , use at your risk on demo) Free Telegram Bridge < click here  This indicator includes an advanced Strategy, a trading sys
Zoryk Gold
Reda El Koutbane
4.78 (18)
discount ends SOON next price 69 $ ZORYK — Advanced XAUUSD Signal System for MetaTrader 5 You know the feeling. You spend time analyzing gold. You wait for the entry. You finally open the trade, and price immediately moves against you. You close too early, move the Stop Loss or hesitate for a few seconds. Then the market reaches the exact destination you originally expected without you. The direction was not always the problem. The real problem was uncertainty. You did not know exactly where th
M5 Sniper
MeanFX
5 (3)
Get your trading edge in the line of sight M5 Sniper   is a new indicator by MeanFX. It combines   precise trading signals   with   adaptive TP/SL levels   - creating best possible statistical trades as a result! The price increases every 5 purchases, the next price is 79$ Message me after purchase to receive tips/guide and bonus EA Auto Optimisation only works on LIVE chart , needs data feed >JOIN Community Channel < What makes it stand out?   Proven statistical performance   on Gold XAUUSD
Ultra Indicator
Ihor Otkydach
5 (1)
ULTRA is a technical indicator that operates on an “all-in-one” basis—it independently analyzes the market, generates trading signals, displays levels for setting stop-loss orders, and suggests when to close trades to lock in profits or minimize losses. In other words, it doesn't matter if you don't know how to analyze the market, determine levels—where to set your stop-loss—or struggle with money management. ULTRA will do all of that for you! BUYER BONUS: After purchasing the ULTRA indicator, s
In 2019 I showed the whole world what this indicator can do. I traded its signals by hand, on a real account, in the open — the account was monitored live on Myfxbook, and I covered my experiment in detail on Facebook. The result: $10,000 became $941,411 in four months. The risk was deliberately extreme — the drawdown reached 54%, because in our profession profit and risk always go hand in hand. The Myfxbook screenshot is the first picture in the gallery. Looks like congratulations are in order:
SuperScalp Pro
Van Minh Nguyen
4.54 (37)
SuperScalp Pro - Professional Multi-Layer Confluence Scalping System SuperScalp Pro is an advanced scalping indicator that upgrades the classic Supertrend with multiple intelligent confirmation filters. It helps you identify higher-probability Buy/Sell opportunities while significantly reducing false signals. Clear Buy and Sell arrows appear directly on the chart, along with automatic ATR-based Stop Loss and Take Profit levels calculated in real time. After purchase, please message me on MQL5 to
Gann Made Easy   is a professional and easy to use Forex trading system which is based on the best principles of trading using the theory of W.D. Gann. The indicator provides accurate BUY and SELL signals including Stop Loss and Take Profit levels. You can trade even on the go using PUSH notifications. PLEASE CONTACT ME AFTER PURCHASE TO GET TRADING  INSTRUCTIONS   AND GREAT EXTRA INDICATORS  FOR FREE! Probably you already heard about the Gann trading methods before. Usually the Gann theory is a
SMC Intraday Formula
VividMind Digital Solutions
5 (26)
Secure the Lowest Price Today. After purchase, contact via   MQL5 inbox   to receive your buyer kit and bonus. Let's be honest first. No indicator will make you profitable on its own. If someone tells you otherwise, they're selling you a dream. Every indicator that shows perfect buy/sell arrows can be made to look flawless — just zoom into the right window of history and screenshot the winners. We won't do that. SMC Intraday Formula is a tool. It reads the market structure for you, maps the hig
M1 Sniper MT5
Oleg Rodin
5 (7)
M1 SNIPER  is an easy to use trading indicator system. It is an arrow indicator which is designed for M1 time frame. The indicator can be used as a standalone system for scalping on M1 time frame and it can be used as a part of your existing trading system. Though this trading system was designed specifically for short-term trading, it still can be helpful for all traders. This trading system can be used with any forex pair and time frame, though lower time frames are recommended from M1 up to M
GoldenX Entry MT5
VividMind Digital Solutions
5 (17)
Price will increase by $20 every 10 buyers to maintain premium value. After purchase, contact via   MQL5 inbox   to receive your buyer kit and bonus. You have probably tested dozens of indicators before. But we are not here to be “just another signals indicator.” Behind GoldenX Entry is intensive research & development focused on building sophisticated algorithms designed to adapt to the real behavior of every instrument — not generic signals recycled everywhere else. From advanced Auto Optim
Gold Entry Sniper
Tahir Mehmood
5 (21)
Gold Entry Sniper – Professional Multi-Timeframe ATR Dashboard for Gold Scalping & Swing Trading Gold Entry Sniper is a cutting-edge MetaTrader 5 indicator designed to give traders precise buy/sell signals for XAUUSD and other symbols, powered by ATR Trailing Stop logic and a multi-timeframe analysis dashboard . Built for both scalpers and swing traders, it combines real-time market direction , dynamic stop levels , and professional visual dashboards to help you identify high-probability gold en
Next Update — Version 2.52 Coming Soon! [NEW] Get Ready for 4 Major New Features Designed to Enhance Your Market Analysis and Trading Workflow We’re taking market analysis to the next level with 4   new features designed to meet your trading needs. Introducing: TRADE OVERVIEW DASHBOARD CONFLUENCE AT ZONE STRONG & WEAK HIGH/LOW OPTIMAL TRADE ENTRY  —   OTE 1. TADE OVERVIEW DASHBOARD  A dashboard that helps you understand the overall market picture more easily, providing guidance to support yo
Gold Trend Coach MT5
Cristhian Alexander Gaibor Cuasquer
5 (4)
Gold Trend Coach is a gold (XAUUSD) trend indicator for MetaTrader 5 with buy and sell signals, stop loss and three take profit targets, confirmed on bar close, a multi-timeframe coach dashboard and alerts to your phone and Telegram. Built for M5 scalping and M15 intraday during the London and New York sessions. BONUS: FREE Auto-Trade EA for Gold Trend Coach. Message me after purchase and I send you the EA that trades the indicator signals automatically, plus the Telegram Alert Bridge that sends
Atomic Analyst MT5
Issam Kassas
4.5 (64)
Atomic Analyst — MetaTrader 5 Message me on MQL5 after purchase to receive Smart Universal Expert Advisor for FREE, plus the online course, PDF manual, and private group access. Atomic Analyst brings price action, trend direction, entry and exit signals, Stop Loss and multiple Take Profit levels together on your chart. SEE THE SIGNAL. UNDERSTAND THE SETUP. Atomic Analyst organizes its analysis into clear visual information: • Buy and sell arrows to identify potential entries. • Stop Loss and mul
Boba Analysis Suite
Trade Ready Solutions LLC
5 (2)
Boba Analysis Suite Boba Analysis Suite is an analytical indicator for MetaTrader 5. It brings market structure, relevant price zones and broader market context together in a single chart view. Developed through practical experience as a trader and trading coach, it supports a structured analysis process: assessing market direction, identifying important levels and considering multiple timeframes together. Analysis in Context Individual signals gain meaning through context. Boba Analysis Suite h
Adaptive Price Action Engine Buy Indicator- Get EA Based on it for FREE. Self-Optimizing Multi-Timeframe Trend & Candlestick Intelligence Markets do not behave the same way all the time—and not every price-action pattern has the same value in every market regime. Adaptive Price Action Engine is designed to adapt to changing market conditions by combining trend structure, multi-timeframe analysis, candlestick patterns, and statistical optimization into one analytical framework. Two Adaptive Mode
Azimuth Pro
Ottaviano De Cicco
5 (7)
Azimuth Pro V2: Synthetic Fractal Structure and Confirmed Entries for MT5 Overview Azimuth Pro is a multi-level swing structure indicator by Merkava Labs . Four nested swing layers, swing-anchored VWAP, ABC pattern detection, three-timeframe structural filtering, and closed-bar confirmed entries — one chart, one workflow from micro-swings to macro-cycles. This is not a blind signal product. It is a structure-first workflow for traders who care about location, context, and timing. Halloween P
Auto Optimized SpeedAngle is an institutional-grade momentum vectoring system that eliminates curve-fitting through continuous Walk-Forward Optimization (WFO). Rather than relying on static inputs that degrade when market regimes shift, the indicator dynamically recalibrates its parameters using Out-of-Sample (OOS) validation, ensuring the displayed signals represent genuine statistical edges rather than historical anomalies. By shifting the focus from subjective visual angles to normalized, qua
Zain Gold Scalping
Ahmed Gamal Abdel Nasser Mohamed
A complete price-action analysis tool built around dual independent entry logic, each confirmed against a volatility band, combined with a configurable set of nine optional confirmation filters that let you shape exactly how conservative or aggressive the tool's signals behave. Core Strategy Two independent entry setups, each triggering only when price moves outside a dynamic volatility band — giving two distinct ways to spot potential reversal points, which can be used together or separately.
Tokyo mt5 Indicator
Vasiliy Strukov
5 (14)
Tokyo Indicator provides a clear visual overview of trend direction, potential trading signals, and market conditions. Its colour-coded, stepped trend line distinguishes bullish phases in blue from bearish phases in magenta. Matching directional arrows highlight potential buying and selling opportunities when the displayed trend changes. An integrated dashboard brings together the current signal, market bias, momentum, volatility, and signal quality in one convenient view. This allows traders t
FiboSniper Pro
Van Minh Nguyen
5 (4)
FiboSniper Pro - Multi-Filter Fibonacci System with Auto SL/TP and Control Panel FiboSniper Pro is a technical indicator that combines dynamic Fibonacci Envelopes with multiple confirmation filters to generate selective Buy and Sell signals. Fibonacci levels are calculated from Moving Average and ATR, then filtered by ADX, EMA, RSI, ATR, Volume, Time and Candle structure. The indicator displays automatic ATR-based Stop Loss and Take Profit levels directly on the chart, along with an interactive
Quantum TrendPulse
Bogdan Ion Puscasu
5 (26)
Introducing Quantum TrendPulse , the ultimate trading tool that combines the power of SuperTrend , RSI , and Stochastic into one comprehensive indicator to maximize your trading potential. Designed for traders who seek precision and efficiency, this indicator helps you identify market trends, momentum shifts, and optimal entry and exit points with confidence. Key Features: SuperTrend Integration: Easily follow the prevailing market trend and ride the wave of profitability. RSI Precision: Detect
Superhero
Ihor Otkydach
5 (3)
The SUPERHERO indicator is a multi-currency trading system designed on an "all-inclusive" basis. The indicator independently analyzes the market and provides signals on when to open and close trades. It uses Stop Loss and Take Profit orders. The R:R ratio is 1:1. This system can send push notifications to your smartphone, so you can place trades "on the go" without needing to be tied to a PC. It's perfect for proprietary trading firms. A BONUS FOR EVERY CUSTOMER: Every buyer of this indicator wi
Multi Currency Strength and Momentum Indicator MT5 Dynamic Forex28 Navigator is the evolution of our long-time, popular indicators, combining the power of three into one: Advanced Currency Strength28 Indicator (700 reviews) Advanced Currency IMPULSE with ALERT (530 reviews) CS28 Combo Signals (recent Bonus) The two predecessor indicators together have received more than 1,200 reviews on the MQL5 Market and have been a staple in the MT4 community since 2016. Dynamic Forex28 Navigator MT5 carries
Trend Catcher ind mt5
Ramil Minniakhmetov
5 (18)
TREND CATCHER INDICATOR Trend Catcher Indicator analyzes market price movements, using a combination of the author’s proprietary and customized adaptive trend-analysis indicators.  It identifies the true market direction by filtering out short-term noise and focusing on underlying momentum strength, volatility expansion, and price structure behavior.  It also uses a combination of smoothing and trend-filtering customized indicators such as moving averages, RSI, and volatility filters.   Real ope
Apex Patterns PRO Buy Indicator - Get Expert Advisor Based on it for FREE. Self-Optimizing Chart Pattern & Breakout Intelligence Traditional pattern scanners rely on fixed inputs, often underperforming when market volatility and structures shift. Apex Patterns PRO is designed to adapt to changing market conditions by combining structural chart pattern recognition, momentum filtering, and statistical self-optimization into one analytical framework. Adaptive Scanning Engine Self-Optimizing Patter
Neuro Poseidon MT5
Daria Rezueva
4.75 (52)
Neuro Poseidon is a new indicator by Daria Rezueva. It combines precise trading signals with adaptive TP/SL levels - creating best possible trades as a result! Message me and get  Neuro Poseidon Assistant  as a gift to automize your trading process! What makes it stand out? 1. Proven profitability on all assets and timeframes 2. Only confirmed BUY and SELL signals present on the chart 3. Adaptive TP & SL levels generated by the software for each trade 4. Easy to understand - suitable for al
Crystal Heikin Ashi Signals
Muhammad Jawad Shabir
5 (5)
Crystal Heikin Ashi Signals—Professional Trend & Signal Detection Indicator Advanced Heikin Ashi Visualization with Intelligent Signal System for Manual & Automated Trading Final Price: $149 ---------> Price goes up $10 after every 10 sales . Limited slots available — act fast . Overview User Guide PDF Crystal Heikin Ashi Signals is a professional-grade MetaTrader 5 indicator that combines pure Heikin Ashi candle visualization with an advanced momentum-shift detection system. Designed for both m
More from author
Currency Strength Oscillator MT5
Narayanan Mohanan Mohanan Krishnan
This indicator plots the relative strength of the eight major currencies as a history, decomposed from the 28 major pairs. A panel tells you where things stand now. This shows how they got there — which currency has been strengthening, which has rolled over, and where the ranking changed hands. All eight series are exposed as documented indicator buffers, so an Expert Advisor can read currency strength directly. How the decomposition works Each of the eight currencies appears in seven of the twe
MTF Currency Strength Panel MT4
Narayanan Mohanan Mohanan Krishnan
MTF Currency Strength Panel for MetaTrader 4 A multi timeframe currency strength meter covering all 28 major forex pairs on one chart. This currency strength panel shows where the eight major currencies stand right now, and how each of the 28 major pairs has been moving across nine timeframes at once — M1 to MN1. Both readings sit on one chart, updated on a timer. Ranking pairs on their own is misleading. When a single currency moves, every pair containing it moves with it, so the top of a pair
FREE
Multi Timeframe Currency Strength Panel
Narayanan Mohanan Mohanan Krishnan
MTF Currency Strength Panel for MetaTrader 5 A multi timeframe currency strength meter covering all 28 major forex pairs on one chart. This currency strength panel shows where the eight major currencies stand right now, and how each of the 28 major pairs has been moving across nine timeframes at once — M1 to MN1. Both readings sit on one chart, updated on a timer. Ranking pairs on their own is misleading. When a single currency moves, every pair containing it moves with it, so the top of a pair
FREE
Trend Survival States
Narayanan Mohanan Mohanan Krishnan
Trend Survival States for MetaTrader 5 — a free market regime indicator measuring bull and bear pressure with adaptive volatility bands and a five-state trend classification Bull and bear pressure, an adaptive-band spread, and a five-state market classification, free for MT5. It measures the buying and selling pressure behind the current move and classifies that into a market state: strong bull, weak bull, neutral, weak bear, strong bear. This is a complete regime indicator, not a time-limited t
FREE
This indicator plots Cumulative Volume Delta (CVD) — the running total of each bar's volume, signed by the direction the bar closed — inside adaptive standard-deviation bands. It answers a question price alone does not: is the move being carried by participation, or is it drifting? The cumulative total restarts at an anchor you choose — daily, weekly or monthly — so the reading is always relative to the current session, week or month rather than to the beginning of chart history. That single con
FREE
This indicator plots the Force Index — each bar's price change multiplied by its volume — inside adaptive standard-deviation bands. Where price alone tells you that a market moved, the Force Index tells you how much effort went into moving it. A large price change on thin volume and a small change on heavy volume are very different events, even when the candles look similar. The Force Index separates them by combining both into a single reading, and the bands place that reading in the context of
FREE
Indicator Test Report
Narayanan Mohanan Mohanan Krishnan
Indicator Test Report for MetaTrader 5 — a repaint checker and indicator tester that shows how any indicator actually behaves You cannot see inside a compiled indicator. The Indicator Test Report loads any indicator — bought, written, or built into MetaTrader — and answers the question a description cannot: does it repaint, how much history does it need, and what does it really publish? It reports behaviour. It does not grade. Load any indicator into the Strategy Tester and get a plain-language
FREE
Force Index with Adaptive Volatility Bands
Narayanan Mohanan Mohanan Krishnan
This indicator plots the Force Index — each bar's price change multiplied by its volume — inside adaptive standard-deviation bands. Where price alone tells you that a market moved, the Force Index tells you how much effort went into moving it. A large price change on thin volume and a small change on heavy volume are very different events, even when the candles look similar. The Force Index separates them by combining both into a single reading, and the bands place that reading in the context of
FREE
Indicator Test Report MT4
Narayanan Mohanan Mohanan Krishnan
Indicator Test Report for MetaTrader 4 — an MT4 repaint checker and indicator tester that shows how any indicator actually behaves You cannot see inside a compiled indicator. The Indicator Test Report loads any indicator — bought, written, or built into MetaTrader — and answers the question a description cannot: does it repaint, how much history does it need, and what does it really publish? It reports behaviour. It does not grade. Load any indicator into the Strategy Tester and get a plain-lang
FREE
OBVCD Pro MT4
Narayanan Mohanan Mohanan Krishnan
OBVCD Pro is a momentum oscillator that applies convergence/divergence analysis to On-Balance Volume (OBV) instead of price, combining adaptive volatility bands with a 5-state regime classifier that can be read visually on the chart or consumed directly by an Expert Advisor. Most classical oscillators analyse price alone. OBVCD Pro calculates convergence and divergence from cumulative volume flow, so it measures the participation behind a market move rather than only the movement itself. The res
Currency Strength Oscillator MT4
Narayanan Mohanan Mohanan Krishnan
Currency Strength Oscillator for MetaTrader 4 A relative currency strength indicator that plots the history of the eight majors. This currency strength oscillator plots the relative strength of the eight major currencies as a history, decomposed from the 28 major pairs. While a standard currency strength meter tells you where things stand right now, this shows how they got there — which currency has been strengthening, which has rolled over, and where the ranking changed hands. All eight series
Oscillator Regime Suite MT4
Narayanan Mohanan Mohanan Krishnan
This indicator applies the convergence/divergence construction — fast moving average minus slow, with a signal line — to a volume-derived series rather than to price. Three sources are selectable: Cumulative Volume Delta, Force Index, and On Balance Volume. Adaptive volatility bands are drawn over the result, and every completed bar is classified into one of five regime states. That state is exposed as a numeric buffer, so an Expert Advisor can read it directly. Why the source matters A standard
Structure Flow and Trailing Stop MT4
Narayanan Mohanan Mohanan Krishnan
Structure Flow and Trailing Stop MT4 — an adaptive flow line with five trailing stop methods, market structure and liquidity bands for MetaTrader 4 Five trailing stop methods, one adaptive flow line, and a condition panel that reports how many measurements agree. This indicator draws two lines on the price chart: an adaptive flow line that follows the market's direction, and a trailing stop that moves only in that direction and never back. A small panel reports the state behind them. The trailin
OBVCD Pro
Narayanan Mohanan Mohanan Krishnan
OBVCD Pro is a momentum oscillator that applies convergence/divergence analysis to On-Balance Volume (OBV) instead of price, combining adaptive volatility bands with a 5-state regime classifier that can be read visually on the chart or consumed directly by an Expert Advisor. Most classical oscillators analyse price alone. OBVCD Pro calculates convergence and divergence from cumulative volume flow, so it measures the participation behind a market move rather than only the movement itself. The res
Oscillator Regime Suite
Narayanan Mohanan Mohanan Krishnan
This indicator applies the convergence/divergence construction — fast moving average minus slow, with a signal line — to a volume-derived series rather than to price. Three sources are selectable: Cumulative Volume Delta, Force Index, and On Balance Volume. Adaptive volatility bands are drawn over the result, and every completed bar is classified into one of five regime states. That state is exposed as a numeric buffer, so an Expert Advisor can read it directly. Why the source matters A standard
Structure Flow and Trailing Stop
Narayanan Mohanan Mohanan Krishnan
This indicator draws two lines on the price chart: an adaptive flow line that follows the market's direction, and a trailing stop that moves only in that direction and never back. A small panel reports the state behind them. The trailing stop can be calculated five different ways. These are not variations on one idea — each anchors to something different, and on the same chart they frequently disagree. The flow line An adaptive average. It smooths heavily when price is rotating and lightly when
Trend Survival Rate
Narayanan Mohanan Mohanan Krishnan
Trend Survival Rate for MetaTrader 5 — a market regime indicator that measures how often the current trend state has survived to the next bar, and scores its own forecast Trend survival rate, market state classification and a live Brier forecast score, in one MT5 indicator window. It measures the buying and selling pressure behind the current move, classifies that into a market state, and reports how often that state has survived to the next bar — then grades its own forecast against what actual
Filter:
YPMS
45
YPMS 2026.08.30 14:01 

User didn't leave any comment to the rating

Narayanan Mohanan Mohanan Krishnan
1704
Reply from developer Narayanan Mohanan Mohanan Krishnan 2026.08.31 15:51
Good request, and it fits the existing design — the anchor is already selectable, so sessions are three more definitions rather than new machinery. I have logged it. One question that decides the implementation: should a session anchor reset at the session open in broker time, or in the session's own local time?
Reply to review