Structure Flow and Trailing Stop
- Indicators
-
Narayanan Mohanan Mohanan Krishnan
 I build measurement tools for MetaTrader. They describe what the market has done, and state the limits of each measurement rather than hiding them.
 - Version: 1.0
- Activations: 5
This indicator draws two lines on the price chart: an adaptive flow line that follows the market's direction, and a trailing stop that moves only in that direction and never back. A small panel reports the state behind them.
The trailing stop can be calculated five different ways. These are not variations on one idea — each anchors to something different, and on the same chart they frequently disagree.
The flow line
An adaptive average. It smooths heavily when price is rotating and lightly when price is travelling, so it stays close during a move without chasing every swing in a range. Three inputs control it: the window it measures over, and the fastest and slowest smoothing it may use.
A noise filter holds the line still when price has not moved far enough from it to be worth following. That threshold is expressed in ATR, so it scales with the instrument rather than assuming a pip value.
The trailing stop and its five methods
The stop advances only in the trend's direction. It never moves against the trend and it never retreats, so during consolidation it holds its level rather than creeping closer to price. When price crosses it, the trend flips and the stop moves to the other side.
- Swing pivot — anchored to the last swing in the flow line, or to the ATR trail when that is tighter. Structural: it sits where the market last turned.
- ATR trail — a fixed ATR distance from the flow line, ratcheted bar by bar. The smoothest of the five, since it inherits the flow line's own smoothing.
- SuperTrend — an ATR band around each bar's median price, flipping when the close crosses it. Angular rather than smooth: it steps with the bars instead of curving with an average.
- Chandelier — anchored to the flow line's highest or lowest point across the lookback. Holds through pullbacks that tighter methods give up on.
- Donchian channel — the highest high and lowest low over the lookback, with no ATR component at all. The widest of the five and the slowest to flip.
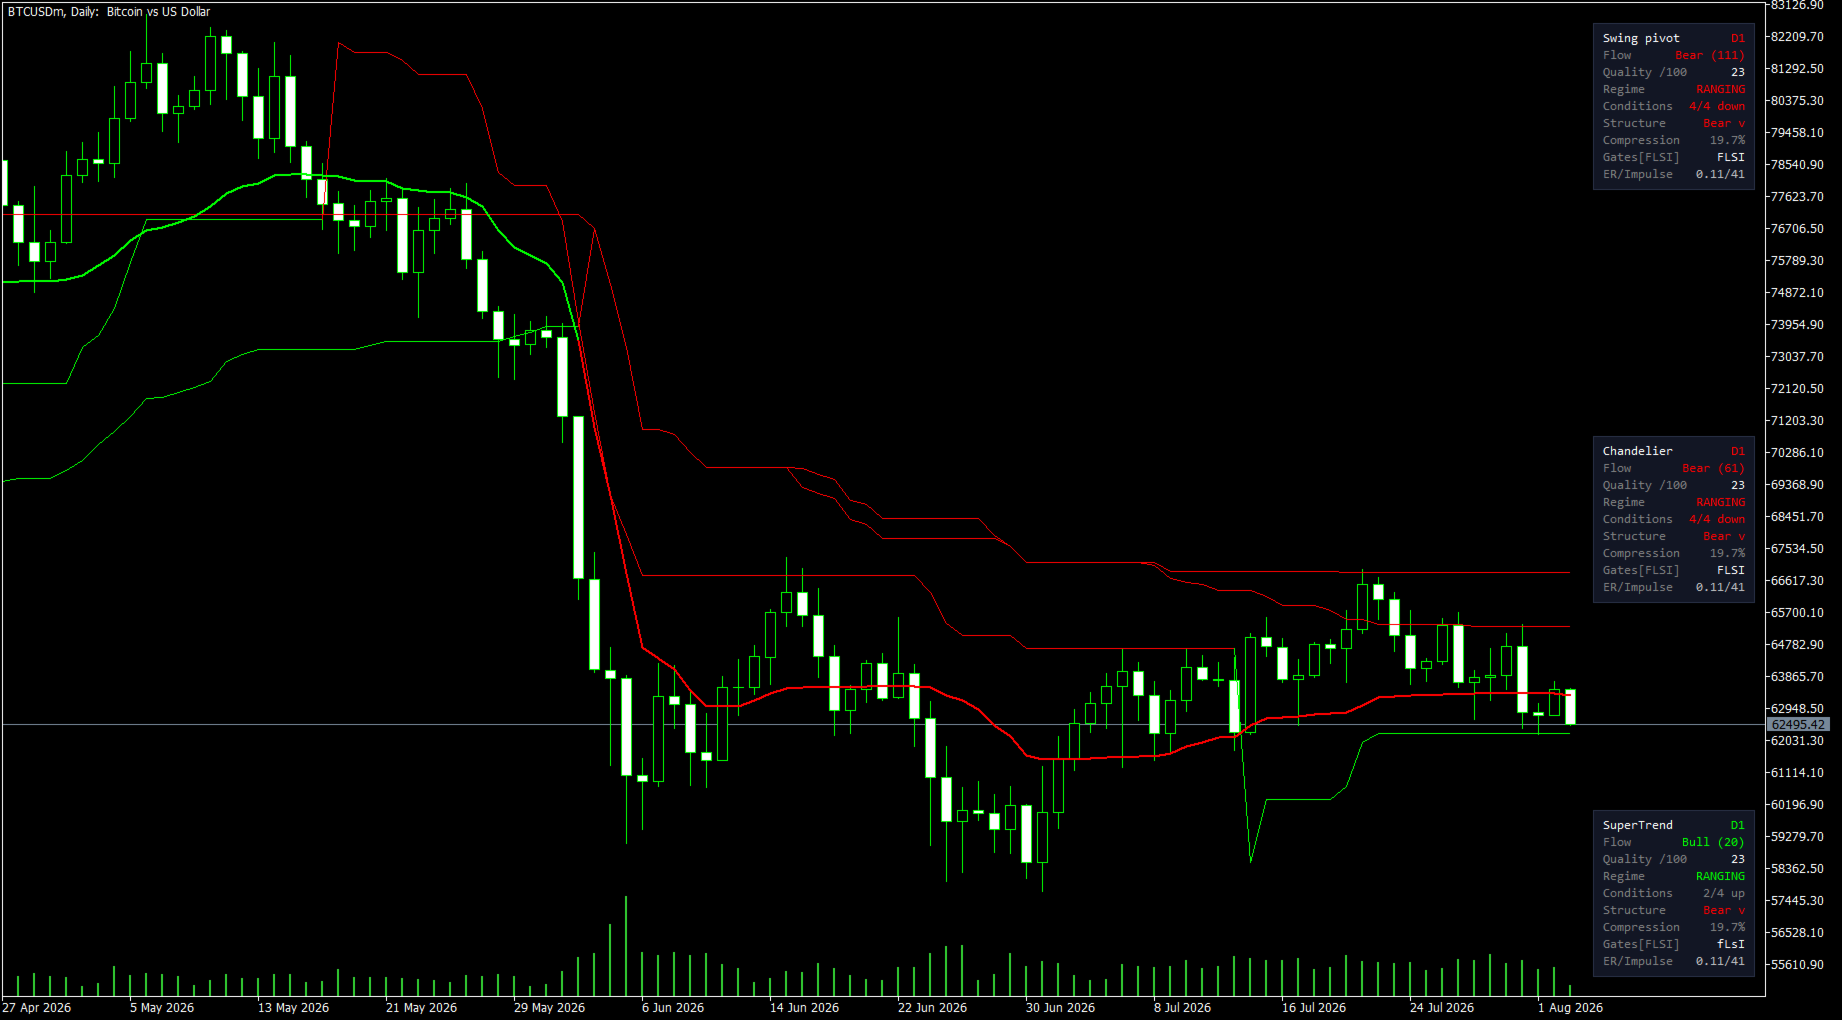
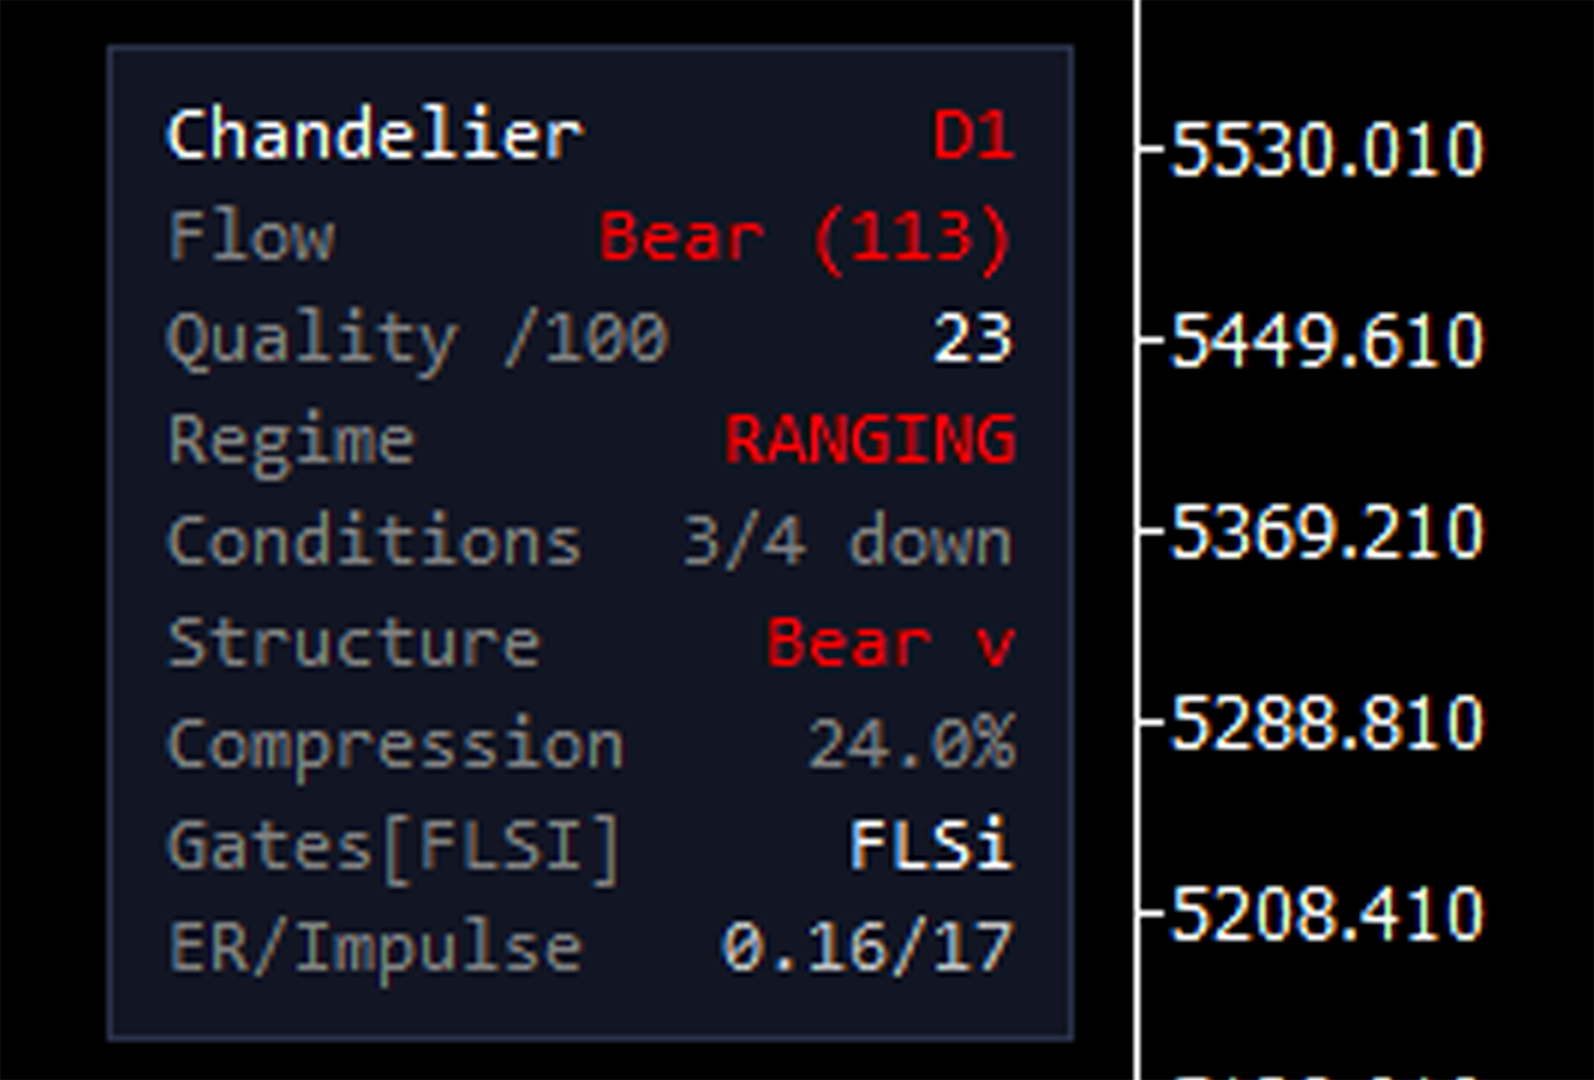
Because they anchor to different things, they answer differently. One screenshot shows three of them on the same Bitcoin daily chart: one reading bearish for 111 bars, one bearish for 61, one bullish for 20. Same data, same settings, three defensible readings. Which suits you is a question about how you trade, not about which is right.
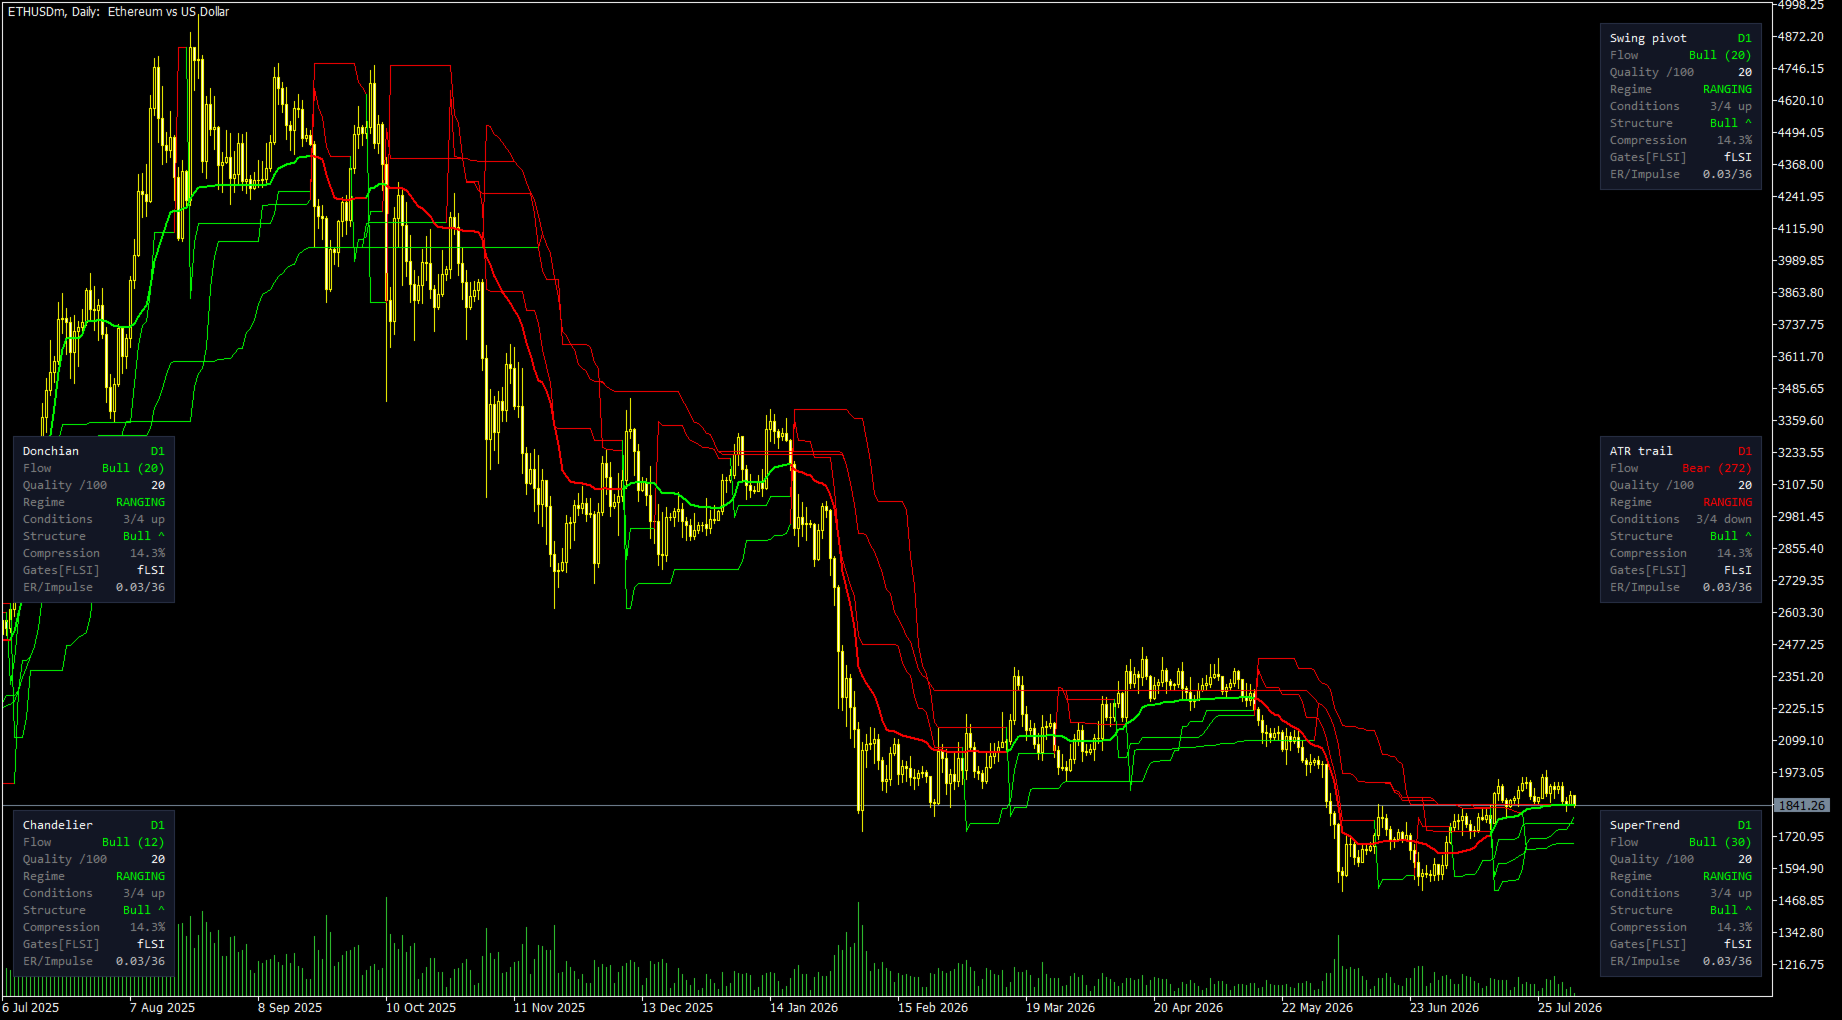
Several instances can run on one chart, each with its own method and its own panel — which is how that screenshot was made.
The condition panel
Four conditions are evaluated on each bar: the direction of the flow, its position relative to a volatility band, the market's swing structure, and the size of the current impulse. The panel reports how many agree and in which direction, alongside the flow's trend duration, the volatility regime, and a compression reading.
That is a summary of where the market is, not an instruction about what to do. Four conditions agreeing describes the present; it does not forecast what follows.
The panel can sit in any corner or vertically centred, and switch to a compact two-row form when several instances share a chart.
Reading it from an Expert Advisor
All eight buffers are exposed and documented. Four of them are not drawn at all — they exist so an EA can read the indicator's conclusions as numbers rather than inferring them from the drawing.
int h = iCustom(_Symbol, _Period, "StructureFlowTrailingStop"); double stop[], regime[]; ArraySetAsSeries(stop, true); ArraySetAsSeries(regime, true); CopyBuffer(h, 2, 0, 100, stop); // trailing stop level CopyBuffer(h, 7, 0, 100, regime); // 1..5, see below
- 0 — flow line
- 1 — flow colour index
- 2 — trailing stop level
- 3 — stop colour index
- 4 — condition quality, 0 to 100
- 5 — condition bitmask: 1 flow, 2 volatility, 4 structure, 8 impulse, so 15 means all four agree
- 6 — trend direction, +1 or −1
- 7 — regime: 1 trending, 2 ranging, 3 compressing, 4 expanding, 5 exhausting
Buffer 7 is the one worth knowing about. A system that should stand down in a rotating market can read it directly instead of deriving a regime of its own.
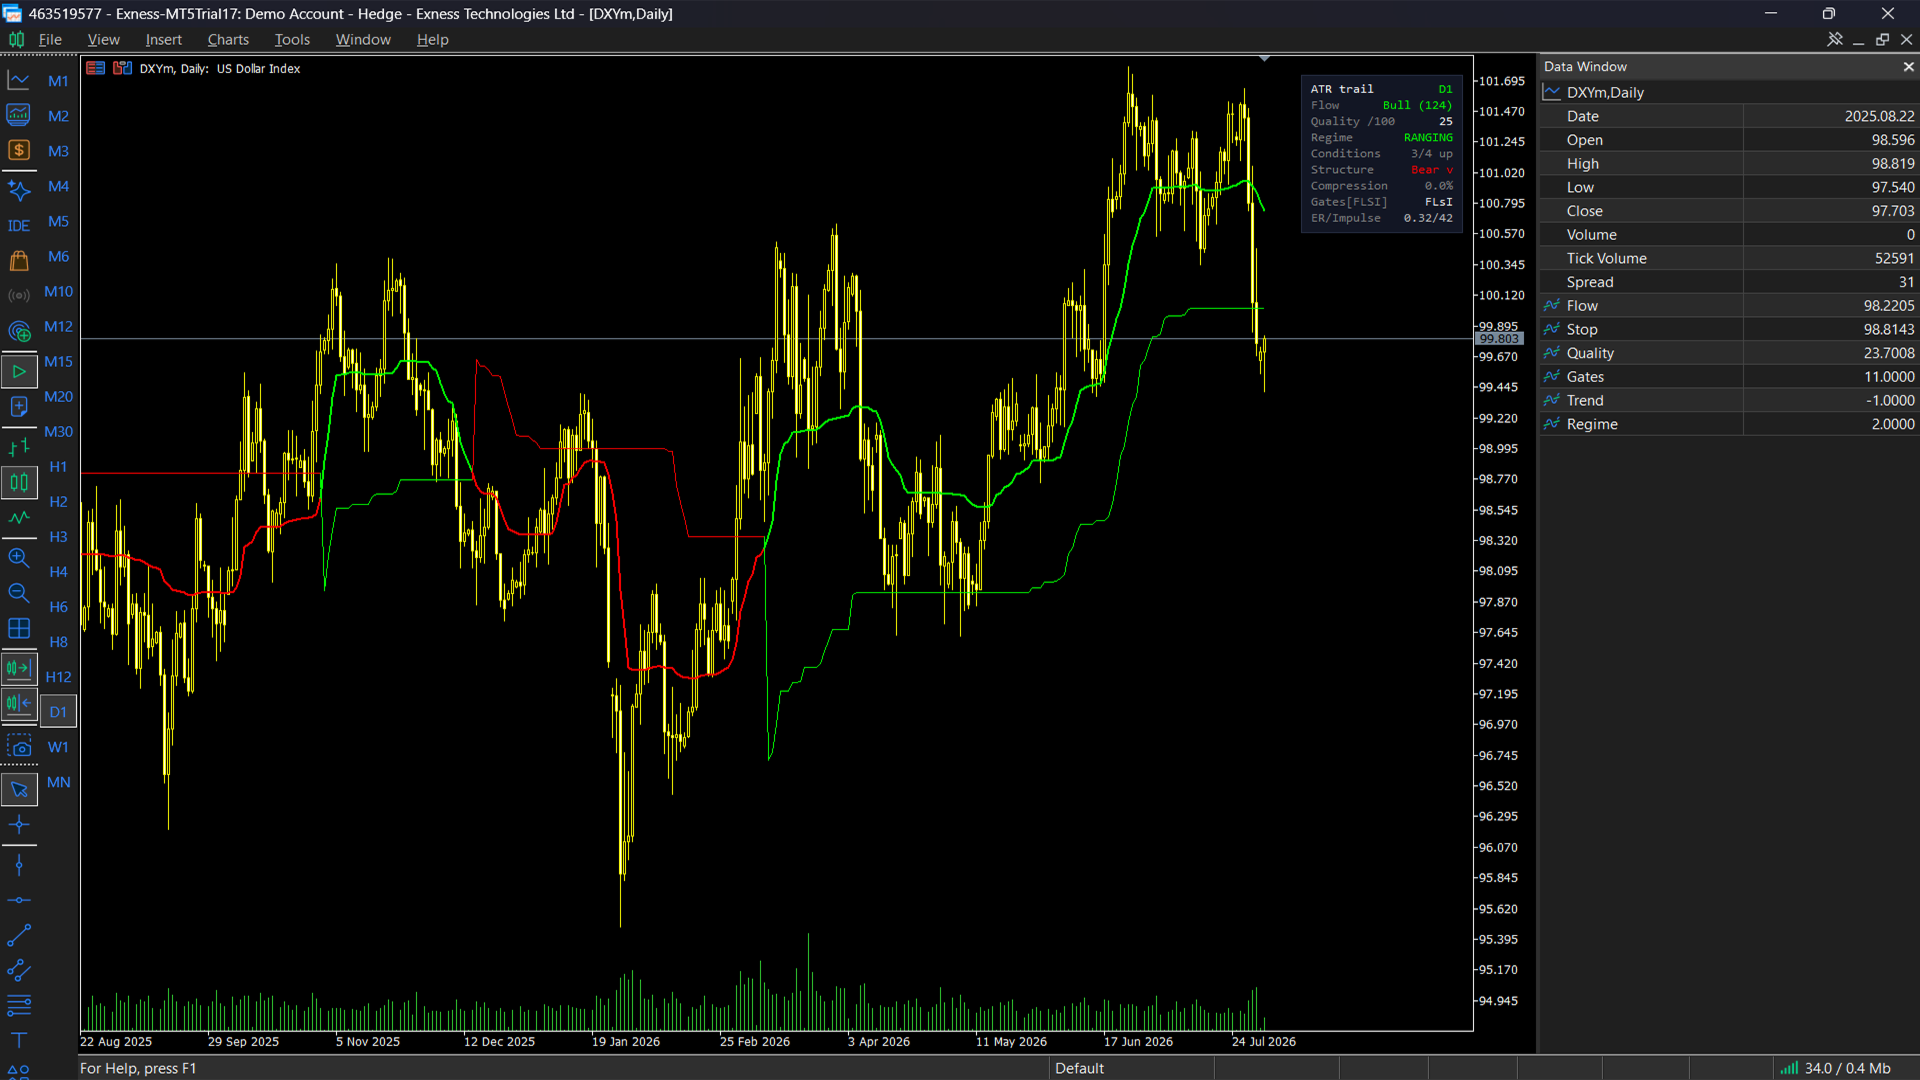
One screenshot shows the Data Window with these values labelled against a single bar.
Inputs
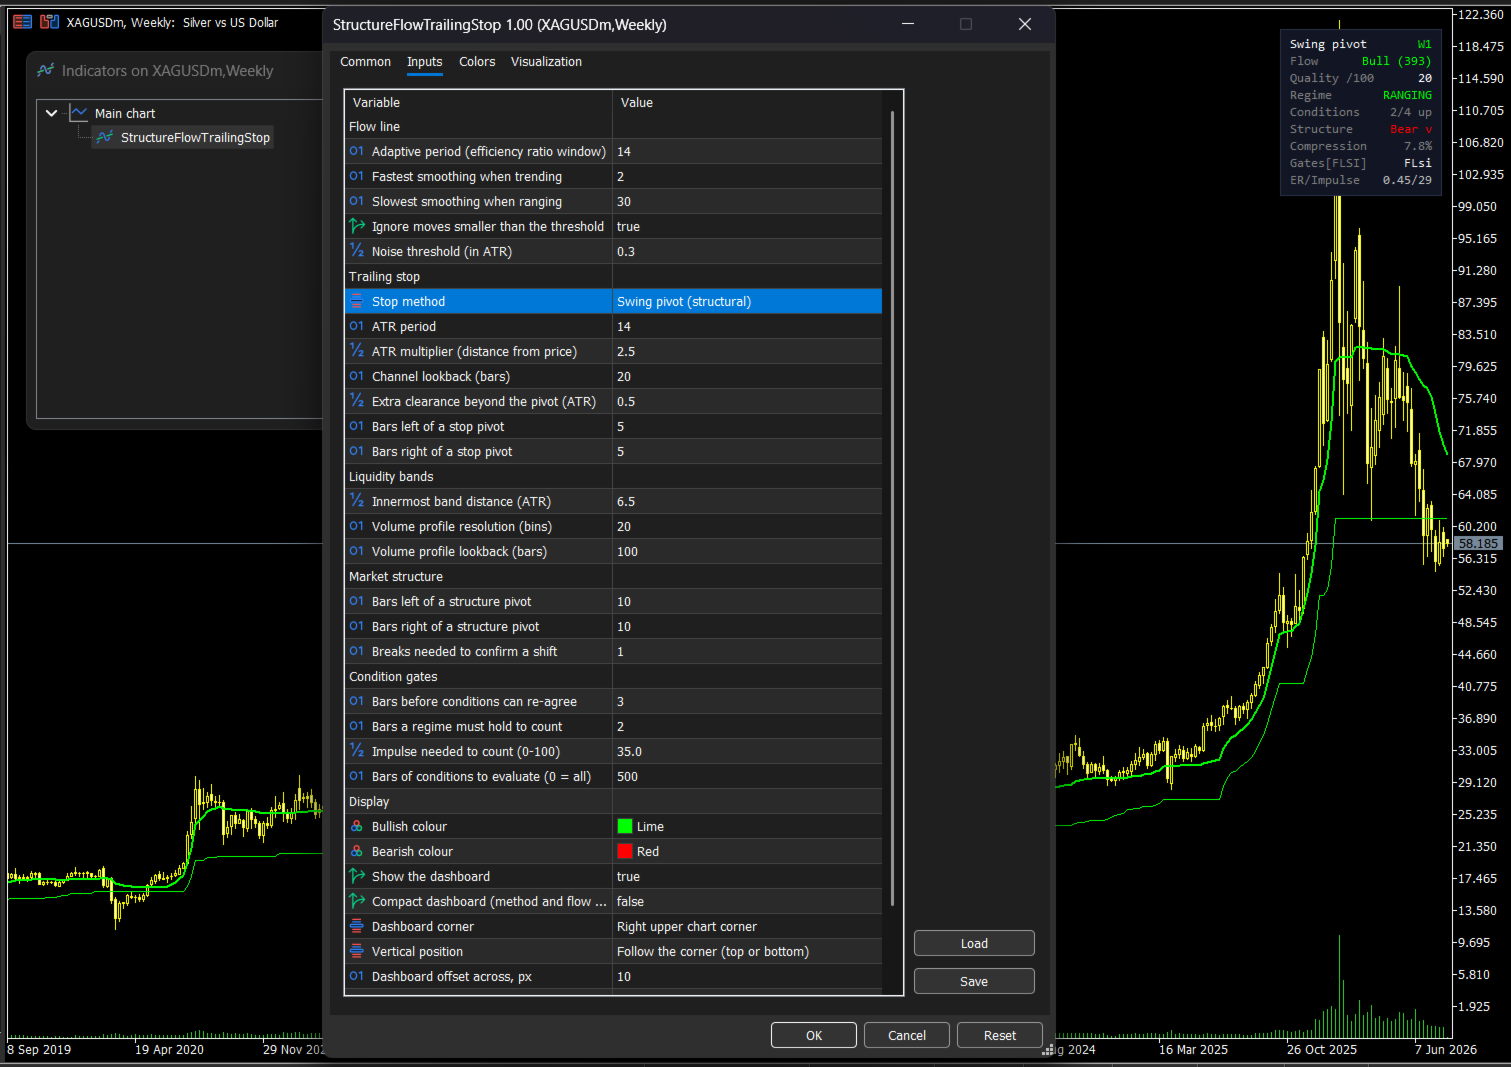
- Flow line — the adaptive window, the fastest and slowest smoothing, and the noise threshold in ATR
- Trailing stop — the method, the ATR period and multiplier, the channel lookback, and the pivot settings
- Market structure — how many bars either side define a swing, and how many breaks confirm a shift
- Condition gates — the impulse threshold, how long a regime must hold to count, and how far back to evaluate
- Display — the two colours, and the panel's corner, vertical position, offsets, font size and compact mode
What the screenshots show
- Bitcoin daily with three methods running — swing pivot, Chandelier and SuperTrend, each with its own panel, disagreeing about the same chart.
- The Data Window — every readable buffer against one bar, including the regime and the condition bitmask.
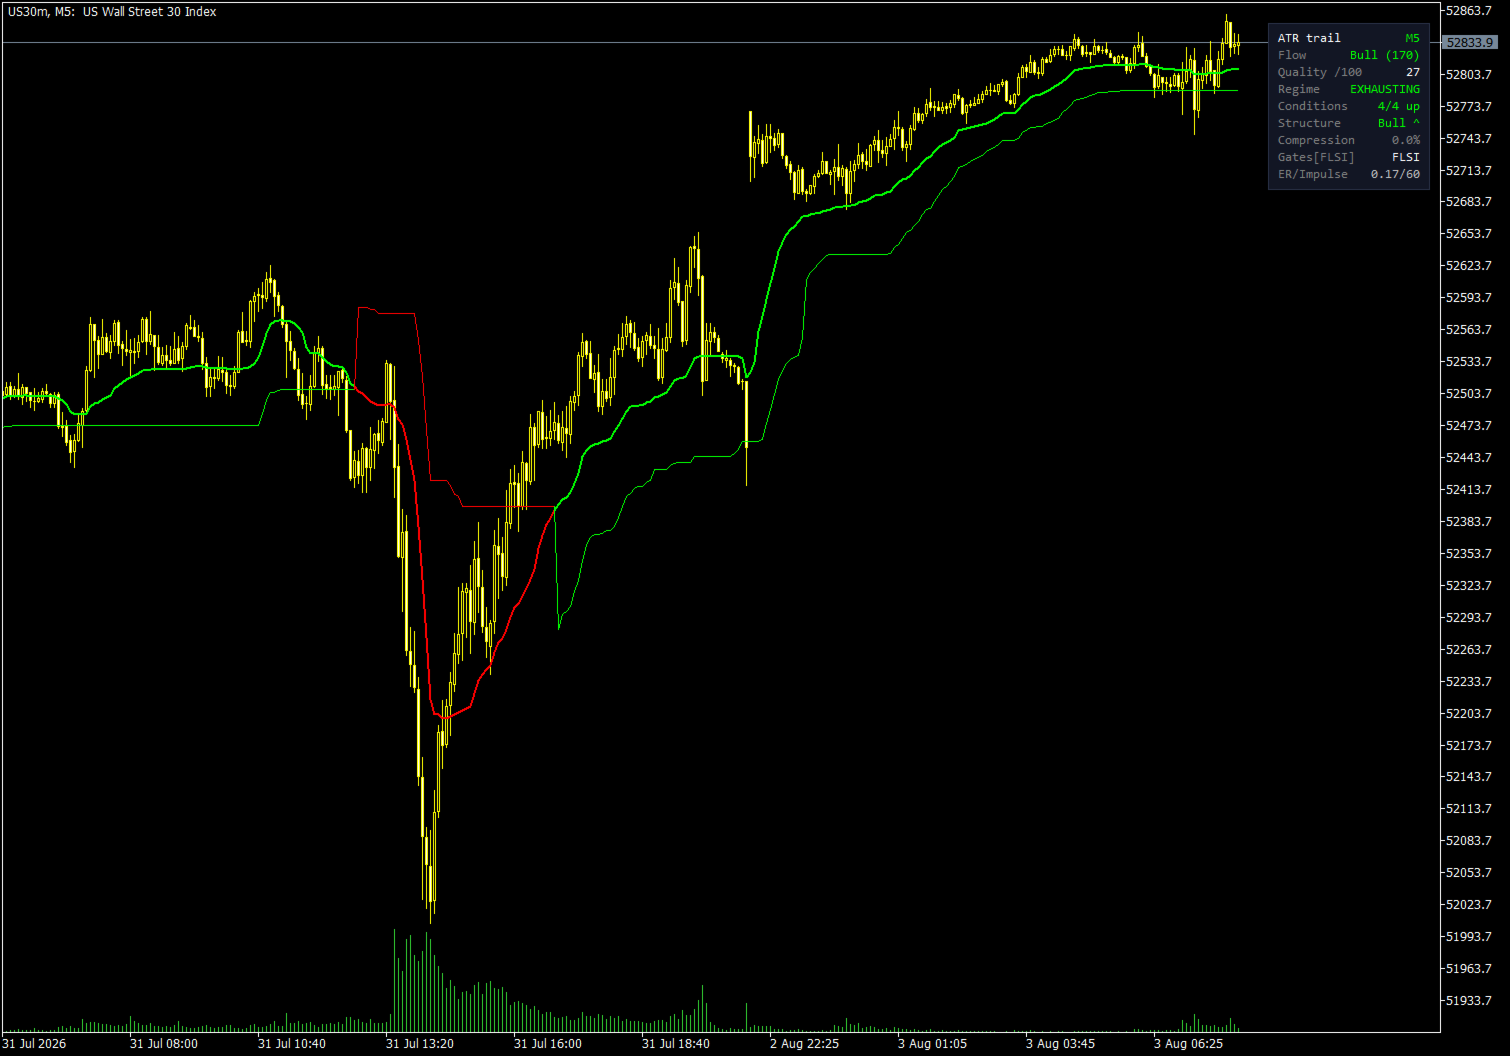
- US30 on five minutes — the stop trailing close behind a sustained recovery, holding its level through each pause.
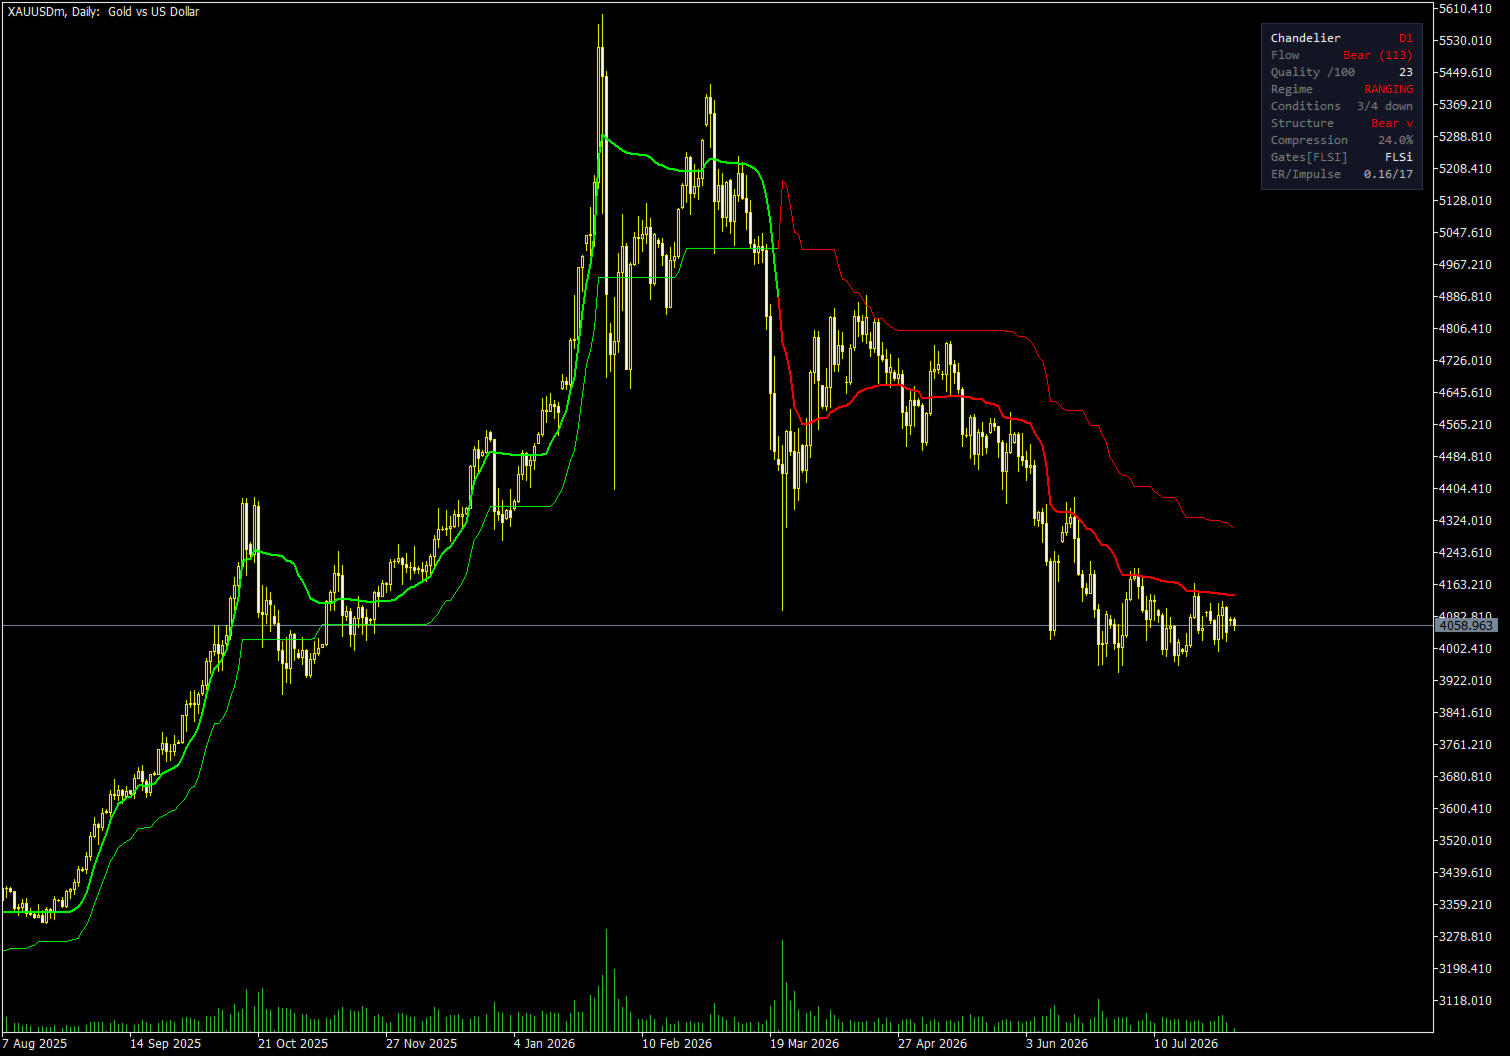
- Gold daily — a full cycle: the stop tracks the rally, flips at the top, then trails the decline.
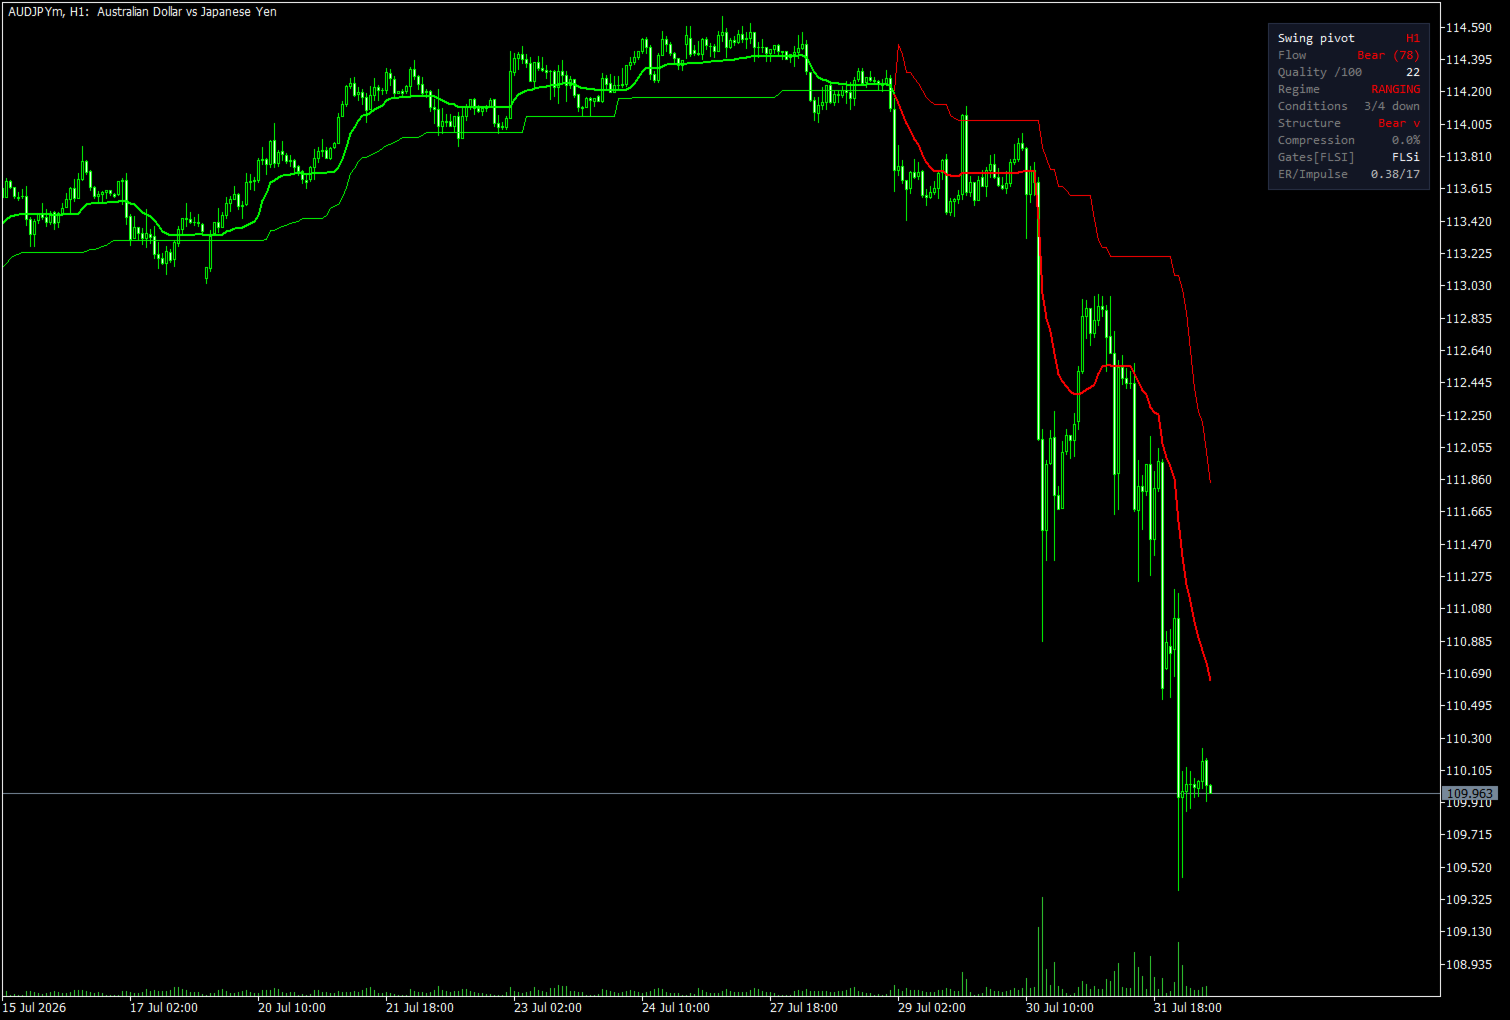
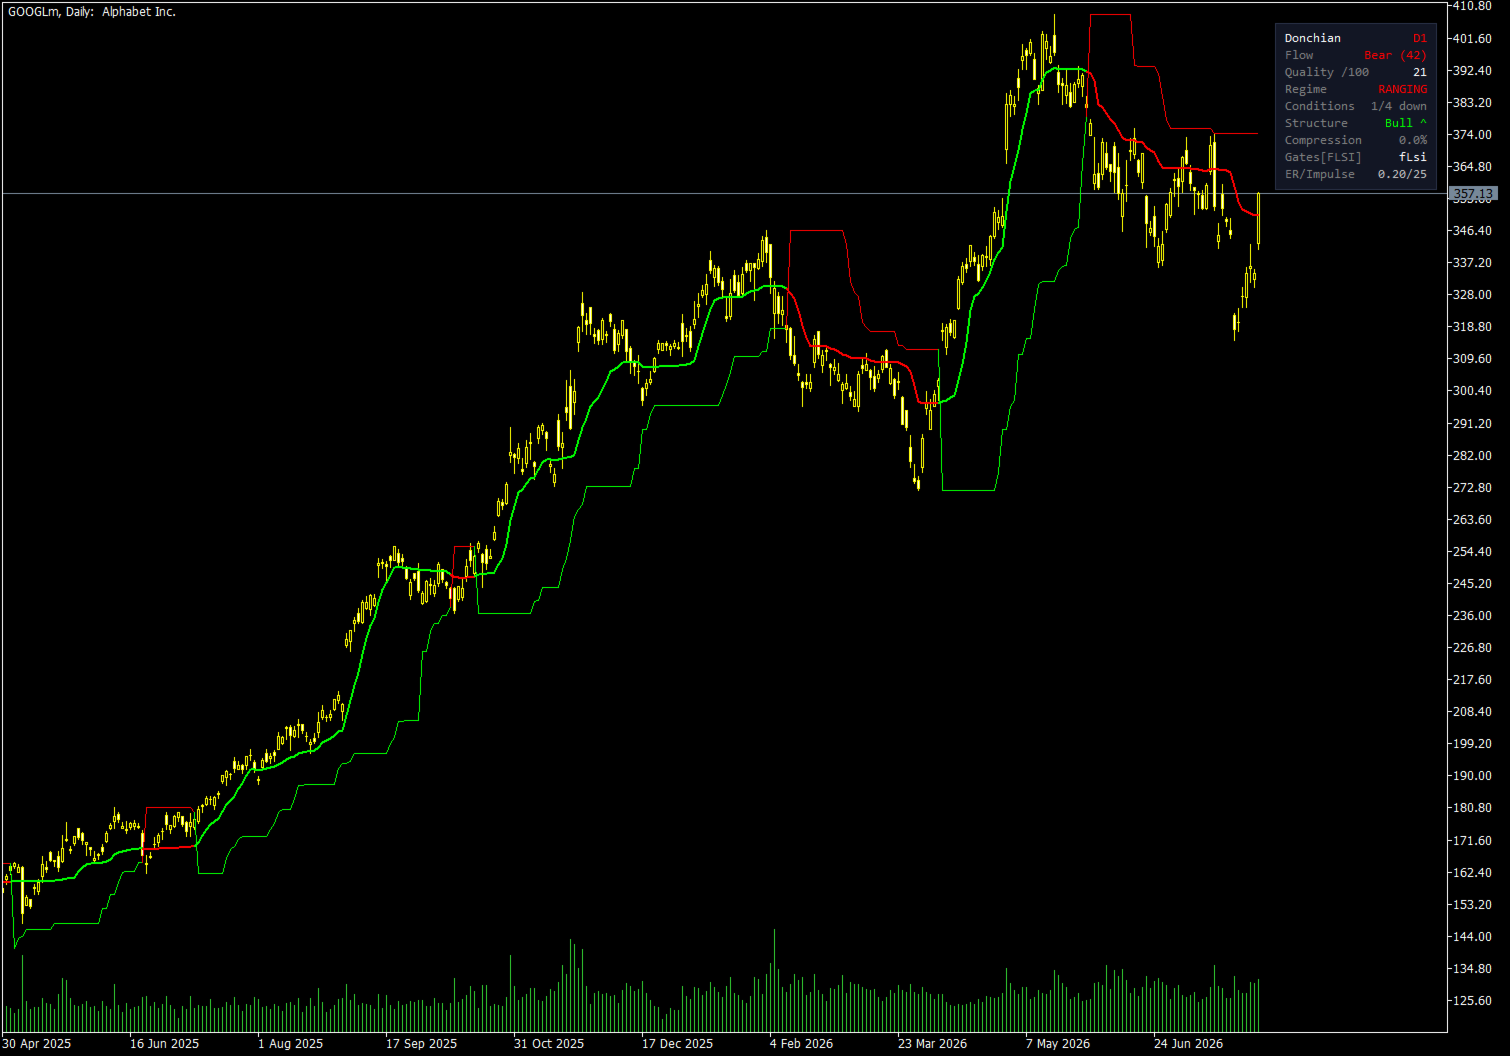
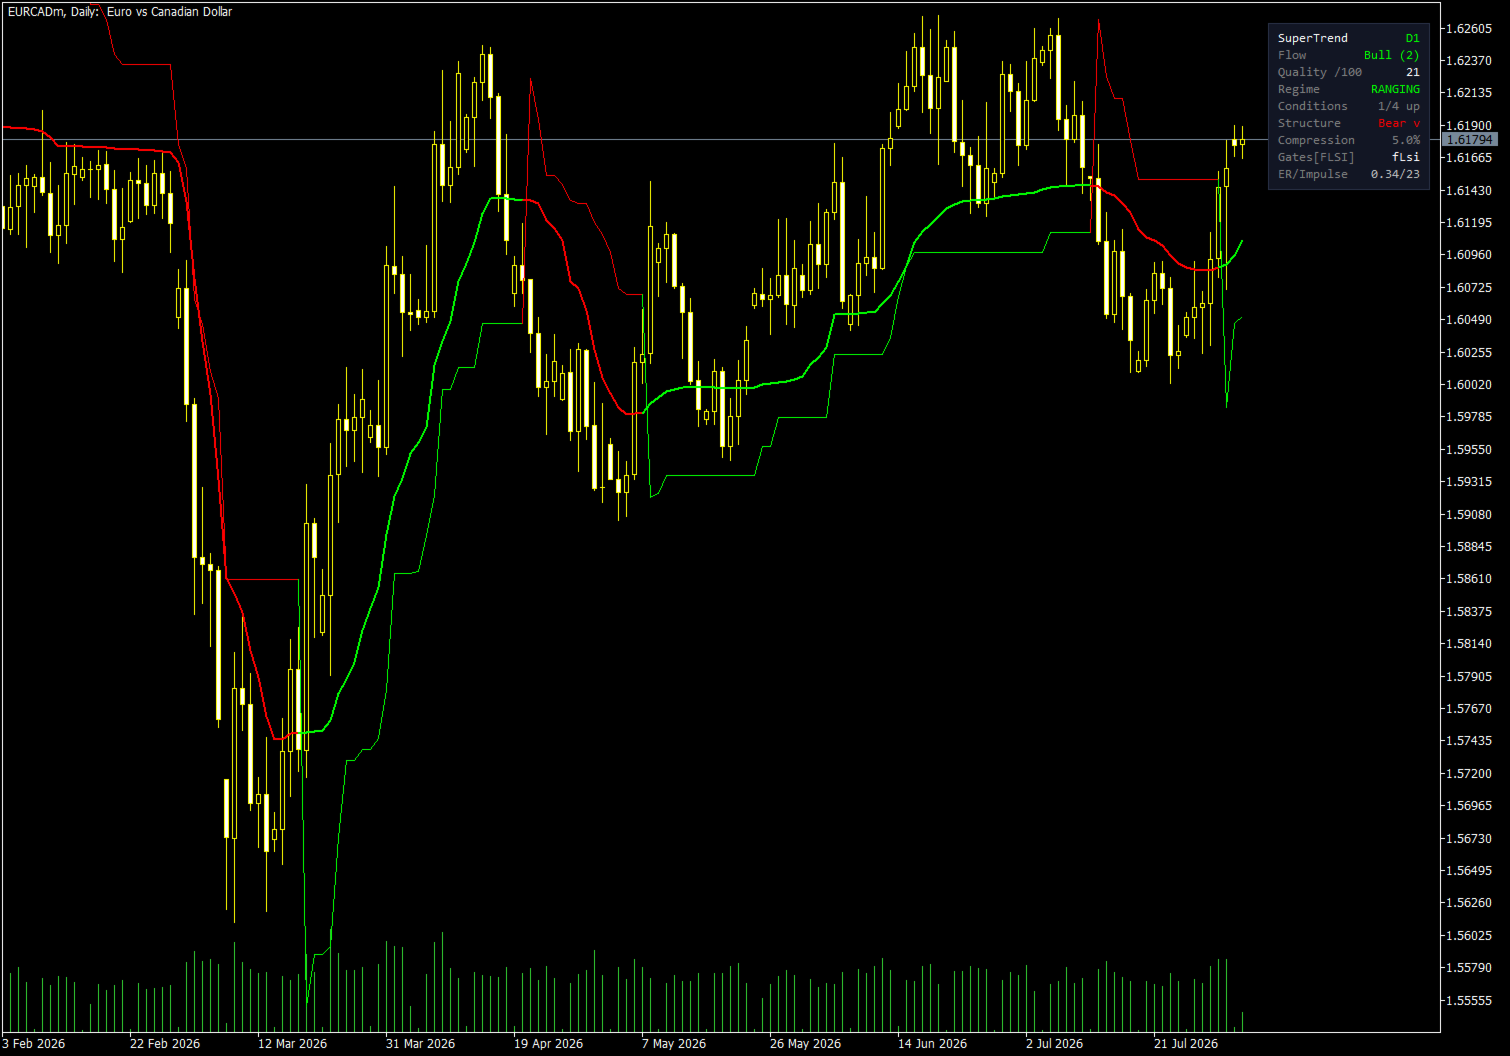
- AUDJPY hourly, and ETHUSD, GOOGL and EURCAD daily — the same behaviour across FX, crypto and equities.
- The panel and the inputs dialog — every setting, with the five methods in the dropdown.
Calculation behaviour
Closed-bar values are final. The forming bar is recalculated on every tick from a copy of the internal state, so the stop reacts to live price while the state that history depends on advances only once, when the bar closes. A trailing stop that updated only at the close would sit still during exactly the moves that matter.
Nothing is drawn before the calculation has the history it needs, and no value is computed from a partial window and then plotted as though it were complete.
Notes
- Draws on the price chart. Two visible lines, no separate window.
- Several instances can be attached to one chart, each with a different method and its own panel. Two instances of the same method should be given different panel positions.
- The stop is a level, not an order. The indicator draws where a trailing stop would sit. It does not know your position, does not place or modify orders, and does not manage trades.
- Volume readings use tick volume, which every broker provides.
- No external dependencies. Every value is calculated inside the indicator. It does not call any other indicator, so there are no handles to fail, nothing to install alongside it, and no dependency on the state of your standard indicator folder.
What this is and is not
This is a tool for technical analysis and for filtering market conditions. It is not a trading system, it produces no buy or sell signals, it gives no investment advice, and it does not open or manage positions.
There are deliberately no entry arrows. A stop level and a count of agreeing conditions describe where the market is; turning that into a decision is the reader's job, not the indicator's.
It is descriptive rather than predictive, and no claim is made about its performance.
The free demo runs in the Strategy Tester. Put it on the instruments and timeframes you actually trade, try each of the five stop methods, and judge it against your own charts.
| More tools from this developer I build MT5 indicators and Expert Advisors with an emphasis on clean, documented, no-repaint code — closed-bar logic, validated buffers, and no dependencies on other indicators. The five-state regime classification here is the same one used in the Oscillator Regime Suite, which applies it to volume-derived series in a separate window rather than to price on the chart. Questions about the calculation, the buffers, or using this in your own EA? Send me a private message — I am happy to answer. |
Built and maintained by Narayanan Mohanan, MT5/MQL5 developer.