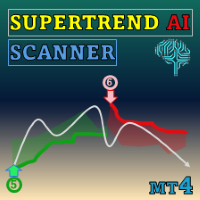
SuperTrend System MT5 Multi TF Scanner
- Indicators
-
Duc Hoan Nguyen
 I develop practical trading tools for MetaTrader 4/5, with a focus on indicator integration, Multi-Timeframe analysis, market scanning, and automated trading solutions.
My work mainly includes:
• Indicator-to-EA Solutions - Version: 1.1
- Updated: 28 September 2026
- Activations: 10
Get this indicator and more for free here: Convert indicator into a trading robot (no coding required)
Special offer: ALL TOOLS, just $35 each for a limited time!
New tools will be $30 for the first week or the first 3 purchases!
Trading Tools Channel on MQL5: Join my MQL5 channel to update the latest news from me
See more MT5 version at: SuperTrend System MT5 Multi TF Scanner
See more MT4 version at: SuperTrend System MT4 Multi TF Scanner
See more products at: All Products or Trading Indicators, Special Offers & New Releases
SuperTrend Multi-Timeframe & Scanner keeps the core SuperTrend logic easy to read while adding practical tools for monitoring Trend Shifts, price touches of the active SuperTrend line, and broader market context through Multi-Timeframe and Multi-Symbol functions.
The indicator helps answer three simple questions: Is SuperTrend Bullish or Bearish? Has the direction just changed? And has price returned to the active SuperTrend line?
1. How SuperTrend worksFor each timeframe, the indicator continuously calculates an Upper Line, a Lower Line, and the current Trend Direction. The current direction determines which line is active and displayed on the chart.
2. What determines the SuperTrend line?1.1. Bullish / Uptrend
When SuperTrend is in a Bullish state, the Lower Line becomes active and is displayed below price as the Uptrend Line. The Upper Line is not displayed during this state.
Bullish → Lower Line → Uptrend Line
1.2. Bearish / Downtrend
When SuperTrend is in a Bearish state, the Upper Line becomes active and is displayed above price as the Downtrend Line. The Lower Line is not displayed during this state.
Bearish → Upper Line → Downtrend Line
The main settings affecting the SuperTrend structure are:
- ATR Period
- ATR Multiplier
- Applied Price
- Trend Shift Confirmation Method
ATR allows the SuperTrend structure to adapt to changing market volatility instead of using a fixed distance from price.
In general:
Smaller ATR Multiplier → line closer to price → more sensitive
Larger ATR Multiplier → line farther from price → less sensitive
ATR Period also affects how the volatility component reacts to changing market conditions. There is no single setting that must be used for every symbol or timeframe; the parameters can be adjusted according to how SuperTrend is used in your trading approach.
3. Trend Shift: when does the active line change?A price interaction with the SuperTrend line does not automatically mean that the trend has changed. The indicator separates two different events:
- Price touches the SuperTrend line
- A confirmed Trend Shift
A Trend Shift occurs only when the conditions defined by the selected Trend Shift Confirmation Method are satisfied. The default method is Close.
Downtrend Line → Bullish Trend Shift → Uptrend Line
Uptrend Line → Bearish Trend Shift → Downtrend Line
When the direction changes, the previous SuperTrend segment ends and a new segment begins.
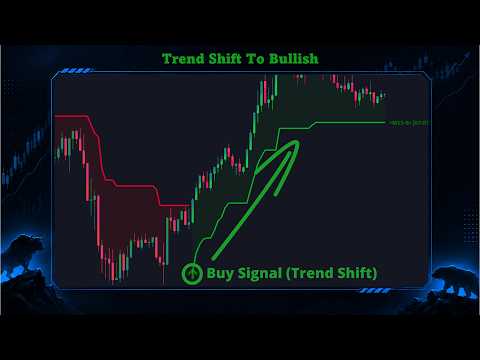
4. How Buy and Sell arrows are createdThe Buy and Sell arrows are created directly from changes in the SuperTrend direction. They are not generated by a separate entry algorithm.
4.1. Buy Signal
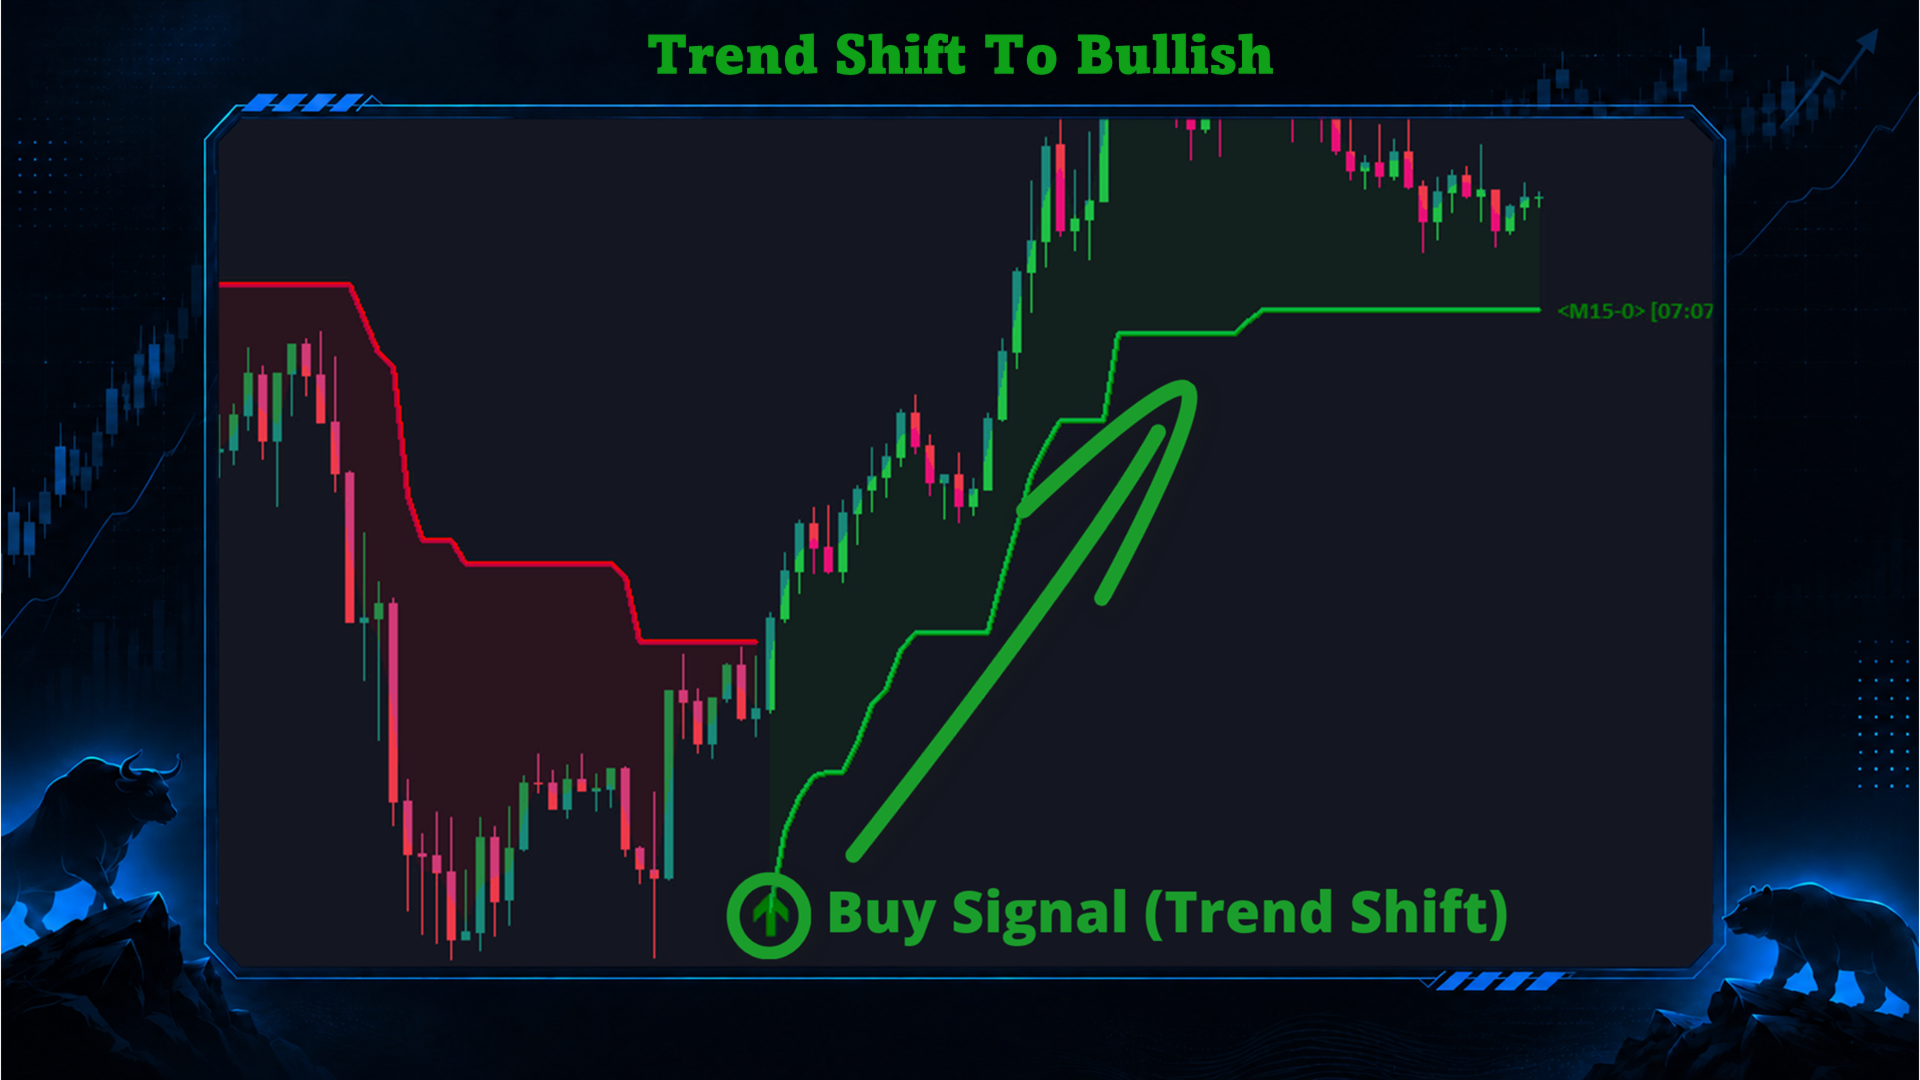
A Buy Signal appears when the previous SuperTrend state is Bearish and the new state becomes Bullish:
Bearish → Bullish
At that point, the Downtrend state ends, a new Uptrend begins, the Lower Line becomes active, and the Buy Arrow is placed at the new Uptrend Line.
4.2. Sell Signal
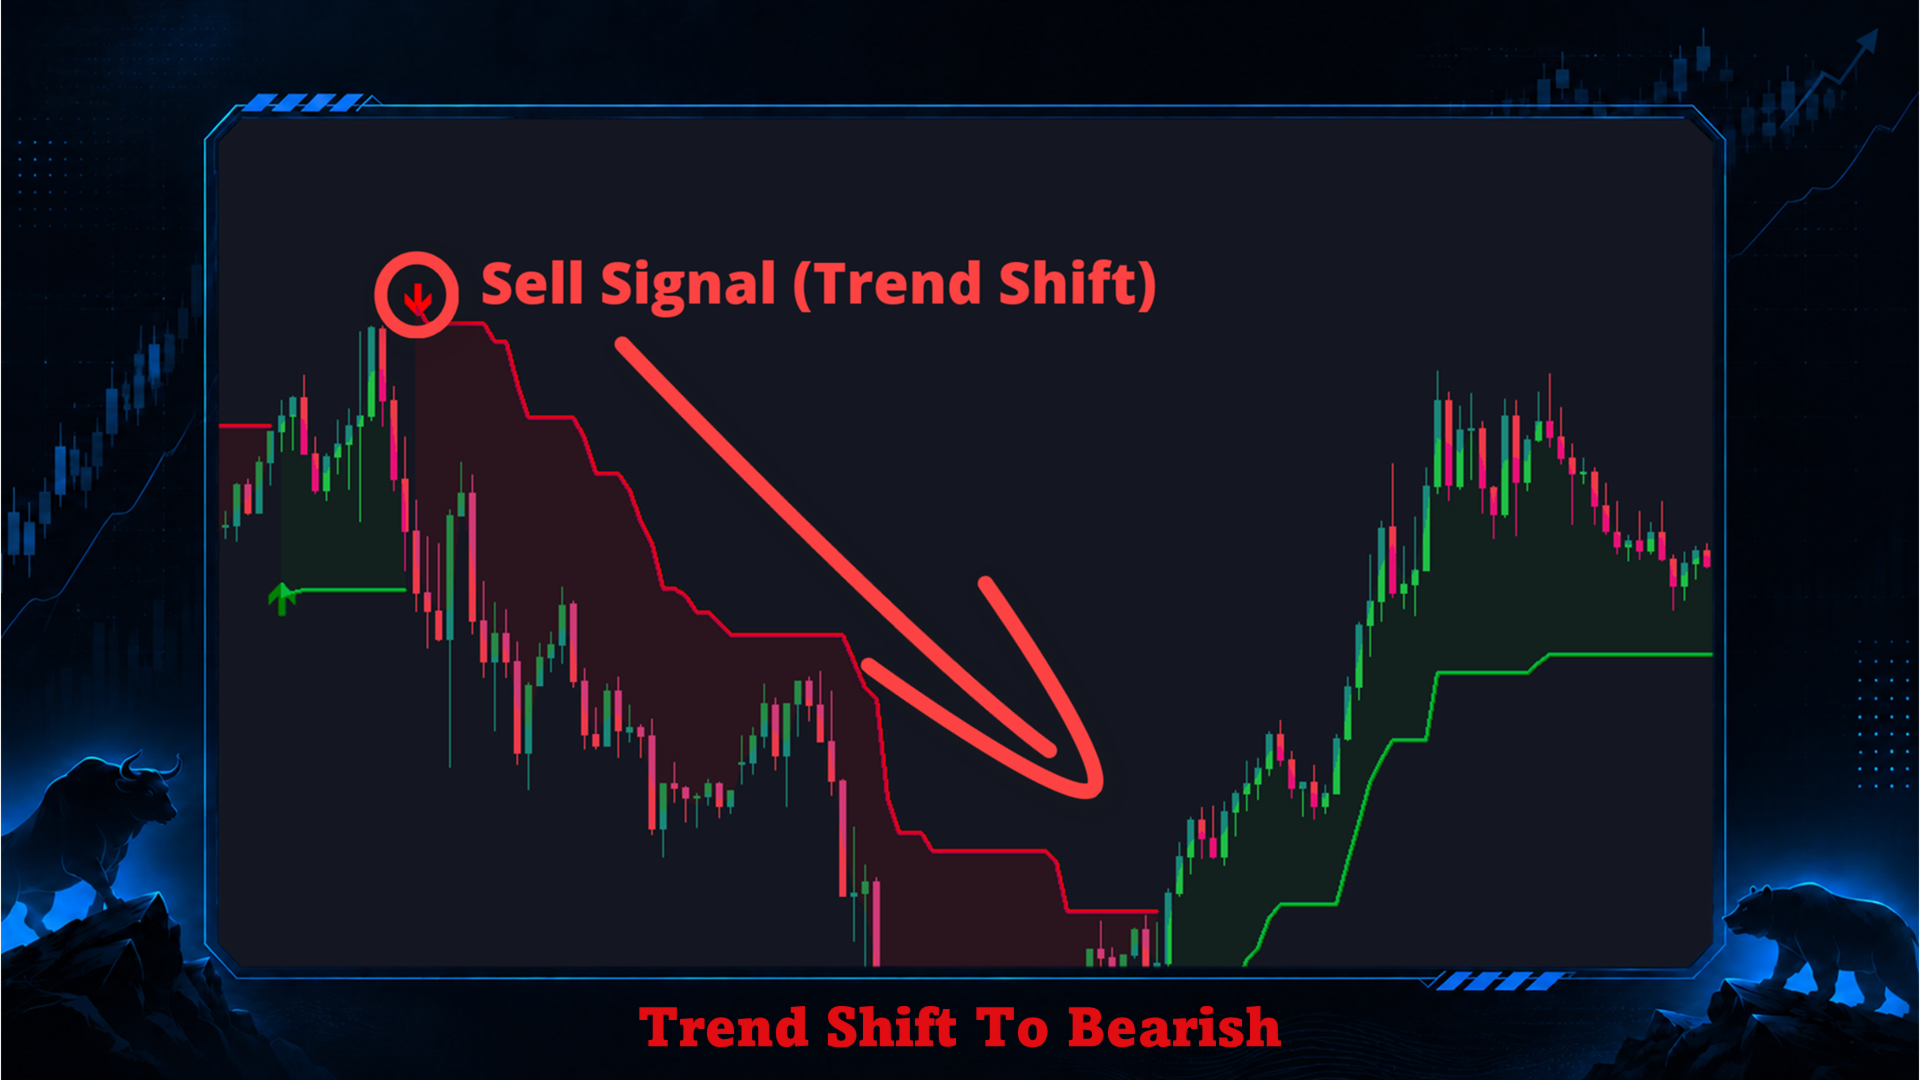
A Sell Signal appears when the previous SuperTrend state is Bullish and the new state becomes Bearish:
Bullish → Bearish
At that point, the Uptrend state ends, a new Downtrend begins, the Upper Line becomes active, and the Sell Arrow is placed at the new Downtrend Line.
A Buy Arrow therefore means that SuperTrend has changed from Bearish to Bullish, while a Sell Arrow means that SuperTrend has changed from Bullish to Bearish.
The arrows are best understood as Trend Shift markers, rather than standalone trading recommendations. They can be used as a change in directional bias, an additional confirmation, a lower-timeframe trigger, or simply an indication that a new SuperTrend phase has started.
5. Price Touch: monitor pullbacks and retestsA Trend Shift is not the only useful SuperTrend event. Price can remain in the same trend, move away from the active line, and later return to it.
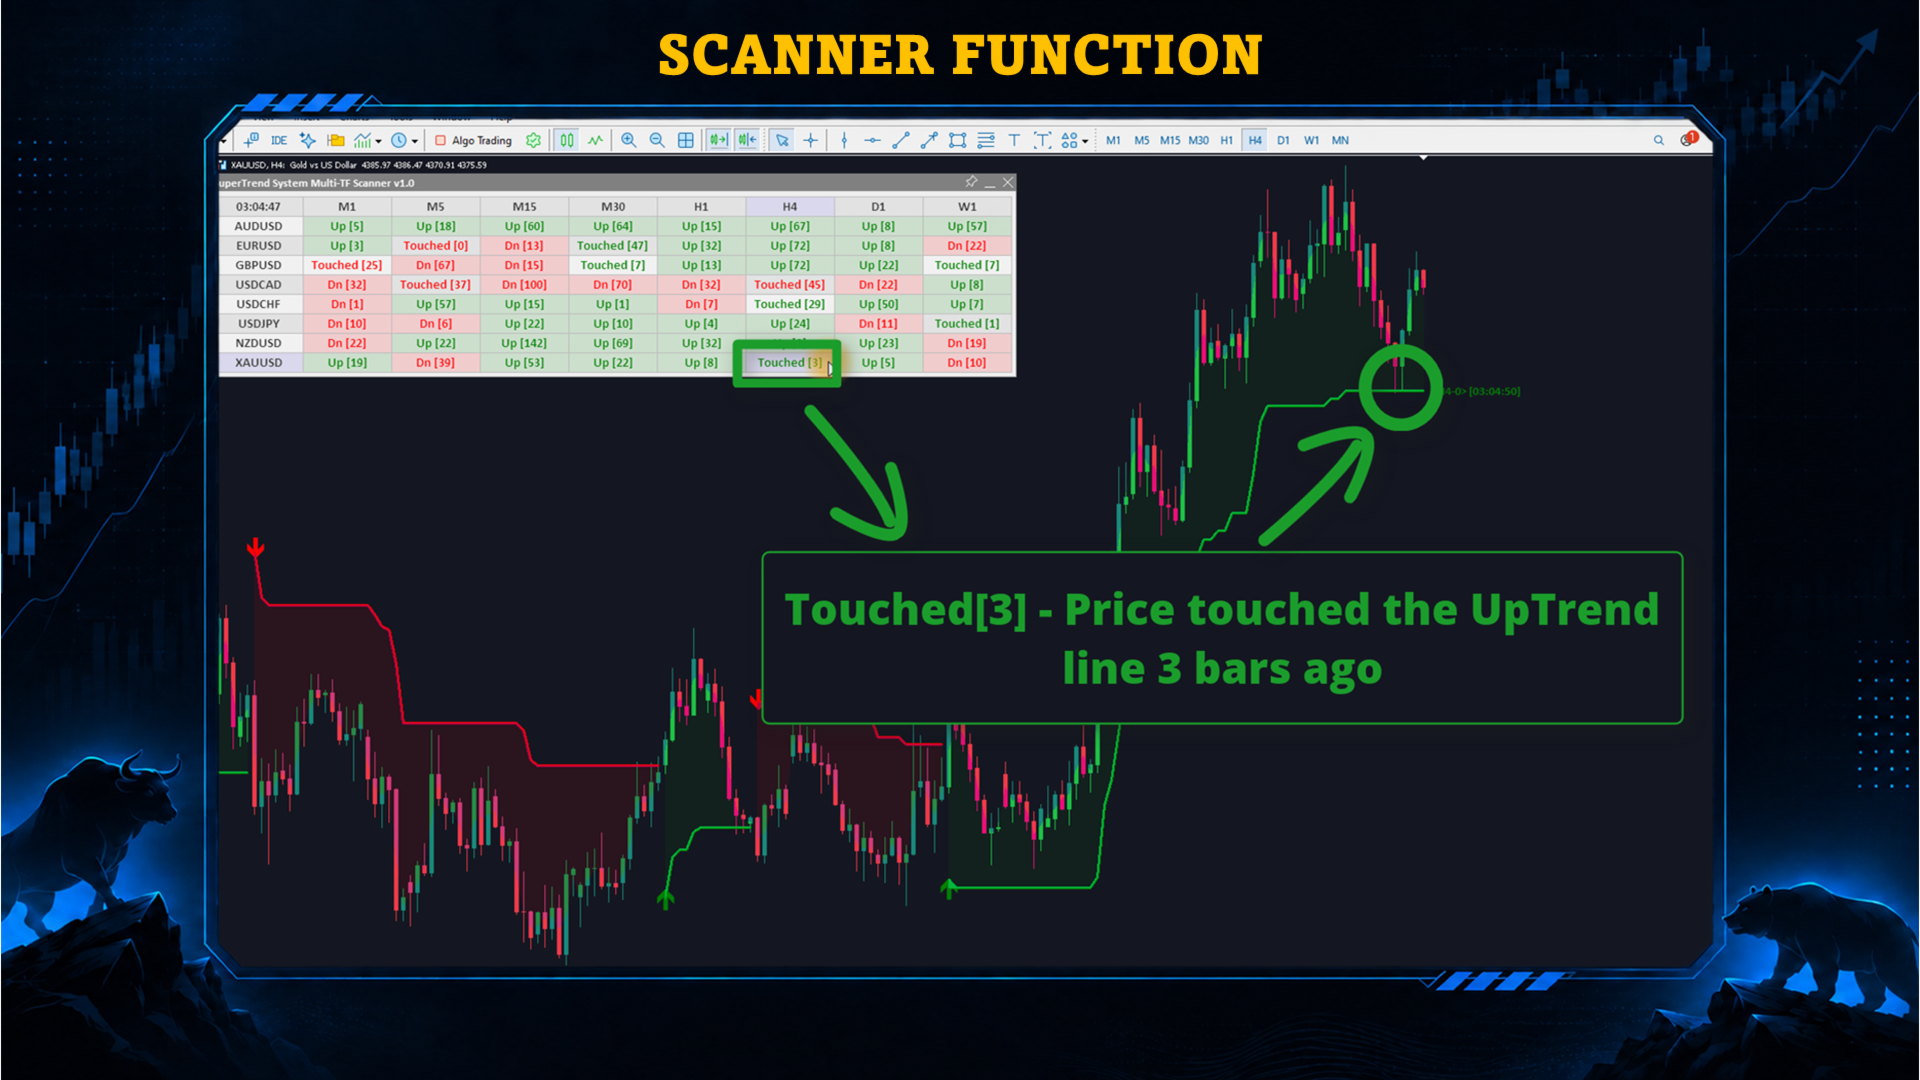
The indicator therefore separately detects when price touches the active Uptrend Line or Downtrend Line. A touch is detected when the candle's High-Low range reaches the corresponding SuperTrend line.
Uptrend → Price returns to Uptrend Line → Uptrend Line Touch
Downtrend → Price returns to Downtrend Line → Downtrend Line Touch
A Line Touch does not mean that the SuperTrend direction has changed. This makes it useful for monitoring pullbacks, retests, potential trend-continuation areas, or locations where you want to perform additional analysis.
6. Trend Shift vs. Line TouchTrend Shift: Has the SuperTrend direction changed?
Line Touch: Has price returned to the active SuperTrend line?
A Line Touch can occur while the current trend remains unchanged. A Trend Shift means that the SuperTrend direction itself has changed.
7. The complete logic at a glance8. AlertsDuring an Uptrend:
Bullish State → Lower Line active → Uptrend Line below price → Price may touch the line → Trend Shift conditions confirmed → Sell Arrow → Downtrend Line begins
During a Downtrend:
Bearish State → Upper Line active → Downtrend Line above price → Price may touch the line → Trend Shift conditions confirmed → Buy Arrow → Uptrend Line begins
The indicator provides two main alert conditions:
9. Practical ways to use SuperTrend8.1. Trend Shift Alert
Notifies you when a Bullish or Bearish Trend Shift has been confirmed. Trend Shift Alerts are checked using the completed candle.
8.2. Line Touch Alert
Notifies you when price reaches the active Uptrend or Downtrend Line. Line Touch Alerts monitor the current candle, allowing the event to be detected while price is interacting with the SuperTrend level.
Available alert channels:
- Alert Message
- Push Notification
- Send Email
- Sound
10. Multi-Timeframe & Multi-Symbol9.1. Trend Filter
Use the active SuperTrend state to establish directional bias:
Uptrend Line active → Bullish state
Downtrend Line active → Bearish state9.2. Trend Shift Detection
Use Buy and Sell arrows to identify when the SuperTrend direction changes. The Trend Shift can be used as an additional condition instead of being treated as an automatic entry.
9.3. Pullback / Retest Monitoring
Use Line Touch conditions to identify when price returns to the active SuperTrend line and then evaluate the market using your own trading rules.
9.4. Higher-Timeframe Context
A Trend Shift can be interpreted together with other timeframes. For example, H4 Bullish + H1 Bullish + M15 Buy Signal has a different context from H4 Bearish + H1 Bearish + M15 Buy Signal, even though the M15 arrow represents the same type of M15 Trend Shift.
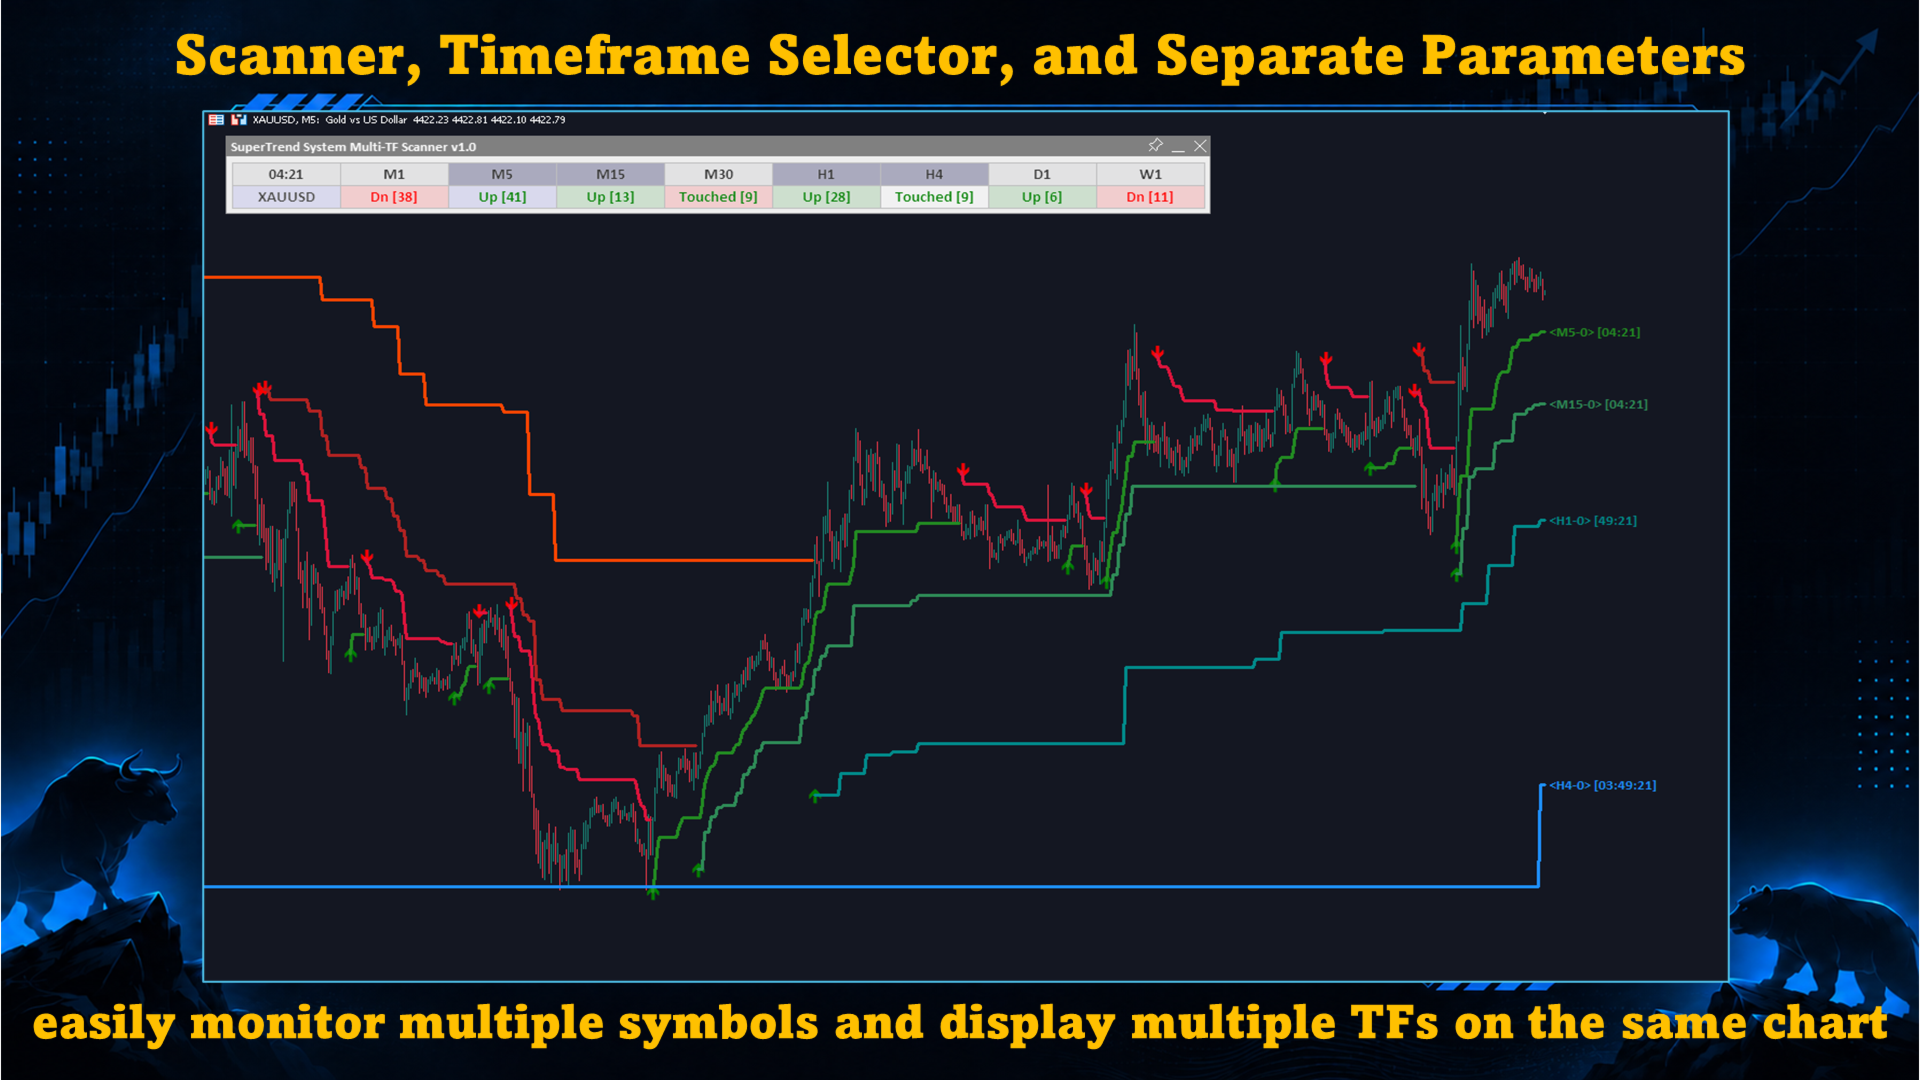
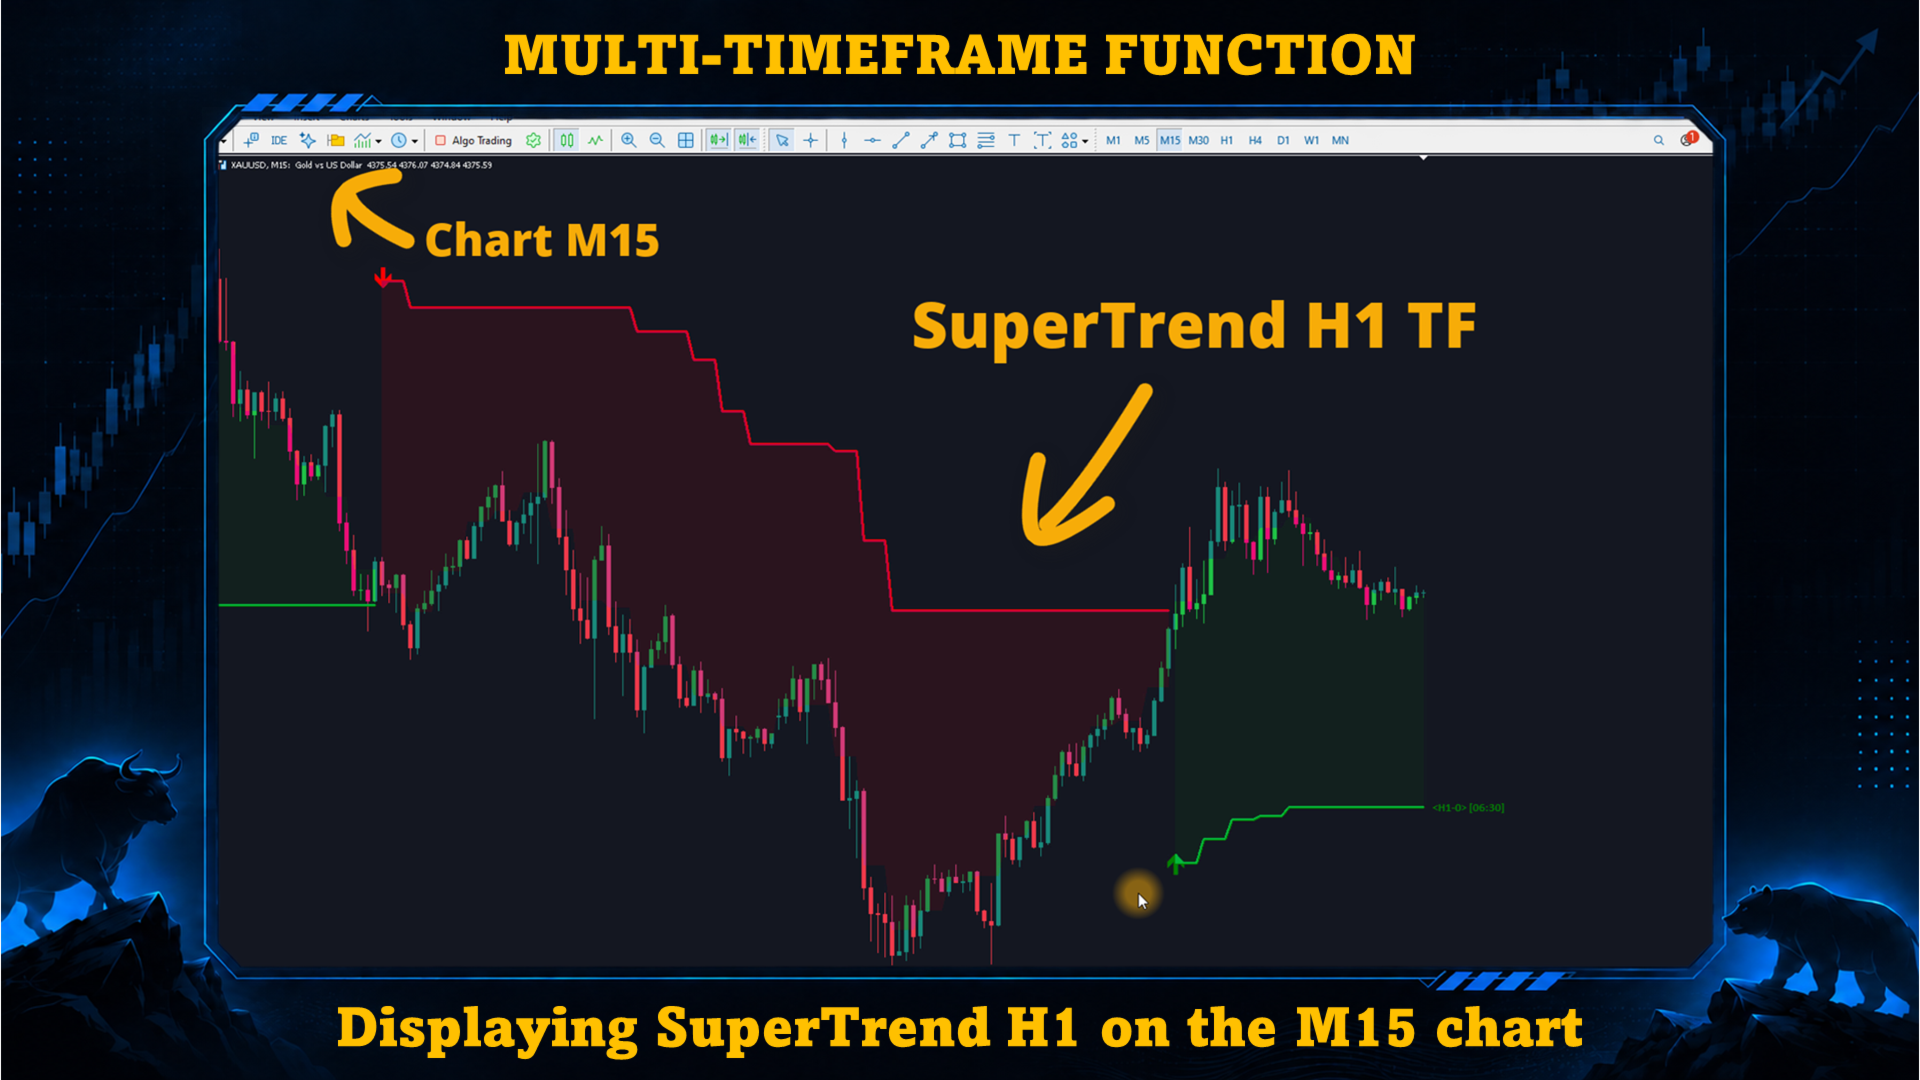
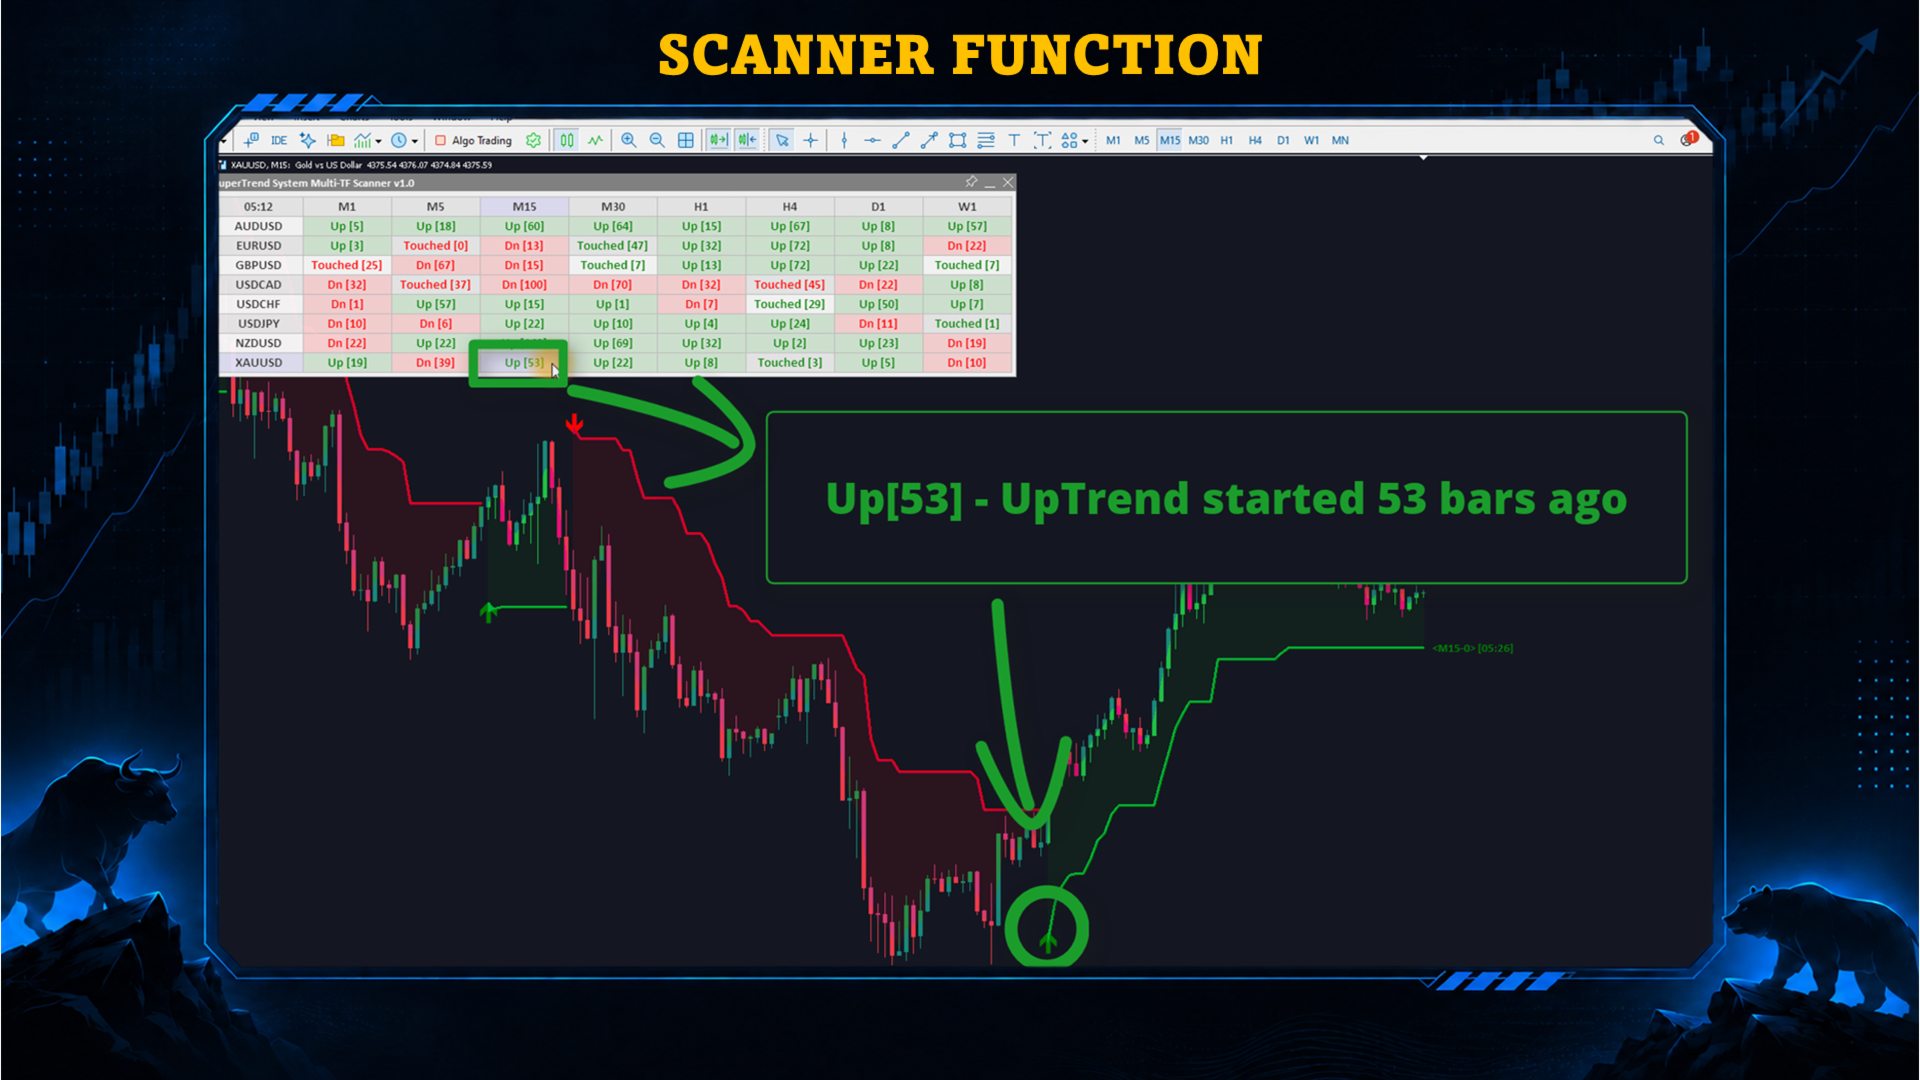
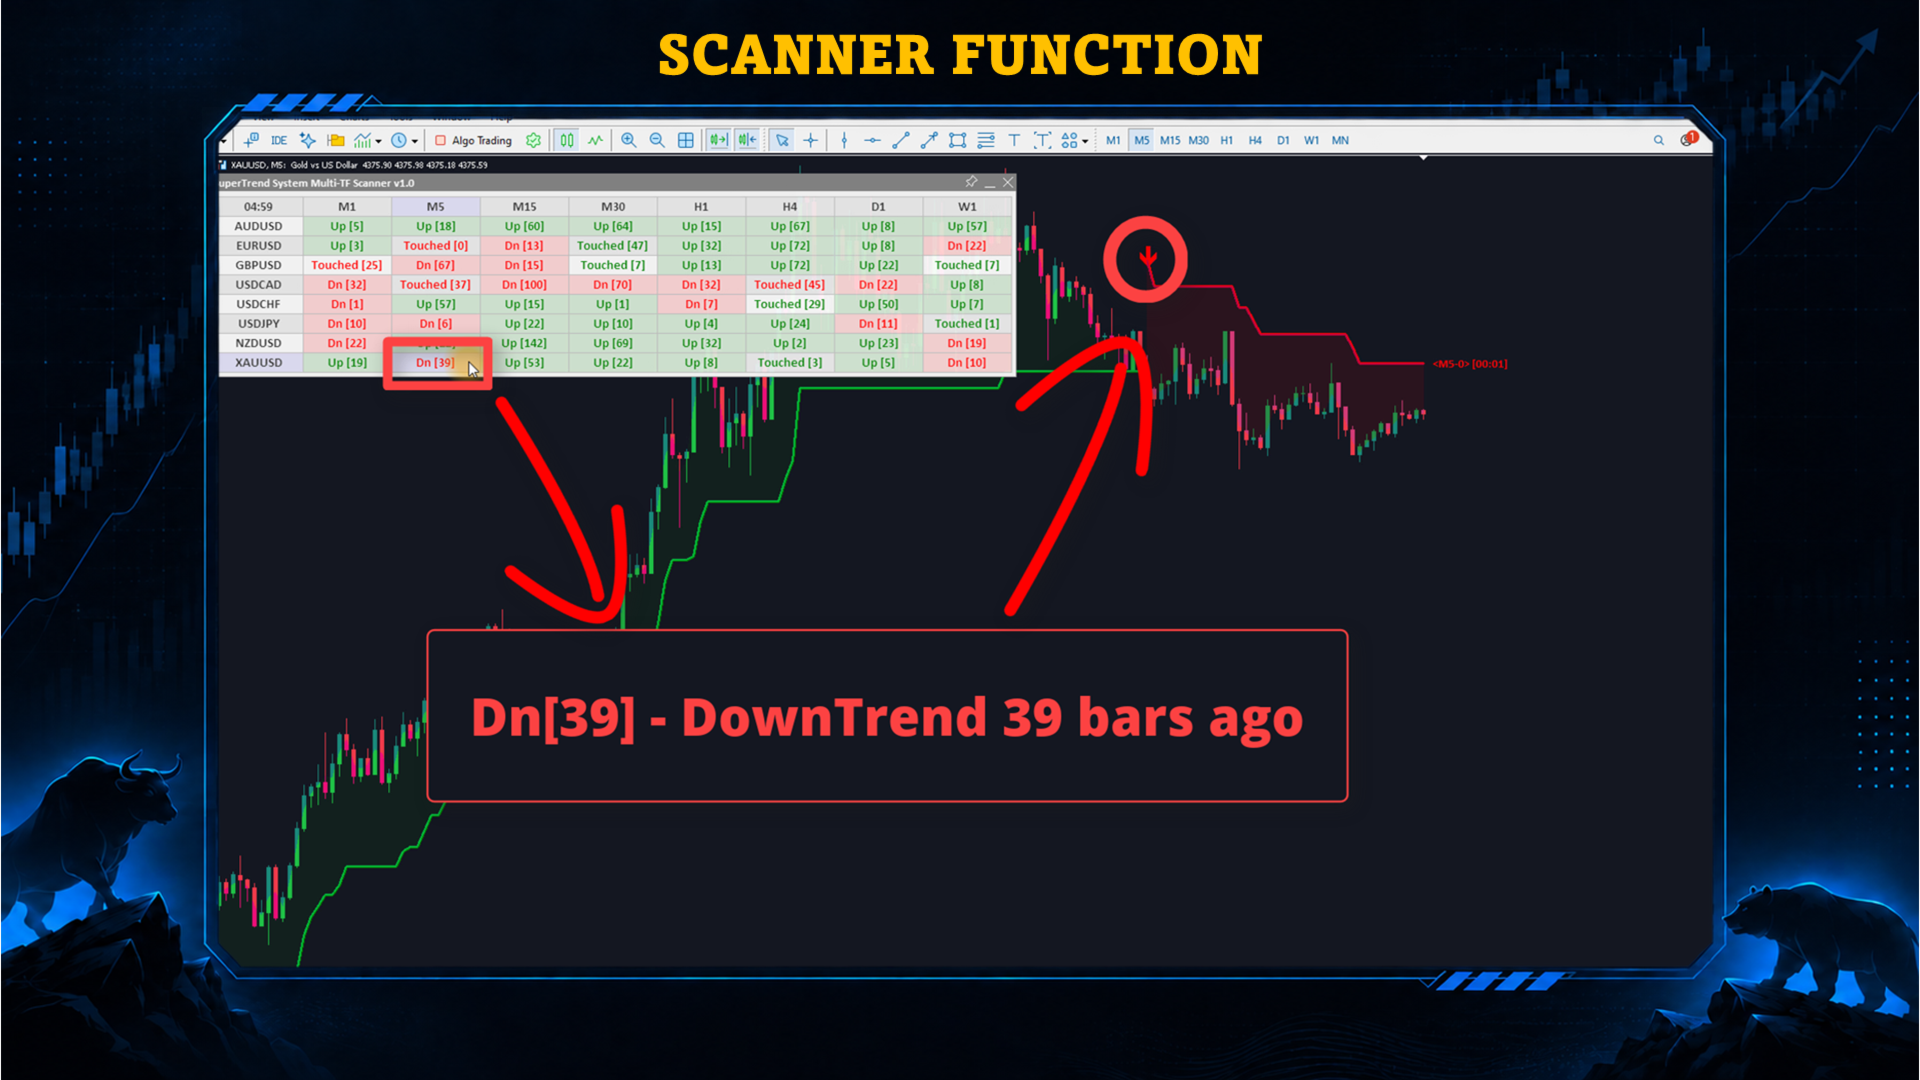
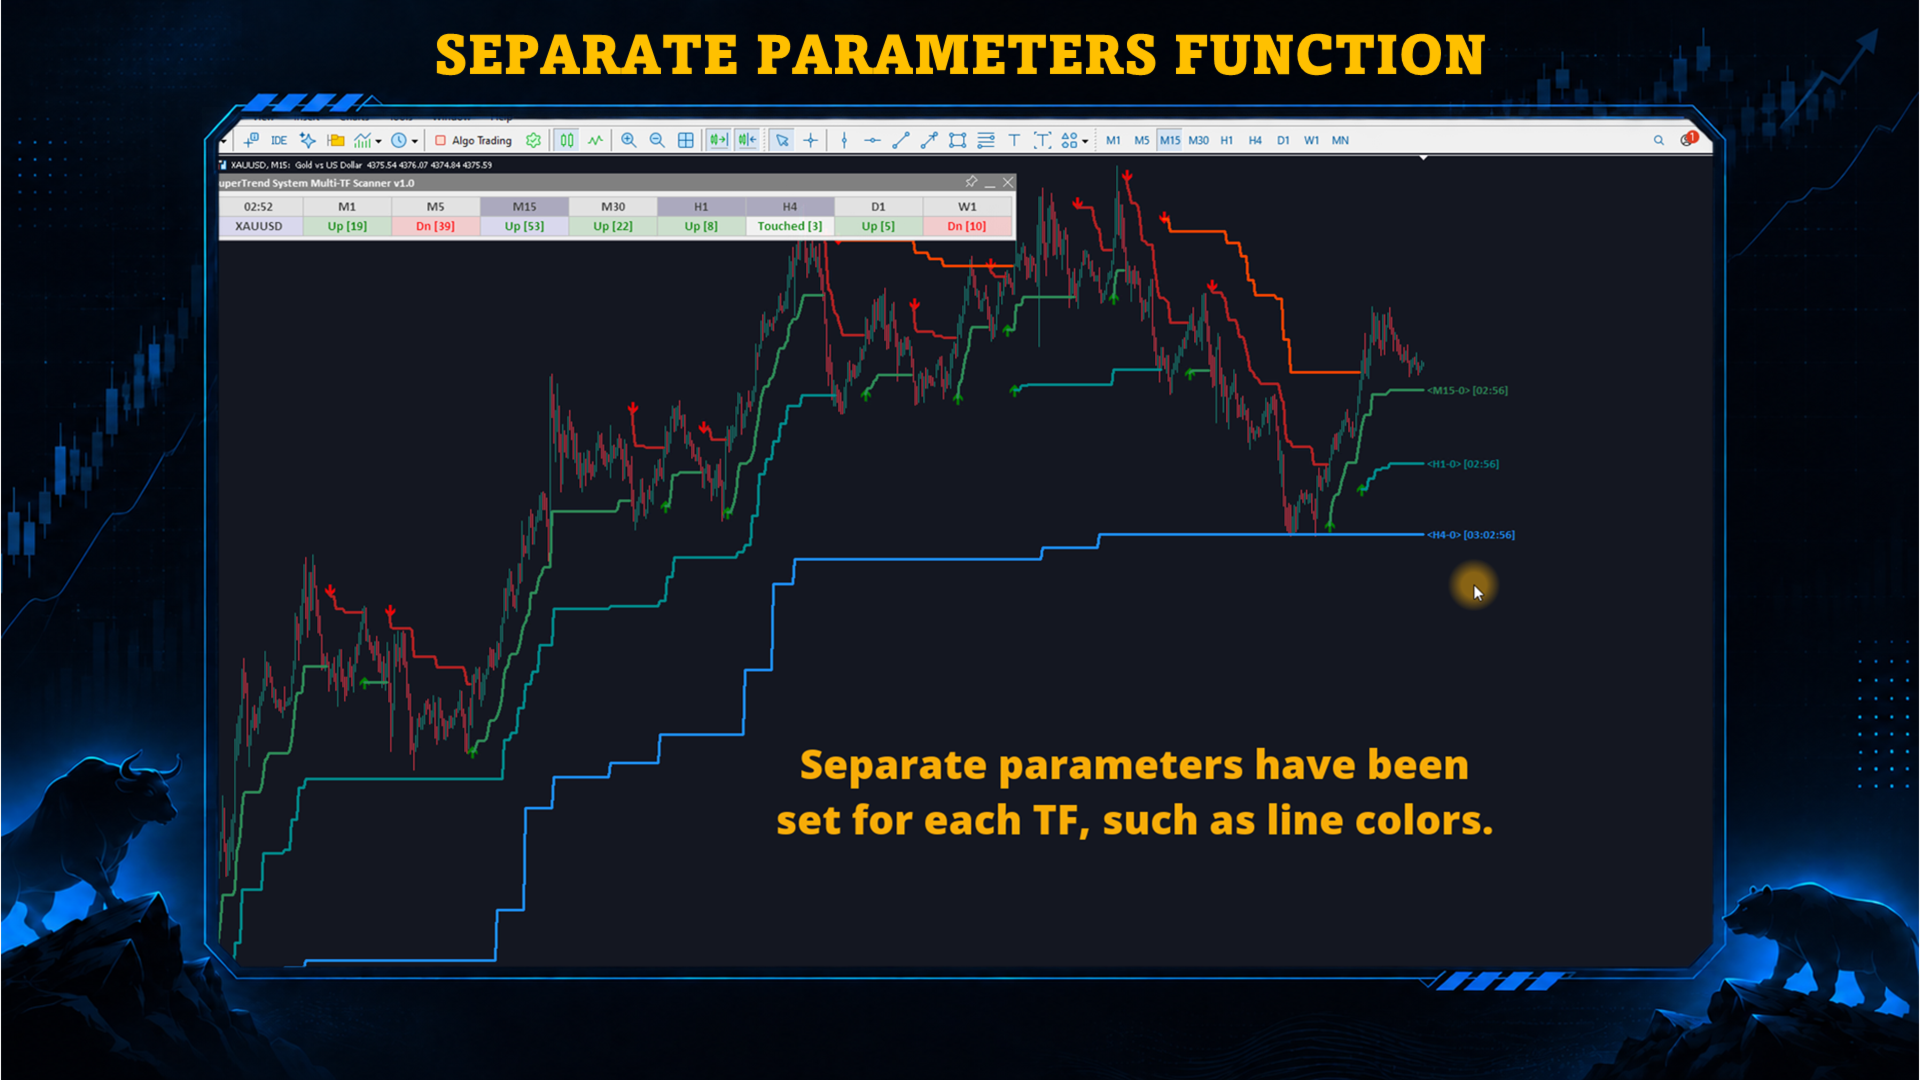
The indicator extends the same SuperTrend logic across multiple timeframes and multiple symbols. Multiple SuperTrend timeframes can be displayed on one chart, each timeframe can use its own parameter set when required, and the Scanner can monitor multiple symbols and timeframes from one dashboard.
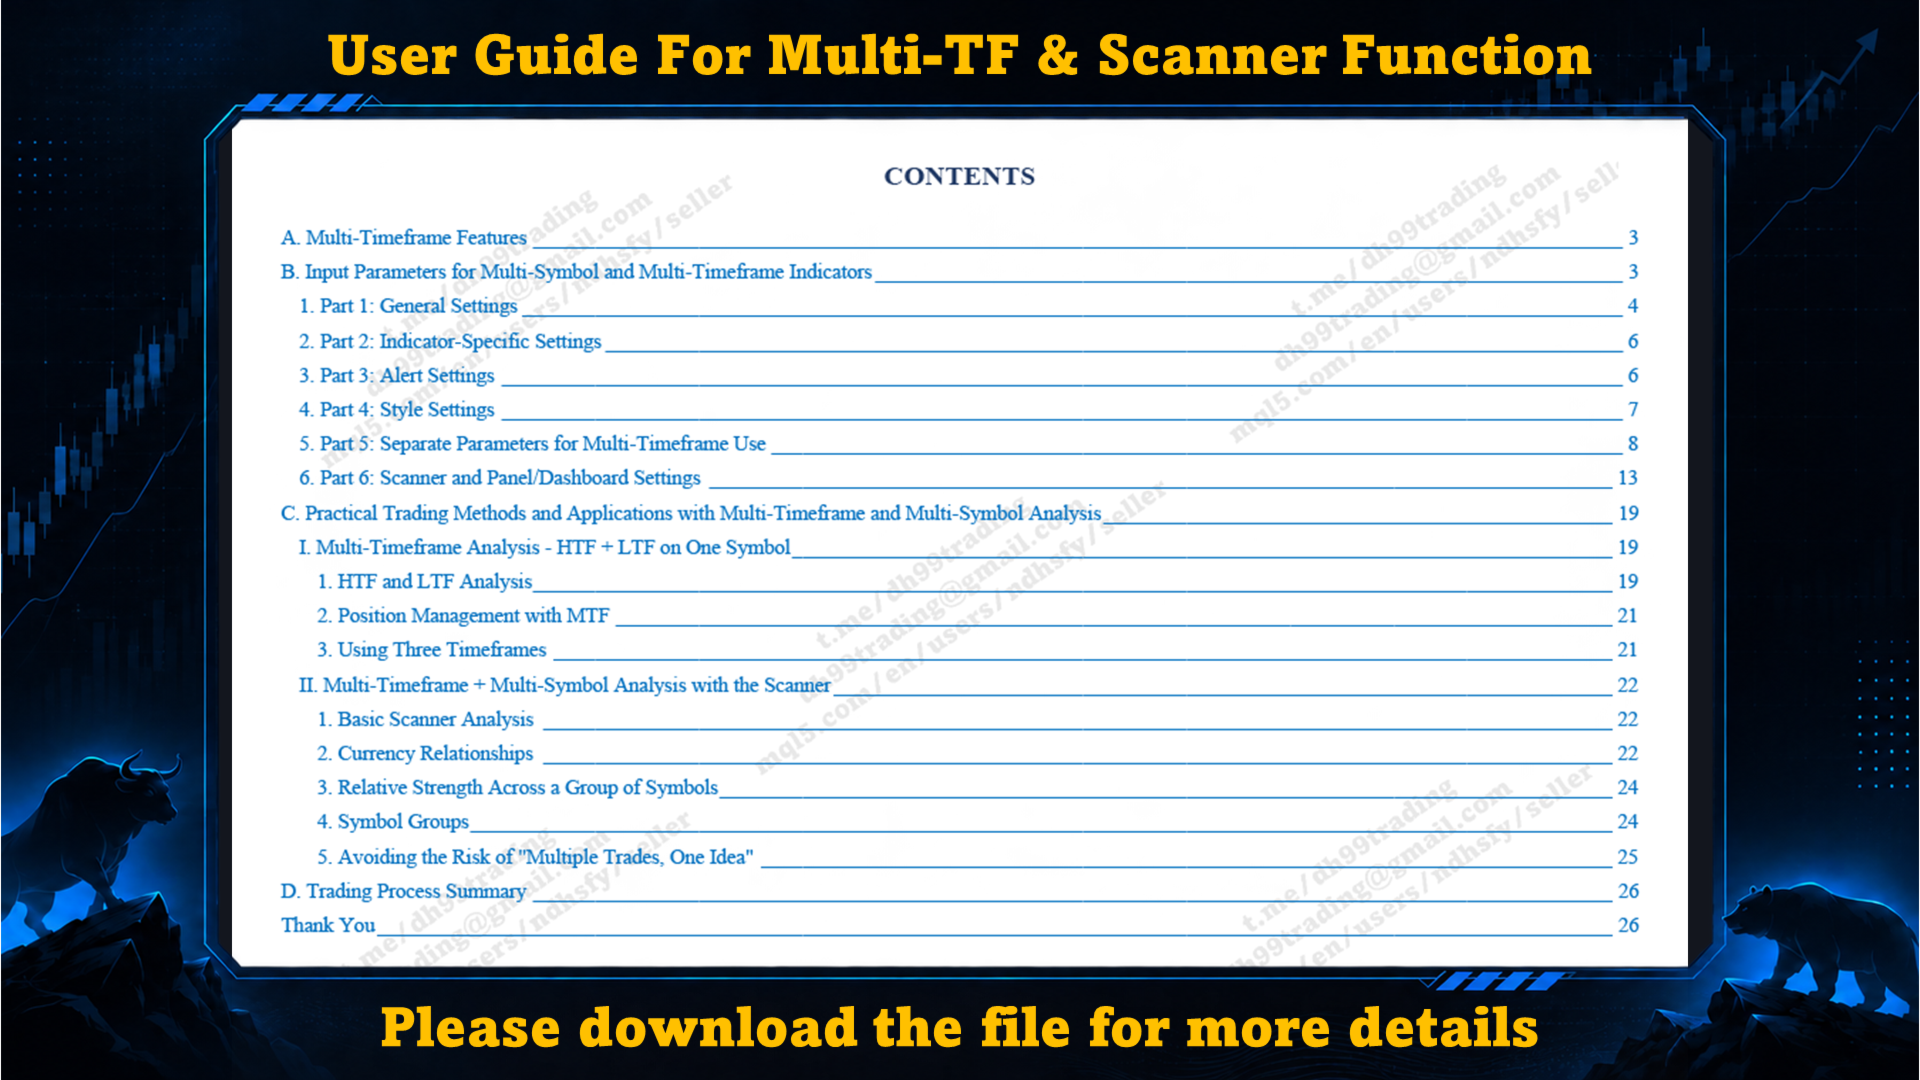
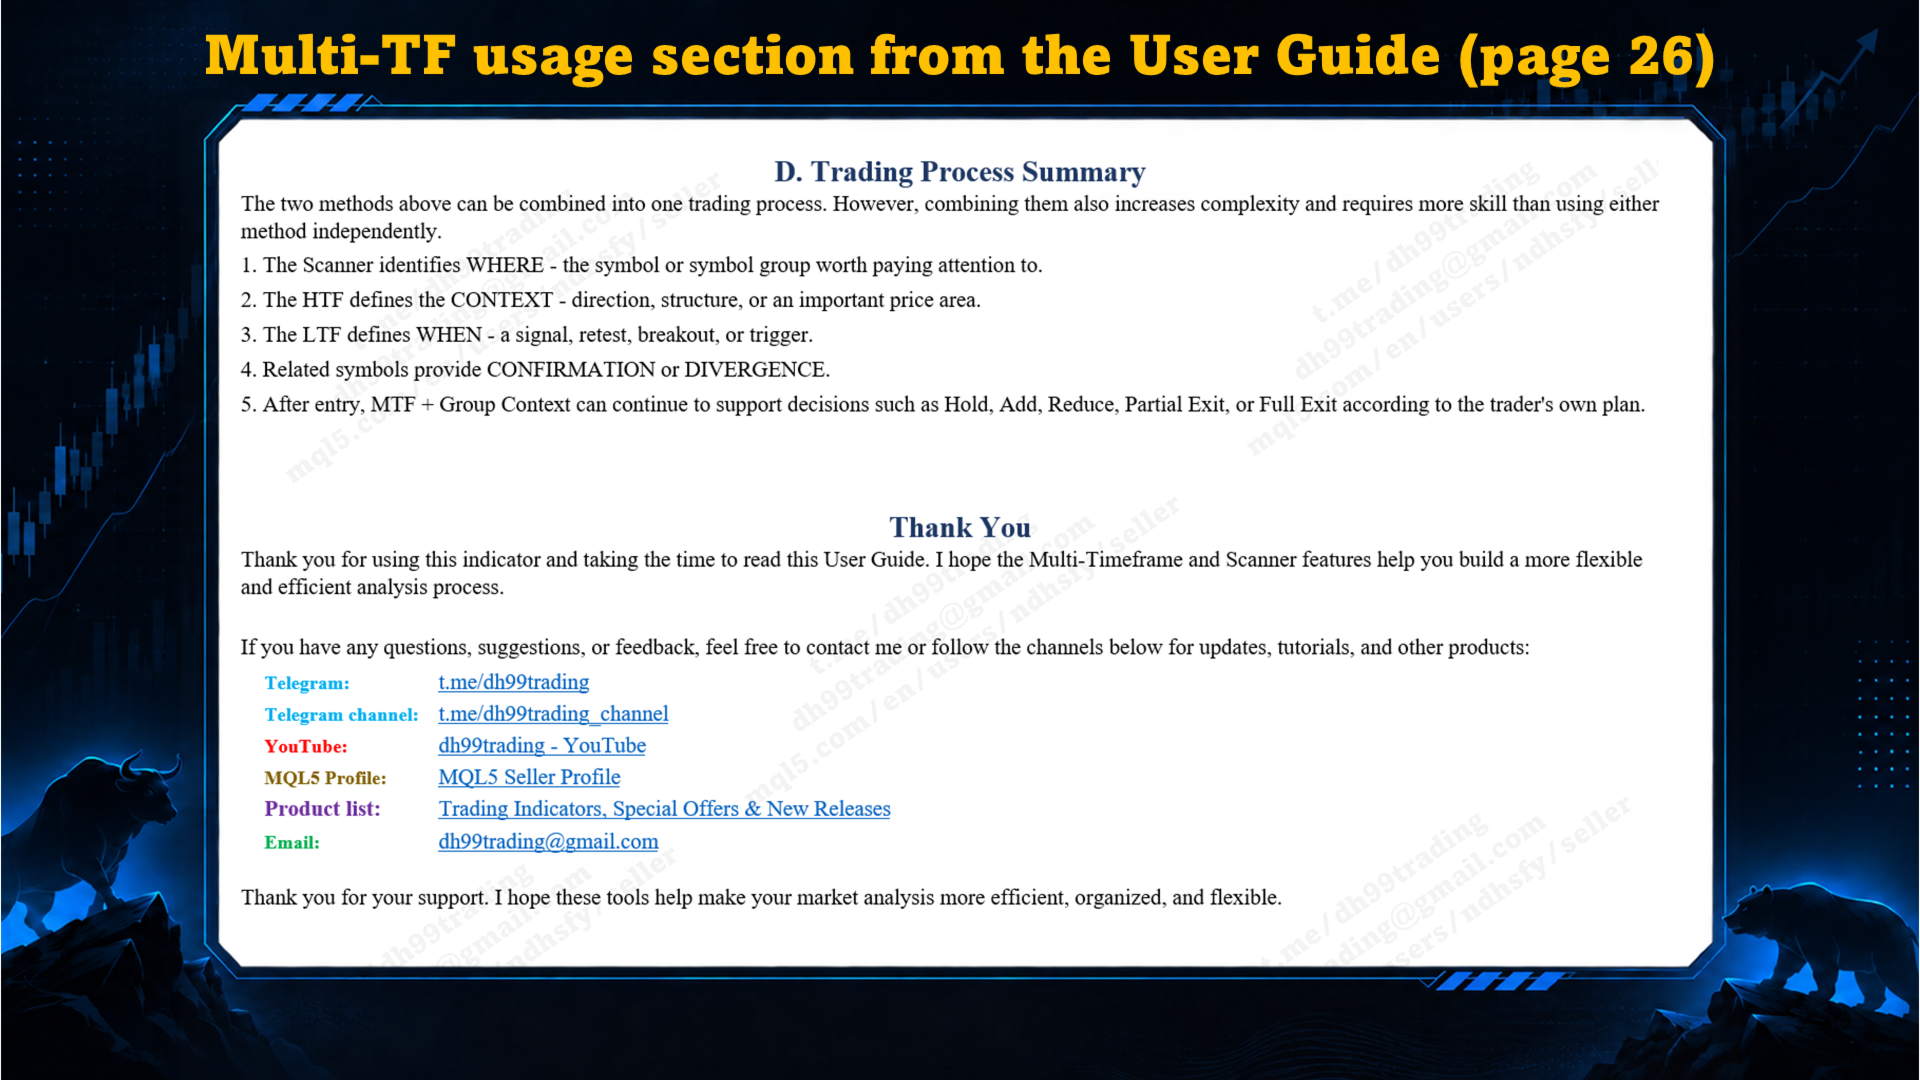
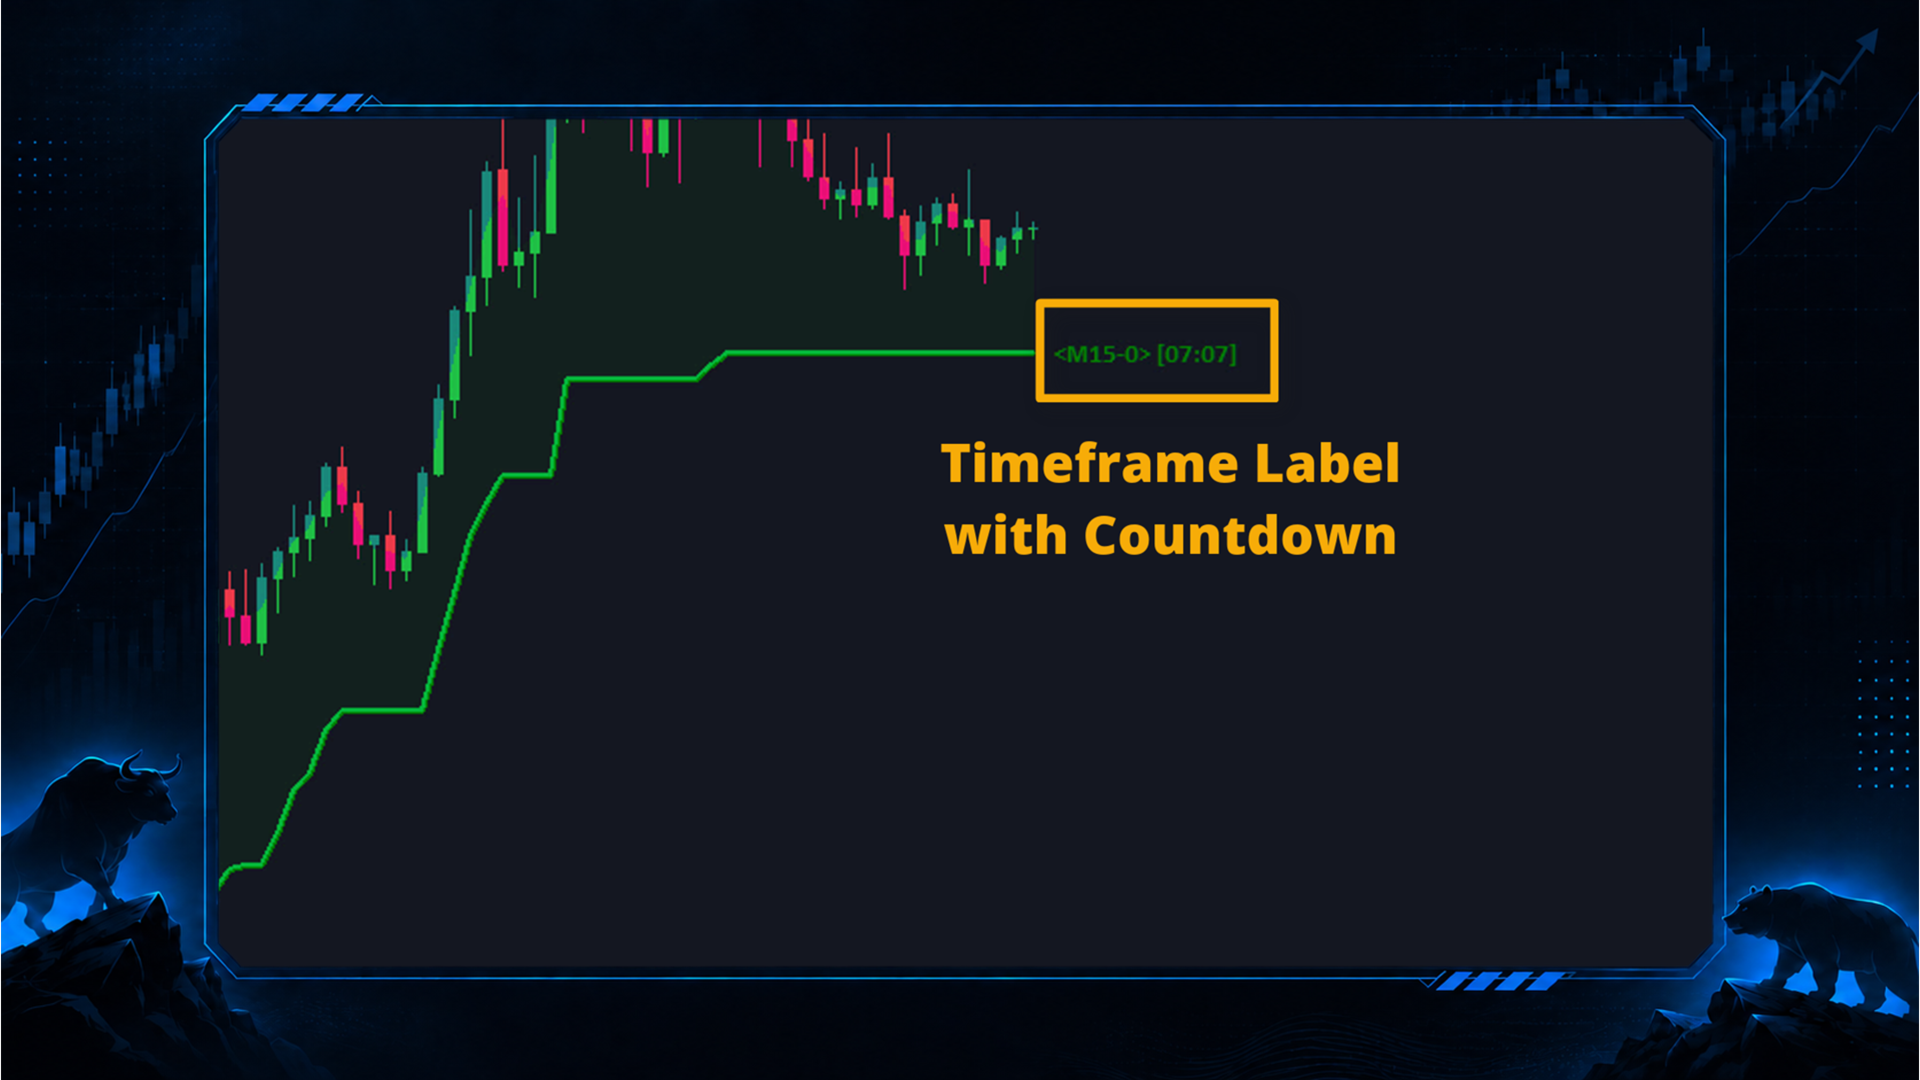
For detailed instructions about Multi-Timeframe display, Scanner, Separate Parameters, Timeframe Selector, Scanner Alerts, Hotkeys, Timeframe Labels and related controls, please use the Multi-Timeframe & Multi-Symbol Guide linked at the beginning of this page.
11. Main SuperTrend settings- ATR Period: controls the period used for the volatility calculation.
- Applied Price: selects the price source used by the SuperTrend calculation.
- ATR Multiplier: controls the distance and sensitivity of the SuperTrend structure.
- Trend Shift Confirmation Method: determines how a change in SuperTrend direction is confirmed. The default method is Close.
The main SuperTrend elements can be customized independently:
- Buy Arrow display, arrow code, color and width
- Sell Arrow display, arrow code, color and width
- Uptrend Line color, style and width
- Downtrend Line color, style and width
- Trend filling and transparency
- Bullish and Bearish SuperTrend detection
- Dynamic Uptrend and Downtrend Lines
- Bullish and Bearish Trend Shift detection
- Buy and Sell arrows at Trend Shifts
- Configurable Trend Shift confirmation
- Price Touch detection
- Trend Shift Alerts
- Uptrend / Downtrend Line Touch Alerts
- Adjustable ATR Period and Multiplier
- Custom Applied Price
- Customizable lines and signal arrows
- Optional trend filling
- Message, Push, Email and Sound Alerts
- Multi-Timeframe display
- Separate parameters for each timeframe
- Multi-Symbol & Multi-Timeframe Scanner
At its core, the indicator remains easy to understand:
Bullish → Uptrend Line
Bearish → Downtrend Line
Direction changes → Trend Shift Arrow
Price returns to the active line → Line Touch
From this foundation, SuperTrend can be used as a trend filter, for monitoring direction changes, for tracking pullbacks and retests, or as one component of a broader Multi-Timeframe trading approach.