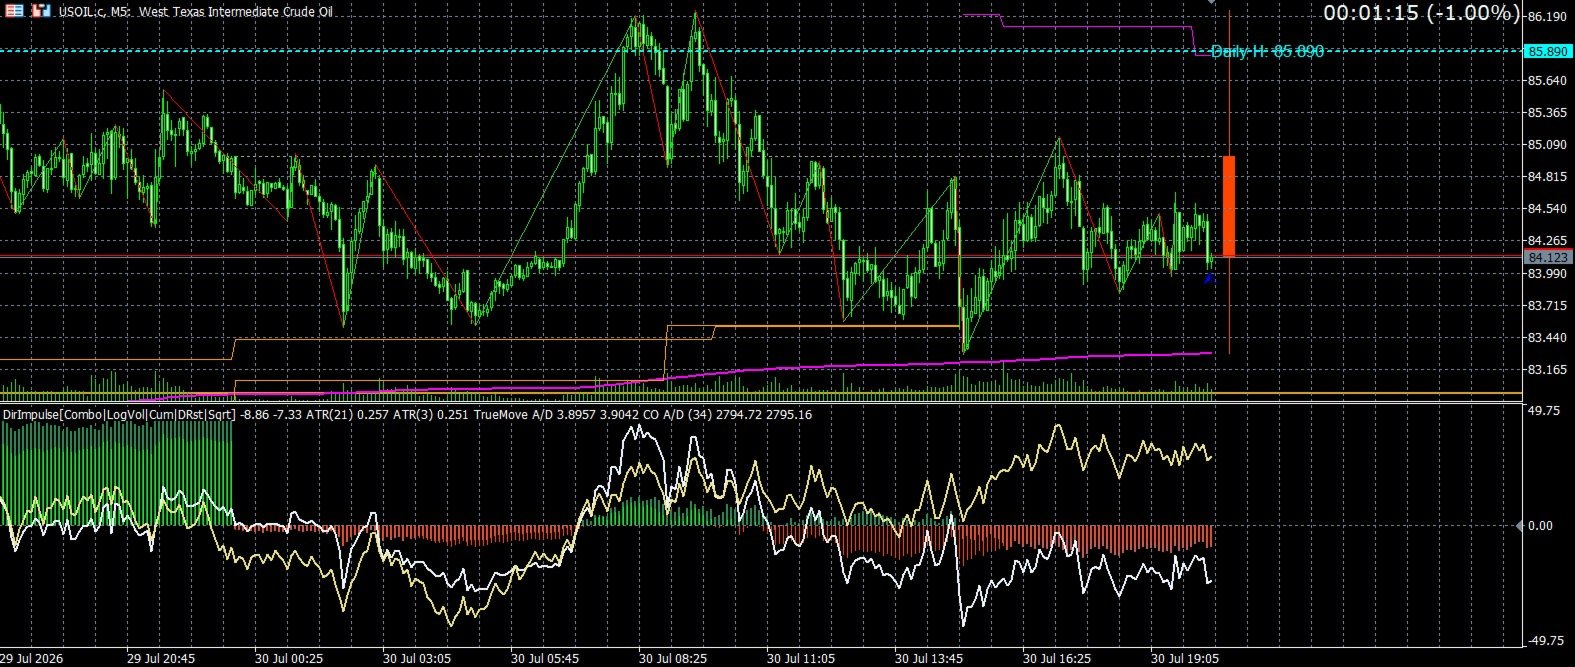
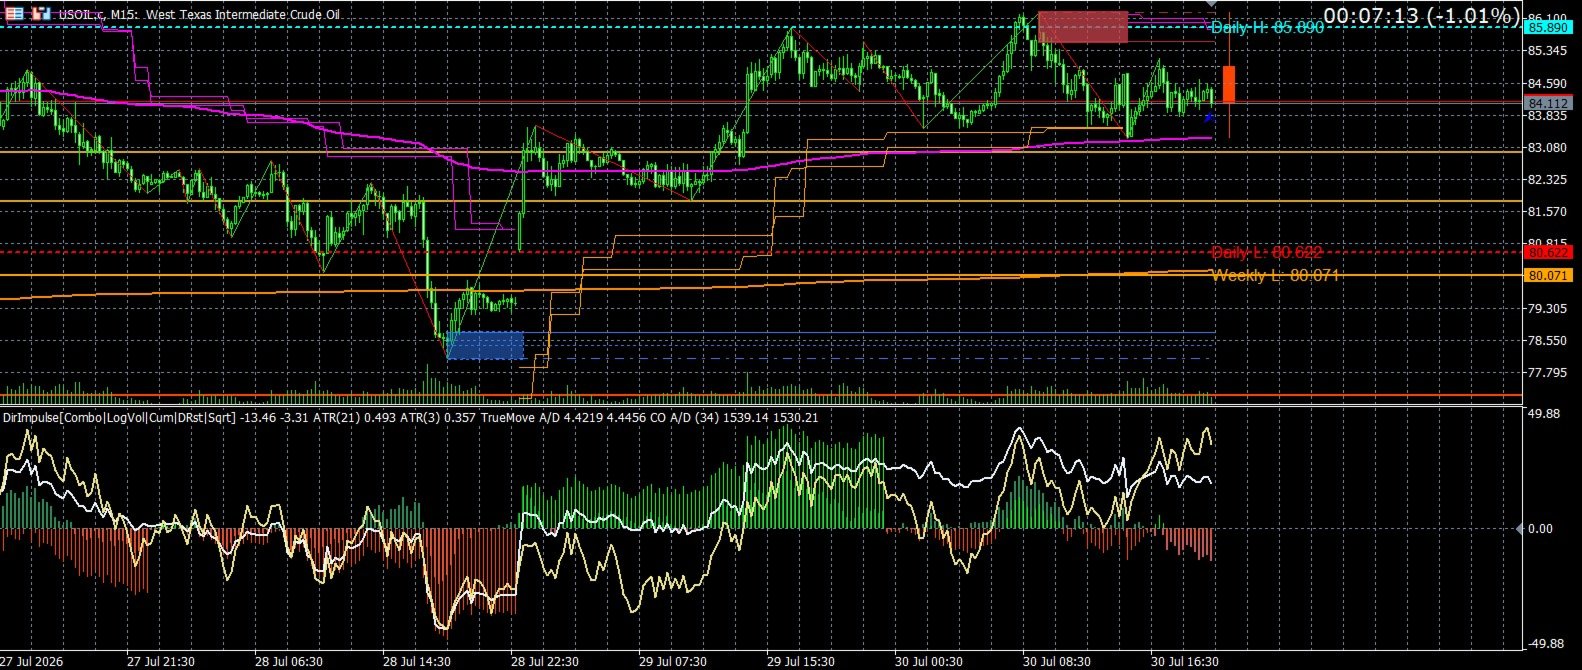
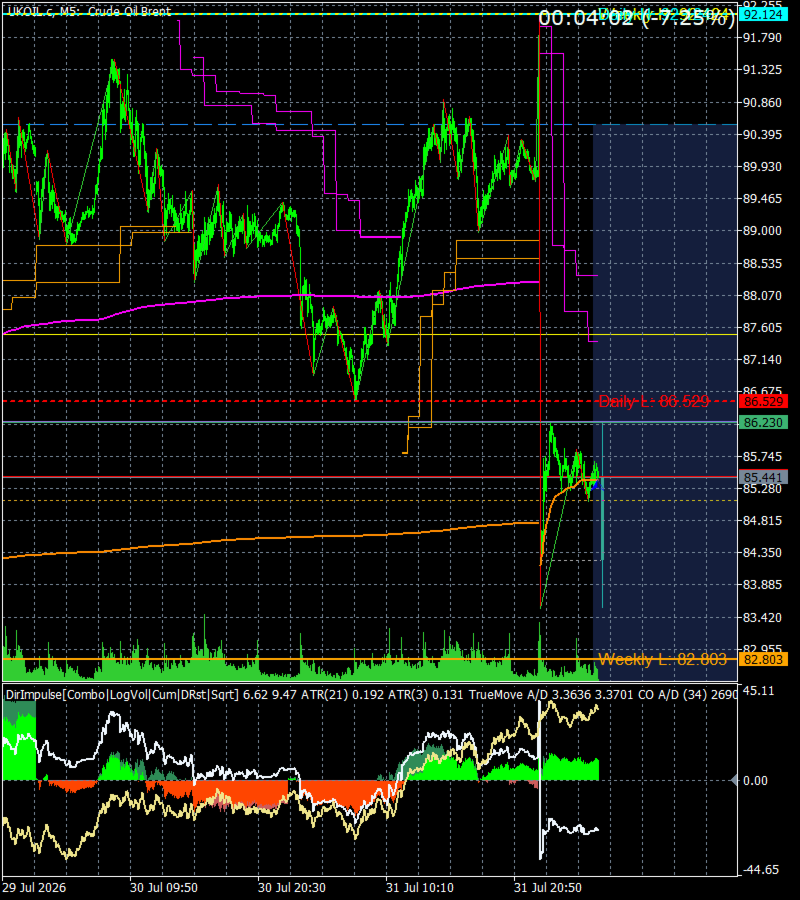
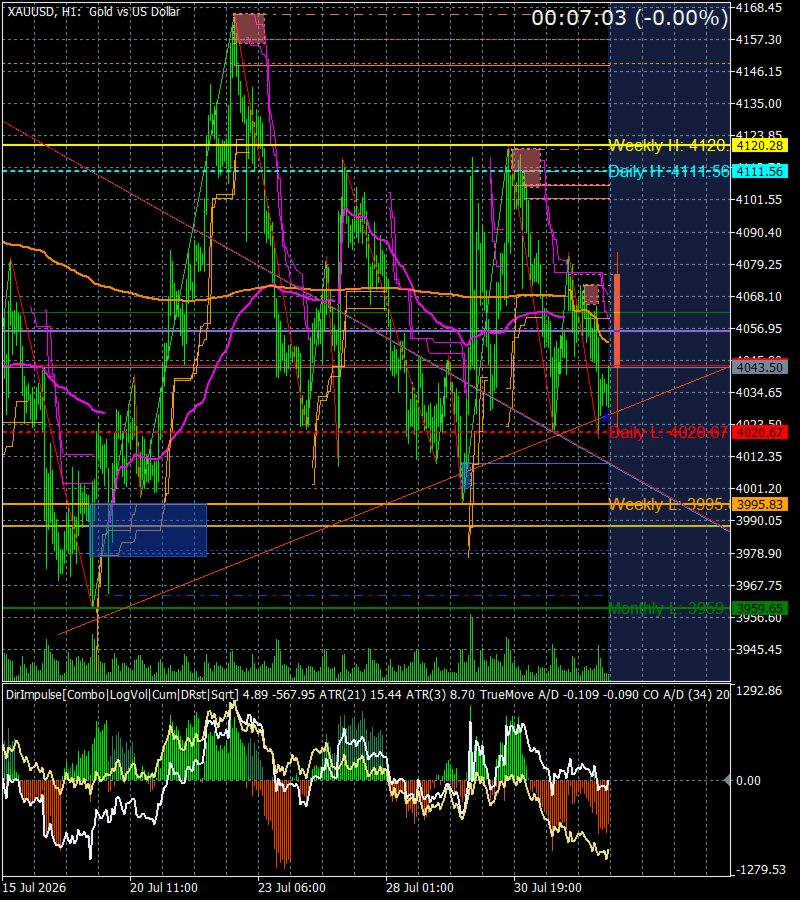
Close Open AD
- Indicators
- Version: 1.0

Close-Open A/D (CO A/D): A Cumulative Volume-Efficiency Line for Accumulation/Distribution Analysis
CO A/D is a cumulative Accumulation/Distribution-style indicator built around a simple question On-Balance Volume and Chaikin A/D don't directly ask: how efficiently did each bar convert its own volume into open-to-close travel?
Formula
CO_raw = (Close − Open) / (High − Low) Volume = Log(TickVolume + 1) [or raw volume — selectable] CO A/D = Previous CO A/D + (CO_raw × Volume)
Where OBV assigns full bar volume based only on close-to-close direction, and Chaikin's A/D anchors on the bar's midpoint, CO A/D anchors on the open — measuring how much of a bar's own range was captured directionally from open to close, then weighting that efficiency by volume and accumulating it into a running line.
How to use it
- Read CO A/D the way you'd read any cumulative A/D line: rising = distribution efficiency skewed to the buy side, falling = sell side. The slope matters more than the absolute value.
- Divergence: when CO A/D prints a new high/low that price (or a close-to-close flow indicator) doesn't confirm, that's worth attention — it often reflects strong bar-level efficiency without net price progress.
- Absorption read: a strong, sustained CO A/D trend against a flat close-to-close flow measure can indicate one side's aggressive volume being absorbed without displacing price.
What to expect
- A cumulative line with no fixed unit — trade its shape and its relationship to price structure, not its raw value.
- Two independent inputs: Volume Source (Tick / Real) and Volume Transform (Raw / Log) — toggle either without touching the formula.
Recommendation on Log Volume Tick volume is a count of price-change events, not a clean read of participation — it's skewed by feed granularity, thin-session micro-updates, and can shift overnight if a broker changes liquidity providers. Log(Vi + 1) is recommended as the default: it keeps volume's directional influence while preventing any single outlier bar from dominating the cumulative line, so persistent, moderate-volume pressure shows up more clearly. Raw volume is available for direct comparison, or when you specifically want extreme volume events to register at full weight.
Inputs
- Signal Line Period (default 34) and Method (SMA default / EMA)
- Volume Source: Tick / Real
- Volume Transform: Raw / Log(Vi+1)
- Signal line color defaults to None — enable it, or read both values side-by-side in the Data Window.
Notes Works on any timeframe and instrument. Pairs well with other cumulative flow indicators (e.g True Move AD ) for confluence — agreement across two independently-anchored cumulative lines carries more weight than either alone, and disagreement between them is itself informative. Not a standalone signal generator; intended as a confirmation/divergence layer within a broader trading framework.
ResearchGate publication: https://www.researchgate.net/publication/411174378_Close-Open_AD_A_Volume-Efficiency_Companion_to_True_Move_AD_and_Directional_Impulse
If you like this work, please feel free to leave a positive review and rating.