Trend Fair Value Gap Delta MT4 Multi TF Scanner
- Indicators
-
Duc Hoan Nguyen
 I develop practical trading tools for MetaTrader 4/5, with a focus on indicator integration, Multi-Timeframe analysis, market scanning, and automated trading solutions.
My work mainly includes:
• Indicator-to-EA Solutions - Version: 1.0
- Activations: 10
See more MT5 version at: Trend Fair Value Gap Delta Multi TF Scanner for MT5
See more MT4 version at: Trend Fair Value Gap Delta Multi TF Scanner for MT4
See more products at: All Products or Trading Indicators, Special Offers & New Releases
New tools will be $30 for the first week or the first 3 purchases!
Trading Tools Channel on MQL5: Join my MQL5 channel to get my latest news
When monitoring a price zone, you need to know the current trend, which zones still deserve attention, and how price has reacted on its return. Connecting these three layers of information gives chart observation a clear sequence, from identifying the context to assessing a signal.
Learn more: Logic and usage guide for Trend Fair Value Gap Delta Multi TF Scanner
Trend Fair Value Gap Delta Multi TF Scanner
Trend Fair Value Gap Delta Multi TF Scanner combines MA- and ATR-based trend analysis, Fair Value Gap (FVG), Buy/Sell reaction signals, and estimated Buy/Sell Volume percentages directly on the chart. You can observe market direction, identify price zones to monitor, and recognize reactions when price returns to a zone that remains active.
With Scanner and Multi-TF, the indicator supports monitoring multiple symbols and timeframes, helping you select charts that deserve a closer look and place signals in the appropriate context.
Read the trend and FVG zones on the same chart
The MA provides the reference basis, while ATR determines the distance of the two bands according to price volatility. The Uptrend or Downtrend line shows the trend state being maintained; Bullish/Bearish dots mark changes in direction. This helps you distinguish a trend change from a price reaction at an FVG zone.
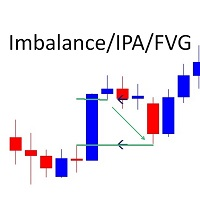
FVG zones are identified from the gap between the price ranges of the first and last candles in a three-candle structure. Filters let you select zones by trend direction and minimum width, while an active-age limit controls how long they are monitored.
A zone stops being considered for signals when price penetrates its terminating boundary, it is locked by a band, or it exceeds the applicable maximum age. Historical drawings may remain on the chart, so consider the zone's state when assessing what to monitor next.
Identify Buy/Sell reactions after price touches a zone
Buy appears when price has touched an eligible Bullish FVG without penetrating its bottom, then exits above its top. Sell works symmetrically: price touches a Bearish FVG without penetrating its top, then exits below its bottom. On closed candles, the exit condition is evaluated using the closing price; on the current candle, the indicator uses the current price.
A newly formed FVG is not yet a Buy/Sell signal. The indicator only considers reactions after the candle that creates the zone and applies the minimum-age filter when enabled. Each touch–exit cycle generates a signal only on its first exit; another candle must close back inside the zone, including on a boundary, to prepare it for the next cycle.
Buy/Sell Volume: additional information for reading price zones
Buy/Sell Volume percentages inside an FVG are estimated from the closing position within the middle candle's range when the structure forms. They help you read that candle's relative distribution, adding information when observing the zone and price reactions.
This is an estimated distribution derived from candle data, rather than direct statistics of trades executed at Bid/Ask or volume accumulated across touches of the zone. A dominant Buy or Sell percentage does not create a signal by itself; Buy/Sell conditions still depend on price reactions and the zone's state.
Scanner and Multi-TF extend your monitoring coverage
Scanner collects information for selected symbols and timeframes in a shared panel. When you spot a case worth attention, you can focus on its chart to check the trend, signal type, and relevant FVG zone.
Multi-TF lets you consult information from other timeframes. You can use one timeframe to read the context and another to observe reactions at an FVG. Each timeframe reflects its own context, so their directions may differ or their signals may appear at different times.
You can select your symbol watchlist and timeframe list and use separate settings for each timeframe. See the Multi-Timeframe and Scanner User Guide to configure the common functions.
Customize display and alerts to suit your needs
- Trend basis: adjust the MA, ATR, and band multiplier to change how the indicator reflects volatility.
- FVG management: select the direction filter, minimum width, maximum active age, and minimum age for Buy/Sell evaluation.
- Display: choose the trend lines, bands, FVG zones, Buy/Sell arrows, and direction-change dots that suit your way of observing the chart.
- 12 alert types: cover both bullish/bearish directions of six event groups: Buy/Sell, trend changes, new FVGs, first touches, mitigated zones, and zones locked by a band.
New FVG alerts use closed candles; the other groups monitor the current candle. The master alert switches for the current symbol and Scanner are off by default, so enable the event types and monitoring scope for which you want notifications.
Basic usage
- Read the context: check the active Uptrend/Downtrend line and the most recent direction-change dot.
- Select zones to watch: identify Bullish/Bearish FVGs, their position relative to price, and their active state; distinguish zones still eligible for signals from historical drawings.
- Monitor reactions: observe price touching and then exiting a zone, and read Buy/Sell arrows alongside estimated volume percentages. Distinguish reaction signals from new-zone or first-touch events.
- Combine Scanner and Multi-TF: use Scanner to narrow down what to watch, then inspect the chart and consult other timeframes for more context.
- Set up alerts: select events suited to your monitoring process and return to the chart when a notification arrives.
Note when reading the current candle: Buy/Sell signals, direction-change dots, and temporary FVGs can change as price continues to fluctuate. Distinguish this developing information from information on closed candles.