Smart Volume Profile MT5
- Indicators
- Sathit Sukhirun
- Version: 1.10
- Updated: 30 November 2025
- Activations: 20
English
-
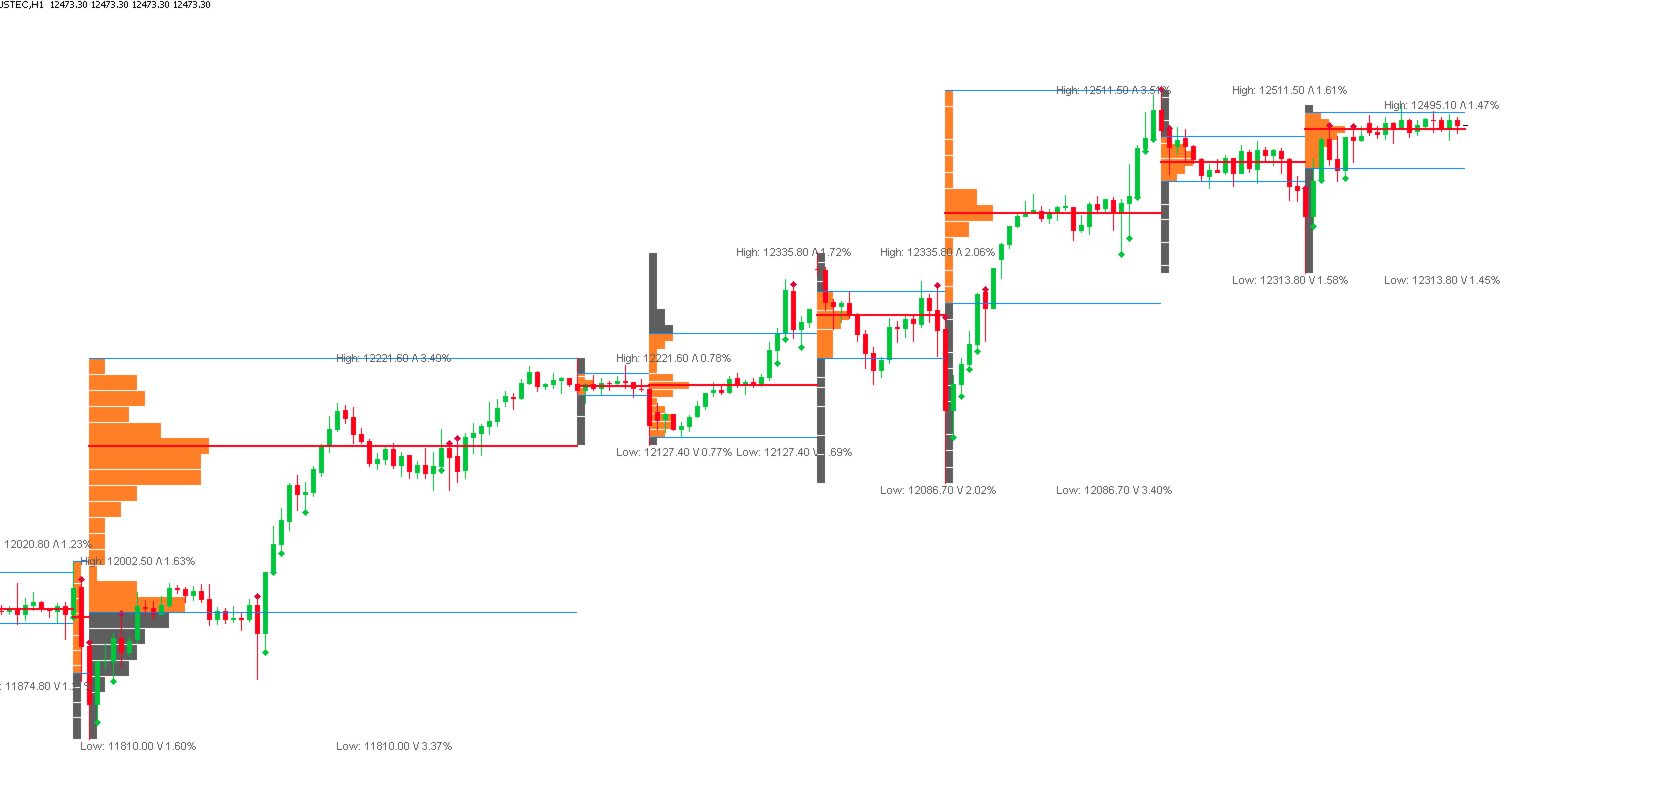
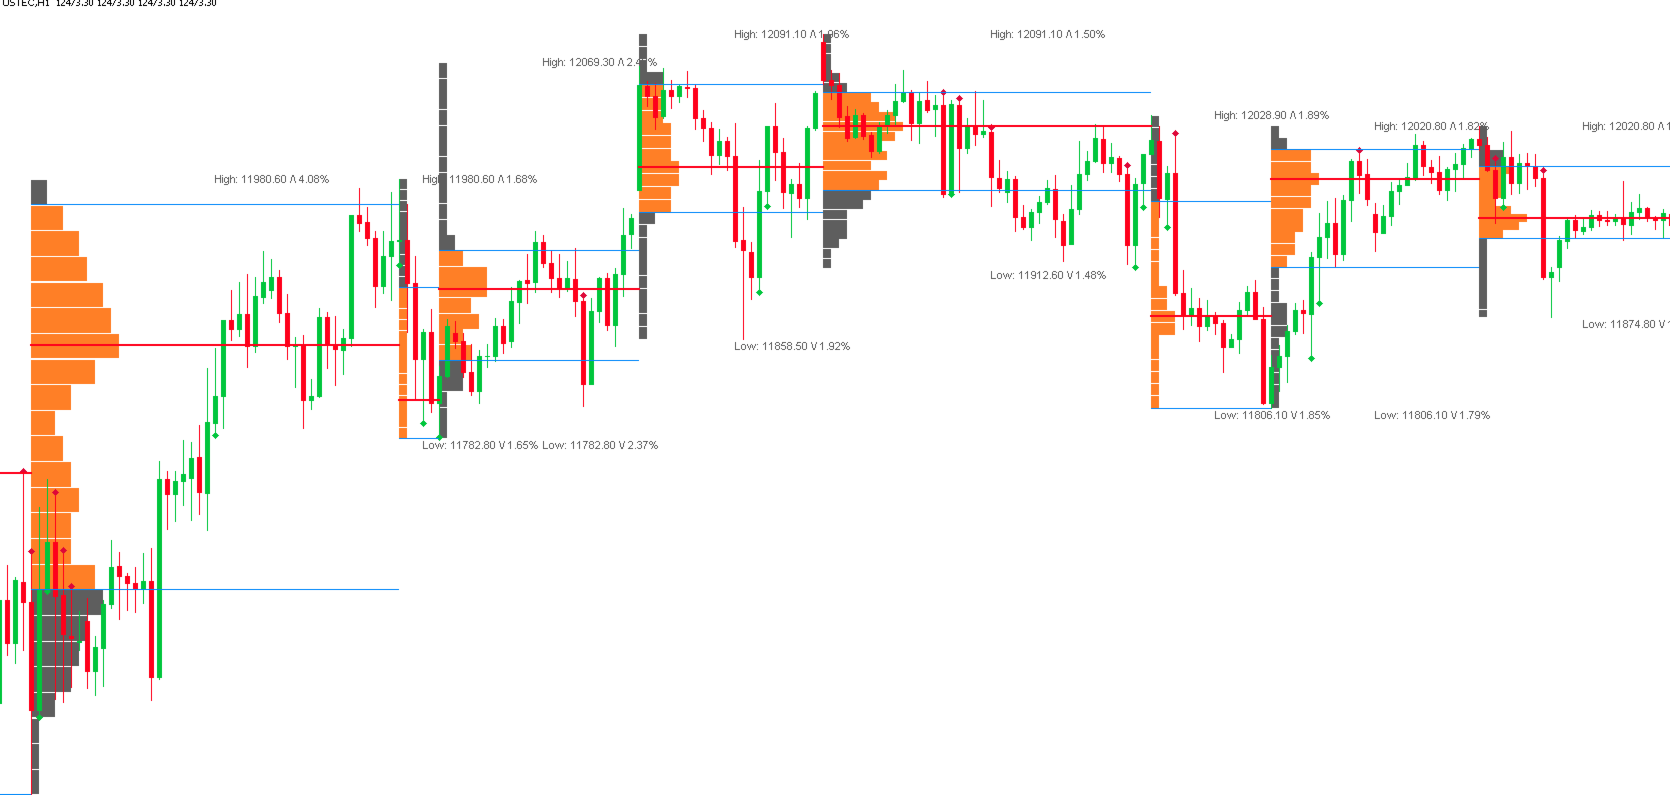
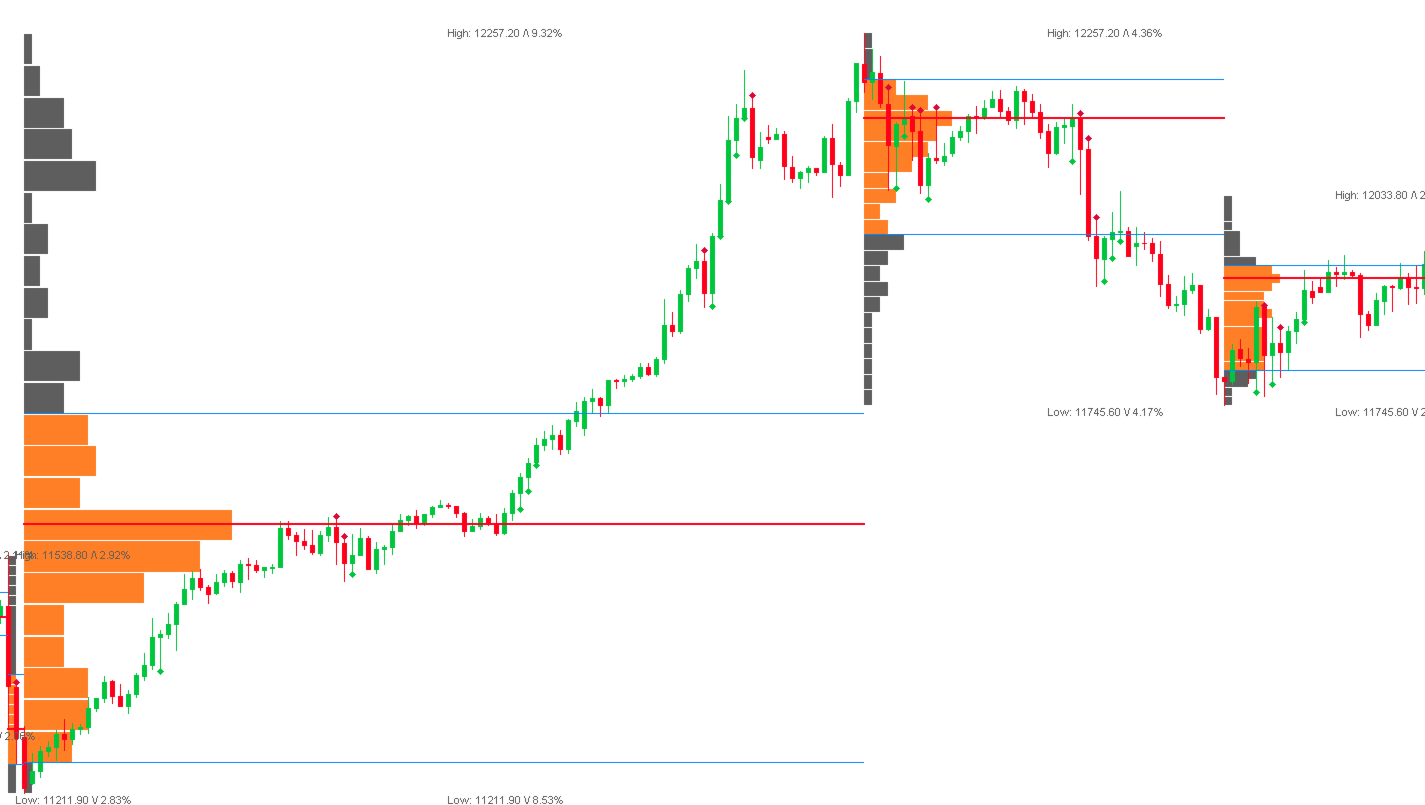
Scan for "Smart Money" (Volume Markers): Arrows indicate abnormal volume (higher than average) with clear green/red color coding. This helps identify "Smart Money" entries and filter out fake signals.
-
Critical Alerts: No need to stare at the screen. The system notifies you immediately when the price crosses the POC (Point of Control), which is often a decisive point for trend continuation or reversal.
-
Instant Market Structure (Developing Profile): Displays the profile of the current forming price cycle. This allows you to see if the price is breaking out of an accumulation zone or being pulled back to the average.