Professional Support Resistance

🥇 Professional Gold Trading Levels Indicator

✨ Features:
- Daily & Weekly Pivot Points
- Fibonacci Retracement Levels  
- Round Number Levels
- Customizable Colors & Fonts
- Auto-Update Daily
- Clean & Simple Interface

📊 Perfect for Gold (XAUUSD) traders
🎯 Reliable Support/Resistance levels
⚡ Lightweight & Fast Performance
🔧 Easy to install and use

Compatible with all MT5 accounts.

No complex settings required!

SimpleGoldLevels v1.0 - User Manual

Professional Support & Resistance Levels for Gold Trading

📋 Table of Contents

  1. Overview
  2. Installation Guide
  3. Features
  4. Configuration Settings
  5. Understanding the Levels
  6. Trading Tips
  7. Troubleshooting
  8. FAQ
  9. Support

🎯 Overview

SimpleGoldLevels is a professional MetaTrader 5 indicator specifically designed for Gold (XAUUSD) trading. It automatically calculates and displays key support and resistance levels on your chart, helping you identify high-probability trading opportunities.

Key Benefits:

  • ✅ Automatic Calculation - No manual work required
  • ✅ Multiple Level Types - Pivots, Fibonacci, Round Numbers
  • ✅ Daily Updates - Fresh levels every trading day
  • ✅ Customizable - Colors, fonts, and visibility options
  • ✅ Lightweight - Minimal system resources
  • ✅ Reliable - Works on all MT5 accounts

🛠️ Installation Guide

Step 1: Download & Extract

  1. Download the SimpleGoldLevels.mq5 file
  2. Extract to your computer if compressed

Step 2: Copy to MetaTrader 5

  1. Open MetaTrader 5
  2. Press Ctrl + Shift + D to open Data Folder
  3. Navigate to MQL5 → Indicators folder
  4. Copy SimpleGoldLevels.mq5 into this folder

Step 3: Compile (If Needed)

  1. Press F4 to open MetaEditor
  2. Navigate to the indicator file
  3. Press F7 to compile
  4. Close MetaEditor

Step 4: Apply to Chart

  1. Open a Gold (XAUUSD) chart
  2. Press Ctrl + I to open Navigator
  3. Expand "Indicators" → "Custom"
  4. Double-click "SimpleGoldLevels"
  5. Configure settings (see below)
  6. Click "OK"

⚡ Features

📊 Level Types

Level Type Description Update Frequency
Daily Pivots Support/Resistance based on yesterday's OHLC Daily
Weekly Pivots Support/Resistance based on last week's OHLC Weekly
Fibonacci Retracement levels (23.6%, 38.2%, 50%, 61.8%, 78.6%) Daily
Round Numbers Psychological levels (multiples of 10) Real-time

🎨 Visual Features

  • Color-coded levels for easy identification
  • Price labels showing exact values
  • Customizable line styles and widths
  • Clean interface that doesn't clutter your chart

⚙️ Configuration Settings

Basic Settings

┌─ BASIC SETTINGS ─────────────────┐ │ ☑ Show daily pivots │ │ ☑ Show weekly pivots │ │ ☑ Show Fibonacci levels │ │ ☑ Show round number levels │ └──────────────────────────────────┘

Recommendation: Keep all enabled for complete analysis

Visual Settings

    ┌─ VISUAL SETTINGS ────────────────┐
│ Support color:     DodgerBlue    │
│ Resistance color:  Crimson       │
│ Pivot color:       Gold          │
│ Fibonacci color:   MediumOrchid  │
│ Round color:       Silver        │
└──────────────────────────────────┘

Tip: Use contrasting colors for better visibility

Line Settings

┌─ LINE SETTINGS ──────────────────┐ │ Line width: 1-3 │ │ Line style: Solid/Dash │ │ ☑ Show labels │ │ Font size: 12-16 │ └──────────────────────────────────┘

Recommendation: Font size 12-14 for optimal readability

Debug Settings

    ┌─ DEBUG ──────────────────────────┐
│ ☐ Show debug messages            │
└──────────────────────────────────┘

Note: Enable only for troubleshooting

📈 Understanding the Levels

Daily Pivot Points

Calculation Formula:

Pivot = (High + Low + Close) / 3 R1 = 2 × Pivot - Low S1 = 2 × Pivot - High R2 = Pivot + (High - Low) S2 = Pivot - (High - Low) R3 = High + 2 × (Pivot - Low) S3 = Low - 2 × (High - Pivot)

Usage:

  • Pivot Line: Central reference point
  • R1, R2, R3: Resistance levels (sell zones)
  • S1, S2, S3: Support levels (buy zones)

Weekly Pivot Points

Similar to daily pivots but based on weekly OHLC data:

  • More significant levels
  • Hold for longer periods
  • Ideal for swing trading

Fibonacci Levels

Based on the previous day's high-low range:

  • 23.6% - Minor retracement
  • 38.2% - Shallow retracement
  • 50.0% - Middle retracement
  • 61.8% - Deep retracement (Golden Ratio)
  • 78.6% - Very deep retracement

Round Numbers

Psychological levels at multiples of 10:

  • Example: 2650, 2660, 2670, etc.
  • Often act as support/resistance
  • Important for market psychology

💡 Trading Tips

🎯 Entry Strategies

1. Bounce Strategy

    📊 Setup: Price approaches support level
🔍 Signal: Bullish candlestick pattern
📈 Entry: Buy above signal candle
🛡️ Stop: Below support level
🎯 Target: Next resistance level

2. Breakout Strategy

📊 Setup: Price near resistance/support 🔍 Signal: Strong breakout with volume 📈 Entry: On retest of broken level 🛡️ Stop: Back inside broken level 🎯 Target: Next major level

3. Pivot Reversal

    📊 Setup: Price reaches R2/R3 or S2/S3
🔍 Signal: Reversal candlestick pattern
📈 Entry: Opposite direction
🛡️ Stop: Beyond the pivot level
🎯 Target: Return to pivot or beyond

⚠️ Risk Management

Risk Level Position Size Stop Loss
Conservative 1-2% per trade 10-15 pips
Moderate 2-3% per trade 15-25 pips
Aggressive 3-5% per trade 25-40 pips

📅 Best Trading Sessions

Session Time (GMT) Volatility Best Levels
London 08:00-17:00 High Daily Pivots
NY 13:00-22:00 Highest All Levels
Asian 23:00-08:00 Low Weekly Pivots

🔧 Troubleshooting

Common Issues

❌ Levels Not Showing

Possible Causes:

  • Indicator not properly installed
  • Wrong chart symbol (not Gold)
  • All levels disabled in settings

Solutions:

  1. Reinstall the indicator
  2. Apply only to XAUUSD charts
  3. Check Basic Settings - enable at least one level type

❌ Labels Too Small/Large

Solution:

  1. Right-click chart → "Indicators List"
  2. Double-click "SimpleGoldLevels"
  3. Adjust "Font size" in Line Settings
  4. Recommended: 12-16

❌ Wrong Colors

Solution:

  1. Open indicator settings
  2. Go to "Visual Settings"
  3. Choose contrasting colors
  4. Test different combinations

❌ Too Many Lines

Solution:

  1. Disable some level types in Basic Settings
  2. Start with only Daily Pivots
  3. Add other levels gradually

Performance Issues

Slow Chart Loading

  • Cause: Too many objects on chart
  • Solution: Reduce number of active levels

Memory Usage

  • Cause: Debug mode enabled
  • Solution: Disable "Show debug messages"

❓ FAQ

Q: Does this work on other instruments?

A: Optimized for Gold (XAUUSD) but can work on other forex pairs and metals. Results may vary.

Q: How often do levels update?

A:

  • Daily/Weekly Pivots: Once per day/week
  • Fibonacci: Daily with high/low range
  • Round Numbers: Real-time as price moves

Q: Can I use this with EAs?

A: Yes, but you'll need to modify the EA to read the indicator's objects.

Q: What timeframes work best?

A: All timeframes work, but M15, H1, and H4 are most effective for day trading.

Q: Is this compatible with other indicators?

A: Yes, designed to work alongside other technical indicators.

Q: Can I modify the source code?

A: Yes, the source code is included for customization.

📞 Support

Getting Help

Before contacting support, please:

  1. Check this manual thoroughly
  2. Verify your MT5 version (build 3815+)
  3. Test on a demo account first
  4. Have your error messages ready

Contact Information

📧 Email: support@simplegold.pro
🌐 Website: https://simplegold.pro
💬 Telegram: @SimpleGoldSupport
⏰ Support Hours: Monday-Friday, 9 AM - 6 PM GMT

Additional Resources

📚 Video Tutorials: [YouTube Channel]
📖 Trading Guide: [Free PDF Download]
👥 Community: [Discord Server]
📊 Live Signals: [Telegram Channel]

📜 Version History

v1.0 (Current)

  • ✅ Initial release
  • ✅ Daily & Weekly pivots
  • ✅ Fibonacci levels
  • ✅ Round numbers
  • ✅ Customizable colors
  • ✅ Auto-update functionality

Planned Updates

  • 🔄 v1.1: Monthly pivots
  • 🔄 v1.2: Alerts system
  • 🔄 v1.3: Multi-timeframe display
  • 🔄 v1.4: Level strength indicator

⚖️ Disclaimer

Risk Warning: Trading gold and forex involves substantial risk and may not be suitable for all investors. Past performance does not guarantee future results. This indicator is a tool to assist in analysis and should not be the sole basis for trading decisions.

No Guarantee: While SimpleGoldLevels uses proven mathematical formulas, no trading system can guarantee profits. Always use proper risk management and never risk more than you can afford to lose.

📝 License

Copyright 2025 SimpleGold Team
Licensed for personal and commercial use.
Redistribution prohibited without permission.

Thank you for choosing SimpleGoldLevels! Trade smart, trade safe.

Document Version: 1.0
Last Updated: January 2025
Compatible with: MetaTrader 5 Build 3815+


Recommended products
PZ Penta O MT5
PZ TRADING SLU
3.8 (5)
The Penta-O is a 6-point retracement harmonacci pattern which usually precedes big market movements. Penta-O patterns can expand and repaint quite a bit. To make things easier this indicator implements a twist: it waits for a donchian breakout in the right direction before signaling the trade. The end result is an otherwise repainting indicator with a very reliable trading signal. The donchian breakout period is entered as an input. [ Installation Guide | Update Guide | Troubleshooting | FAQ | A
FREE
PROMETHEUS TECHNICAN VERSION Free | By THE SONS A gift from The Sons — no strings, no trial, no expiry. Every trader deserves access to professional-grade market intelligence. That belief is why Prometheus Technical Version exists, and why it costs nothing. Consider it our handshake to the trading community. What You're Getting This is not a simplified tool dressed up as a gift. Prometheus Technican Version is a fully built, institutional-quality technical analysis indicator running a dual-model
FREE
JT360 DNA Mini PnL Pointer V1.04 Public Компактно. Наглядно. Всегда перед глазами. JT360 DNA Mini PnL Pointer — это лёгкий индикатор для MetaTrader 5, который отображает суммарную текущую прибыль или убыток по всем открытым позициям текущего символа графика. Компактная индикация непосредственно на графике объединяет PnL относительно первоначального риска в формате R, тонкую мини-полоску и настраиваемую цветовую матрицу. Фирменные цвета JT360 — бирюзовый и пурпурный — выделяют крайние значения и
FREE
Value Chart Candlesticks
Flavio Javier Jarabeck
4.57 (14)
The idea of a Value Chart indicator was presented in the very good book I read back in 2020 , " Dynamic Trading Indicators: Winning with Value Charts and Price Action Profile ", from the authors Mark Helweg and David Stendahl. The idea is simple and the result is pure genius: Present candlestick Price analysis in a detrended way! HOW TO READ THIS INDICATOR Look for Overbought and Oversold levels. Of course, you will need to test the settings a lot to find the "correct" one for your approach. It
FREE
BBMA with EMA50
Teeraporn Satitman
This indicator consist of Standard BBMA Standard signal Sign on chart added EMA50 Behavior Tracking: The chart background changes color based on the EMA50 (default is black) and shifts to white when a breakout of the Bollinger Bands occurs. Three Engulfing Color Change: Automatically adjusts colors to help you easily determine market zones. default yellow/white High-Low Line Sign: Highlights the potential trading range and key price levels for better visual  MHV
FREE
Free automatic Fibonacci is an indicator that automatically plots a Fibonacci retracement based on the number of bars you select on the BarsToScan setting in the indicator. The Fibonacci is automatically updated in real time as new highest and lowest values appears amongst the selected bars. You can select which level values to be displayed in the indicator settings. You can also select the color of the levels thus enabling the trader to be able to attach the indicator several times with differe
FREE
The indicator highlights the points that a professional trader sees in ordinary indicators. VisualVol visually displays different volatility indicators on a single scale and a common align. Highlights the excess of volume indicators in color. At the same time, Tick and Real Volume, Actual range, ATR, candle size and return (open-close difference) can be displayed. Thanks to VisualVol, you will see the market periods and the right time for different trading operations. This version is intended f
FREE
This is a buyer and seller aggression indicator that analyzes the shape of each candle and project this data in a histogram form. There are 4 histograms in one. On the front we have two: Upper - Buyer force. Lower - Seller force. At the background we also have two histogram, both with same color. They measure the combined strenght of buyers and sellers. This histograms can be turned off in Input Parameters. It is also possible to have the real or tick volume to help on this force measurement. IN
FREE
This indicator automatically detects harmonic price patterns on your chart, both bullish and bearish, and shows them as soon as they form, including potential patterns that are still developing. For every pattern it draws the Potential Reversal Zone (PRZ), and for completed patterns it also draws two take-profit and two stop-loss levels. Supported Patterns: Gartley, Bat, Butterfly, Crab, Deep Crab, Shark and Cypher. Each pattern can be switched on or off individually. Key Features: Completed
FREE
LT Donchian Channel
Thiago Duarte
4.86 (7)
Donchian Channel is an indicator created by Richard Donchian. It is formed by taking the highest high and the lowest low of the last specified period in candles. The area between high and low is the channel for the chosen period. Its configuration is simple. It is possible to have the average between the upper and lower lines, plus you have alerts when price hits one side. If you have any questions or find any bugs, please contact me. Enjoy!
FREE
Bar Color Trend
Germano Chagas
4.38 (8)
Combining the best of Price Action , Directional Movement , and Divergence/Convergence analysis, Candle Color Trend is a easy and reliable way to identify trend direction. The indicator automatically paints the candles according to the assumption that an uptrend is defined by prices that form a series of higher highs and higher lows. In contrast, a downtrend is defined by prices that form a series of lower highs and lower lows. Additionally, ADX Wilder indicator is used to measure trend weakness
FREE
Basic Vwap
james mugendi
4 (1)
Simple Vwap with the daily, weekly and monthly VWAP is the abbreviation for   volume-weighted average price , which is a technical analysis tool that shows the ratio of an asset's price to its total trade volume. It provides traders and investors with a measure of the average price at which a stock is traded over a given period of time. How it's used Identify entry and exit points:   Traders can use VWAP to determine when to buy or sell an asset.   Understand price trends :  Traders can use V
FREE
Reversal Oscillator — Advanced Momentum Shift Detector Reversal Oscillator is a free indicator designed to highlight price zones that are statistically outside their normal movement patterns, helping traders anticipate potential turning points before they occur. Unlike traditional oscillators that react mainly to overbought/oversold conditions, this indicator applies third derivative analysis (the "acceleration of the acceleration" of price) calculated using two independent methods within a n
FREE
Donchian Breakout And Rsi
Mattia Impicciatore
4.33 (3)
General Description This indicator is an enhanced version of the classic Donchian Channel , upgraded with practical trading functions. In addition to the standard three lines (high, low, and middle), the system detects breakouts and displays them visually with arrows on the chart, showing only the line opposite to the current trend direction for a cleaner view. The indicator includes: Visual signals : colored arrows on breakout Automatic notifications : popup, push, and email RSI filter : to val
FREE
Easy Correlations Indicator The Easy Correlations Indicator is designed to help traders analyze the relationship between two correlated instruments. By monitoring the distance between their Relative Strength Index (RSI) values, the indicator highlights situations where one instrument has moved significantly further than the other. This creates potential trading opportunities: Sell the stronger instrument (overstretched RSI) Buy the weaker instrument (lagging RSI) Because the positions are opened
FREE
RSI abcd
Francisco Gomes Da Silva
3.75 (4)
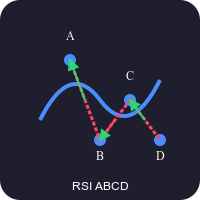
RSI ABCD Pattern Finder: Technical Strategy 1. How the Indicator Works Combines the classic RSI with automatic detection of ABCD harmonic patterns . Key Components Standard RSI (adjustable period) Peak and Trough Markers (arrows) ABCD Patterns (green/red lines) Overbought (70) and Oversold (30) Filters 2. MT5 Setup period = 14 ; // RSI period size = 4 ; // Maximum pattern size OverBought = 70 ; // Overbought level OverSold = 30 ; // Oversold level Filter = USE_FILTER_ YES ; // Confirmation filte
FREE
Important Lines
Terence Gronowski
4.88 (24)
This indicator displays Pivot-Lines, preday high and low, preday close and the minimum and maximum of the previous hour. You just have to put this single indicator to the chart to have all these important lines, no need to setup many single indicators. Why certain lines are important Preday high and low : These are watched by traders who trade in a daily chart. Very often, if price climbs over or falls under a preday low/high there is an acceleration in buying/selling. It is a breakout out of a
FREE
MACD Enhanced
Nikita Berdnikov
4 (4)
Introducing the MACD  Enhanced – an advanced MACD (Moving Average Convergence Divergence) indicator that provides traders with extended capabilities for trend and momentum analysis in financial markets. The indicator uses the difference between the fast and slow exponential moving averages to determine momentum, direction, and strength of the trend, creating clear visual signals for potential entry and exit points. Attention! To achieve the best results, it is recommended to adapt the indicator
FREE
TrendVision AI
Murtadha Majid Jeyad Al-Khuzaie
TrendVision AI – Smart Trend Channels & Price Forecasting for MetaTrader 5 Discover market structure and explore potential future price direction with TrendVision AI, an advanced technical indicator for MetaTrader 5 that combines automatic trendline analysis with a machine-learning-based price forecasting model. How Does TrendVision AI Work? TrendVision AI analyzes historical candlestick data within a configurable lookback window. It automatically draws two trendlines directly on the chart:
FREE
Hunttern ZigZag MT5
Hassan Gh Fakhraei
5 (1)
Hunt markets with Hunttern ZigZag . Easy to use with one parameter    You can use it for the following:       -Classic patterns       -Heads and shoulders       -Harmonic patterns       -Elliott Wave       -Support and resistance       -Supply and Demand Single parameter:      -Period (1-120) Features:        -Candle time        -Single parameter        -Light mode template This is version 1 of Hunttern ZigZag. We are very happy to receive feedback from you.
FREE
Follow The Line MT5
Oliver Gideon Amofa Appiah
4.6 (35)
This indicator obeys the popular maxim that: "THE TREND IS YOUR FRIEND" It paints a GREEN line for BUY and also paints a RED line for SELL. (you can change the colors). It gives alarms and alerts of all kinds. IT DOES NOT REPAINT and can be used for all currency pairs and timeframes. Yes, as easy and simple as that. Even a newbie can use it to make great and reliable trades. NB: For best results, get my other premium indicators for more powerful and reliable signals. Get them here: https://www.m
FREE
BBOscillator — Candle Coloring with Andean Oscillator States and ATR Stop Levels Overview BBOscillator is a technical indicator for MetaTrader 5 that is drawn in the main chart window. It combines the Andean Oscillator state logic, candle coloring, dynamic ATR stop levels and state-change marks in a single visual layer, so that four questions can be answered by looking at one chart: whether the direction is defined, which side it leans to, where the direction state started, and where a stop refe
FREE
Candlestick Patterns Context labels well-known candle patterns. It also lets you hide the small or out-of-context ones that make most pattern tools noisy. Patterns (each can be switched on or off) - Bullish and bearish engulfing - Hammer and shooting star - Bullish and bearish harami - Piercing line and dark cloud cover - Morning star and evening star - Three white soldiers and three black crows (off by default) - Doji (off by default; labelled with no direction) Filters - Minimum size: the sign
FREE
CandlePro X
Murtadha Majid Jeyad Al-Khuzaie
CandlePro X — Free Professional Candle Visualizer for MetaTrader 5 CandlePro X is a free chart visualization indicator for MetaTrader 5, designed to make candlestick charts cleaner, sharper, and easier to read. If you find it difficult to quickly distinguish bullish and bearish candles, especially on busy charts, CandlePro X helps solve this problem by giving your candles stronger colors, clearer contrast, and a more professional appearance. CandlePro X does not generate trading signals, pred
FREE
Girassol Sunflower MT5 Indicator
Saullo De Oliveira Pacheco
3.86 (7)
This is the famous Sunflower indicator for Metatrader5. This indicator marks possible tops and bottoms on price charts. The indicator identifies tops and bottoms in the asset's price history, keep in mind that the current sunflower of the last candle repaints, as it is not possible to identify a top until the market reverses and it is also not possible to identify a bottom without the market stop falling and start rising. If you are looking for a professional programmer for Metatrader5, please
FREE
Gold Platinum Support Resistance Channels Support Resistance Channels is a technical indicator that automatically detects and draws support and resistance zones using pivot points and price action. It identifies key price levels, ranks channels by strength, highlights broken support and resistance, and offers optional pivot point markers and SMA/EMA moving averages. Designed to help traders identify important market levels, potential breakout areas, and price structure across different timeframe
FREE
Are you tired of drawing trendlines every time you're analyzing charts? Or perhaps you would like more consistency in your technical analysis. Then this is for you. This indicator will draw trend lines automatically when dropped on a chart. How it works Works similar to standard deviation channel found on mt4 and mt5. It has 2 parameters: 1. Starting Bar 2. Number of bars for calculation The   starting bar   is the bar which drawing of the trend lines will begin, while the   number of bars for c
FREE
How it works –   Base-departure detection — algorithmically finds consolidation bases (overlapping range with compressed volatility) followed by displacement departures. Patterns: Drop-Base-Rally, Rally-Base-Drop, Rally-Base-Rally, Drop-Base-Drop — detected structurally, not by candle names. –   Strength score (0–100) — from departure velocity, time-at-base, freshness (each revisit decays the score), higher-timeframe confluence and origin volume. –   Lifecycle — Fresh, Tested (decaying), Broken
FREE
Weis Waves
Flavio Javier Jarabeck
2.83 (18)
The original author is David Weis, an expert in the Wyckoff Method. The Weis Wave is a modern adaptation of the 1930's Wyckoff Method, another expert in Tape Reading techniques and Chart Analysis. Weis Waves takes market volume and stacks it into waves according to price conditions giving the trader valuable insights about the market conditions. If you want to learn more about this subject you can find tons of videos in YouTube. Just look for "The Wickoff Method", "Weis Wave" and "Volume Spread
FREE
Pivot MT5
Dmitrij Isaenko
The indicator draws daily support and resistance lines on the chart, as well as the Pivot level (reversal level). Adapted to work in MT5 The standard timeframe for calculating support and resistance levels is D1. You can choose other timeframes according to your strategy (for example, for M1-M15, the optimal timeframe for calculations is H1) The function for calculating support and resistance levels has been updated; in this calculation option, fibonacci levels are taken into account, respec
FREE
Buyers of this product also purchase
Trend Sniper X
Sarvarbek Abduvoxobov
4.87 (45)
Trend Sniper X is a multi-timeframe trend-following indicator for MetaTrader 5 that helps traders identify trend direction and potential reversal points with clarity and precision. for MT4: https://www.mql5.com/en/market/product/193245 Price Information: The current price is promotional and is subject to change as upcoming updates and new features are released. Bonus Offer: To get the FREE Auto-Trade Assistant EA for this indicator, please message the author after purchasing. Code2Profit Channe
A new King in town - Indicator + Order management indications(tp1+tp2+tp3) + Optional Telegram Signal sender   INCLUDED (FREE) + Bonus EA Robot ( FULL TRADING  and SIGNAL SYSTEM ) Our best EA for Gold: Gold Slayer TRY > Reversion Queen  Expert advisor >JOIN Community Channel < NEW Free Automation EA link < click here ( disclaimer: this is new and still on testing and phase , use at your risk on demo) Free Telegram Bridge < click here  This indicator includes an advanced Strategy, a trading sys
Smart Trend Trading System — MetaTrader 5 Message me on MQL5 after purchase to receive Smart Universal Expert Advisor for FREE, plus the online course, PDF manual, and private group access. STTS brings trend direction, entry and exit signals, reversal zones, and important price levels together on your chart. Follow the system manually, or connect a separate compatible EA for automated execution using your chosen settings. ONE SYSTEM. FOUR TRADING APPROACHES. STTS organizes its trading approaches
Entry Points Pro shows you where to enter, where to put the stop and what lot to trade — before you place the order. PRICE Now 199 USD: 8 copies at this price, then 249 USD. The final price is 349 USD. I make my money trading the markets, and I show it, so I don't need to sell this indicator to everyone. It is a tool for traders who think for themselves, not a magic button. No breakout, no trade. A gray arrow is a cancelled signal: price did not break the signal candle, so there was no entry
M5 Sniper
MeanFX
5 (4)
Get your trading edge in the line of sight M5 Sniper   is a new indicator by MeanFX. It combines   precise trading signals   with   adaptive TP/SL levels   - creating best possible statistical trades as a result! The price increases every 5 purchases, the next price is 79$ Message me after purchase to receive tips/guide and bonus EA plus trading methodology Auto Optimisation only works on LIVE chart , needs data feed >JOIN Community Channel < What makes it stand out?   Proven statistical per
Ultra Indicator
Ihor Otkydach
5 (1)
ULTRA is a technical indicator that operates on an “all-in-one” basis—it independently analyzes the market, generates trading signals, displays levels for setting stop-loss orders, and suggests when to close trades to lock in profits or minimize losses. In other words, it doesn't matter if you don't know how to analyze the market, determine levels—where to set your stop-loss—or struggle with money management. ULTRA will do all of that for you! BUYER BONUS: After purchasing the ULTRA indicator, s
Gann Made Easy   is a professional and easy to use Forex trading system which is based on the best principles of trading using the theory of W.D. Gann. The indicator provides accurate BUY and SELL signals including Stop Loss and Take Profit levels. You can trade even on the go using PUSH notifications. PLEASE CONTACT ME AFTER PURCHASE TO GET TRADING  INSTRUCTIONS   AND GREAT EXTRA INDICATORS  FOR FREE! Probably you already heard about the Gann trading methods before. Usually the Gann theory is a
Zoryk Gold
Reda El Koutbane
4.79 (19)
discount ends SOON next price 69 $ ZORYK — Advanced XAUUSD Signal System for MetaTrader 5 You know the feeling. You spend time analyzing gold. You wait for the entry. You finally open the trade, and price immediately moves against you. You close too early, move the Stop Loss or hesitate for a few seconds. Then the market reaches the exact destination you originally expected without you. The direction was not always the problem. The real problem was uncertainty. You did not know exactly where th
SMC Intraday Formula
VividMind Digital Solutions
5 (26)
Secure the Lowest Price Today. After purchase, contact via   MQL5 inbox   to receive your buyer kit and bonus. Let's be honest first. No indicator will make you profitable on its own. If someone tells you otherwise, they're selling you a dream. Every indicator that shows perfect buy/sell arrows can be made to look flawless — just zoom into the right window of history and screenshot the winners. We won't do that. SMC Intraday Formula is a tool. It reads the market structure for you, maps the hig
SuperScalp Pro
Van Minh Nguyen
4.54 (37)
SuperScalp Pro - Professional Multi-Layer Confluence Scalping System SuperScalp Pro is an advanced scalping indicator that upgrades the classic Supertrend with multiple intelligent confirmation filters. It helps you identify higher-probability Buy/Sell opportunities while significantly reducing false signals. Clear Buy and Sell arrows appear directly on the chart, along with automatic ATR-based Stop Loss and Take Profit levels calculated in real time. After purchase, please message me on MQL5 to
GoldenX Entry MT5
VividMind Digital Solutions
5 (17)
Price will increase by $20 every 10 buyers to maintain premium value. After purchase, contact via   MQL5 inbox   to receive your buyer kit and bonus. You have probably tested dozens of indicators before. But we are not here to be “just another signals indicator.” Behind GoldenX Entry is intensive research & development focused on building sophisticated algorithms designed to adapt to the real behavior of every instrument — not generic signals recycled everywhere else. From advanced Auto Optim
Gold Trend Coach MT5
Cristhian Alexander Gaibor Cuasquer
4.27 (11)
Non-repainting buy and sell signals for gold (XAUUSD) on MetaTrader 5. Every signal comes with a stop loss and three take profits. A Smart Money Concepts filter with BOS and CHoCH, so you trade with the structure, not against it. A live Mentor on your panel that guides every step from the entry to TP3. And alerts straight to your phone and your own Telegram channel. That is Gold Trend Coach. Never trade alone again. FREE BUYER KIT with your purchase: 1. Telegram Alert Bridge: your signals go to
Boba Analysis Suite
Trade Ready Solutions LLC
5 (2)
Boba Analysis Suite Boba Analysis Suite is an analytical indicator for MetaTrader 5. It brings market structure, relevant price zones and broader market context together in a single chart view. Developed through practical experience as a trader and trading coach, it supports a structured analysis process: assessing market direction, identifying important levels and considering multiple timeframes together. Analysis in Context Individual signals gain meaning through context. Boba Analysis Suite h
FX Power MT5 NG
Daniel Stein
5 (33)
FX Power: Analyze Currency Strength for Smarter Trading Decisions Overview FX Power is your go-to tool for understanding the real strength of currencies and Gold in any market condition. By identifying strong currencies to buy and weak ones to sell, FX Power simplifies trading decisions and uncovers high-probability opportunities. Whether you’re looking to follow trends or anticipate reversals using extreme delta values, this tool adapts seamlessly to your trading style. Don’t just trade—trade
Azimuth Pro
Ottaviano De Cicco
5 (7)
Azimuth Pro V2: Synthetic Fractal Structure and Confirmed Entries for MT5 Overview Azimuth Pro is a multi-level swing structure indicator by Merkava Labs . Four nested swing layers, swing-anchored VWAP, ABC pattern detection, three-timeframe structural filtering, and closed-bar confirmed entries — one chart, one workflow from micro-swings to macro-cycles. This is not a blind signal product. It is a structure-first workflow for traders who care about location, context, and timing. 1. What Change
FiboSniper Pro
Van Minh Nguyen
5 (4)
FiboSniper Pro - Multi-Filter Fibonacci System with Auto SL/TP and Control Panel FiboSniper Pro is a technical indicator that combines dynamic Fibonacci Envelopes with multiple confirmation filters to generate selective Buy and Sell signals. Fibonacci levels are calculated from Moving Average and ATR, then filtered by ADX, EMA, RSI, ATR, Volume, Time and Candle structure. The indicator displays automatic ATR-based Stop Loss and Take Profit levels directly on the chart, along with an interactive
Atomic Analyst MT5
Issam Kassas
4.51 (65)
Atomic Analyst — MetaTrader 5 Message me on MQL5 after purchase to receive Smart Universal Expert Advisor for FREE, plus the online course, PDF manual, and private group access. Atomic Analyst brings price action, trend direction, entry and exit signals, Stop Loss and multiple Take Profit levels together on your chart. SEE THE SIGNAL. UNDERSTAND THE SETUP. Atomic Analyst organizes its analysis into clear visual information: • Buy and sell arrows to identify potential entries. • Stop Loss and mul
Gold Entry Sniper
Tahir Mehmood
5 (23)
Gold Entry Sniper – Professional Multi-Timeframe ATR Dashboard for Gold Scalping & Swing Trading Gold Entry Sniper is a cutting-edge MetaTrader 5 indicator designed to give traders precise buy/sell signals for XAUUSD and other symbols, powered by ATR Trailing Stop logic and a multi-timeframe analysis dashboard . Built for both scalpers and swing traders, it combines real-time market direction , dynamic stop levels , and professional visual dashboards to help you identify high-probability gold en
M1 Sniper MT5
Oleg Rodin
5 (7)
M1 SNIPER  is an easy to use trading indicator system. It is an arrow indicator which is designed for M1 time frame. The indicator can be used as a standalone system for scalping on M1 time frame and it can be used as a part of your existing trading system. Though this trading system was designed specifically for short-term trading, it still can be helpful for all traders. This trading system can be used with any forex pair and time frame, though lower time frames are recommended from M1 up to M
SQN Max indicator for MT5 by ITC
Renaud Herve Francois Candel
Sqn Max Indicator Sqn Max is an exclusive indicator to trade the market with high effectiveness. The indicator is based on price action, volatility and trend. This indicator is as simple as possible but not too simple. The indicator can generate alerts to ease the trading process. You don't have to stay all day in front of your screen. The indicator can be used with any class of assets and with any time frame. It is possible to achieve better results trading our list of selected assets. We achi
Auto Optimized SpeedAngle is an institutional-grade momentum vectoring system that eliminates curve-fitting through continuous Walk-Forward Optimization (WFO). Rather than relying on static inputs that degrade when market regimes shift, the indicator dynamically recalibrates its parameters using Out-of-Sample (OOS) validation, ensuring the displayed signals represent genuine statistical edges rather than historical anomalies. By shifting the focus from subjective visual angles to normalized, qua
Apex Patterns PRO Buy Indicator - Get Expert Advisor Based on it for FREE. Self-Optimizing Chart Pattern & Breakout Intelligence Traditional pattern scanners rely on fixed inputs, often underperforming when market volatility and structures shift. Apex Patterns PRO is designed to adapt to changing market conditions by combining structural chart pattern recognition, momentum filtering, and statistical self-optimization into one analytical framework. Adaptive Scanning Engine Self-Optimizing Patter
Adaptive Price Action Engine Buy Indicator- Get EA Based on it for FREE. Self-Optimizing Multi-Timeframe Trend & Candlestick Intelligence Markets do not behave the same way all the time—and not every price-action pattern has the same value in every market regime. Adaptive Price Action Engine is designed to adapt to changing market conditions by combining trend structure, multi-timeframe analysis, candlestick patterns, and statistical optimization into one analytical framework. Two Adaptive Mode
Welcome to Entry In The Zone & SMC Multi Timeframe —  COMPLETE SMC ANALYSIS SYSTEM — ALL IN ONE INDICATOR Entry In The Zone & SMC Multi Timeframe  An indicator designed for market analysis based on Smart Money Concepts (SMC), displaying Market Structure, Key Zones (Order Blocks, Supply & Demand Zones, and Fair Value Gaps), Liquidity, and real-time BUY / SELL signals. It supports both Single-Timeframe and Multi-Timeframe analysis, along with the Confluence at Zone feature, which helps you evaluat
Divergence Bomber
Ihor Otkydach
4.89 (94)
Each buyer of this indicator also receives the following for free: The custom utility "Bomber Utility", which automatically manages every trade, sets Stop Loss and Take Profit levels, and closes trades according to the rules of this strategy Set files for configuring the indicator for various assets Set files for configuring Bomber Utility in the following modes: "Minimum Risk", "Balanced Risk", and "Wait-and-See Strategy" A step-by-step video manual to help you quickly install, configure, and
Power Candles MT5
Daniel Stein
4.58 (12)
Power Candles - Self-Optimizing Strength Indicator Strength usually lives in a sub-window. The line runs below, the candle above, and your eye keeps connecting the two. Power Candles puts the strength into the candle itself, colored from dark red to dark green, so the chart reads at a glance and the sub-window stays closed. The indicator also finds its own settings for the symbol and timeframe in front of you. One click on [ Apply Best ] draws entry, Stop Loss and Take Profit at the exact prices
Currency Strength Wizard   is a very powerful indicator that provides you with all-in-one solution for successful trading. The indicator calculates the power of this or that forex pair using the data of all currencies on multiple time frames. This data is represented in a form of easy to use currency index and currency power lines which you can use to see the power of this or that currency. All you need is attach the indicator to the chart you want to trade and the indicator will show you real s
Tokyo mt5 Indicator
Vasiliy Strukov
5 (15)
Tokyo Indicator provides a clear visual overview of trend direction, potential trading signals, and market conditions. Its colour-coded, stepped trend line distinguishes bullish phases in blue from bearish phases in magenta. Matching directional arrows highlight potential buying and selling opportunities when the displayed trend changes. An integrated dashboard brings together the current signal, market bias, momentum, volatility, and signal quality in one convenient view. This allows traders t
Naked Forex Tweezer Pro Indicator Tweezer Pro Indicator is a pattern recognition indicator for Forex, Stocks, Indices, Futures, Commodities and Cryptos. The standard Tweezer is a two bar pattern. Our enhanced version is a multi-bar pattern. We filter the patterns for you so that you only get the     best and most effective patterns   and ignore the noise. The Tweezer pattern is a simple and effective pattern to trade. The strategy that comes with the Tweezer is based on price action. The Twe
Unix Scalper
Issam Kassas
4 (4)
Unix Scalper — MetaTrader 5 Message me on MQL5 after purchase to receive Smart Universal Expert Advisor for FREE, plus the online course, PDF manual, and private group access. Find the setup. See the plan. Choose how to trade it. UNIX Scalper brings market analysis, BUY/SELL/WAIT decisions and Entry, Stop Loss, TP1 and TP2 levels into one organized panel. SEE THE SIGNAL AND THE PLAN • Clear decisions: BUY, SELL or WAIT. • Defined levels: Entry, Stop Loss, TP1 and TP2. • Multi-timeframe overvie
More from author
GridTrailling
Chaianan Kraimud
Smart breakout grid EA with trailing pending orders, trailing stop, session/news filters, drawdown protection, and netting-safe execution for MT5. GridTrailingEA is a smart pending-order grid Expert Advisor with trailing pending orders, trailing stop, session filter, news-time filter, drawdown protection, and market-safe validation for MT5. GridTrailingEA is a MetaTrader 5 Expert Advisor designed for traders who want a clean and controlled grid-style pending order system. The EA places Buy Stop
AlligatorPro Signal A non-repainting Alligator + Awesome Oscillator + ADX signal indicator with multi-channel alerts. Overview AlligatorPro Signal scans price action using Bill Williams' Alligator combined with the Awesome Oscillator and ADX trend filter, and marks confirmed entry points directly on the chart with arrows — green for buy, red for sell. No trades are placed; this is a pure signal/alert tool you can use manually or alongside your own execution method. All signals are evaluated on c
FREE
God of Breakout
Chaianan Kraimud
Breakout Retest Pro XAUUSD M5 M1 # Breakout Retest Pro XAUUSD M5 **Breakout Retest Pro** is an advanced automated trading system designed exclusively for **Gold (XAUUSD)** on the **M5 timeframe**. It combines the proven logic of **Asian Session Box Breakout** with a **strict Retest Confirmation** to filter out false breakouts and trade only high-probability setups. ## What Makes This EA Different? Most breakout EAs enter immediately after a breakout, often falling into false moves.   **Breako
AlligatorTrade Professional — Multi-Filter Trend EA for Gold (XAUUSD) Trade gold with discipline — powered by multi-layer signal confirmation and professional-grade capital protection. AlligatorTrade Professional is an Expert Advisor purpose-built for XAUUSD, combining multiple technical indicators into a single confirmation engine to filter out low-quality signals, paired with a capital protection system engineered at every level — from a single trade up to the entire trading day. Key Features
GMM Liquidity GOLD Hunter Statistical Liquidity Sweep Reversal EA for XAUUSD Trade liquidity sweeps — not conventional swing levels. GMM Liquidity GOLD Hunter is a fully automated Expert Advisor designed specifically for XAUUSD (Gold) . Instead of relying solely on traditional swing-high/low detection, the EA uses a Weighted Gaussian Mixture Model (GMM) with BIC-based cluster selection to statistically identify areas where wick extremes have concentrated over time. The EA then waits for price t
Filter:
No reviews
Reply to review