Squeeze Momentum Alert MT5
- Indicators
- Version: 1.0
- Activations: 20

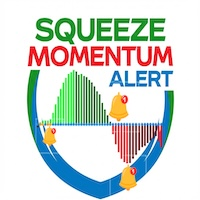
Squeeze Momentum Alert
1. Identifies Price "Explosion" Points (The "Squeeze") The greatest advantage of this indicator is its ability to catch periods where the market is "consolidating" or "gathering energy" before a massive move.
-
Why it's good: Markets cycle between periods of calm (consolidation) and bursts of volatility (explosions). This tool tells you, "The chart is currently compressing tightly; get ready for the next big surge," ensuring you don't miss the start of a major trend.
2. Distinguishes Trend "Strength" in Detail (Color Coded Momentum) The histogram doesn't just tell you if the price is up or down, but uses 4 colors to indicate trend health:
-
Lime: Strong Up (Chase the price).
-
Dark Green: Weak Up (Warning: momentum is fading, prepare to lock in profits).
-
Red: Strong Down (Heavy selling).
-
Maroon: Weak Down (Selling pressure is fading).
-
Why it's good: It helps you know exactly when to "Enter" (strong trend) and when to "Flee" immediately as the color changes (momentum loss) before the price actually reverses.
3. Filters False Signals in Sideways Markets (Noise Filtering) During trendless periods or narrow ranging markets, this tool displays a "Compression" status (usually orange dots).
-
Why it's good: It prevents over-trading during directionless markets, where most traders lose money (getting stopped out repeatedly). This tool tells you to "sit on your hands" and wait until the compression ends.
4. Comprehensive Alert System (Never Miss a Trade) This version is upgraded with a complete alert system, perfect for those who can't watch the screen all day. It alerts on:
-
Squeeze Start: Entering consolidation (Prepare).
-
Squeeze Fire: Price explosion (Entry timing).
-
Momentum Reversal: Momentum color change (Reversal or trend end).
-
Channels: Popup, Push Notification (Mobile), and Email.
5. Easy to Read, All-in-One Visual Instead of opening multiple charts (like Bollinger Bands overlapping Keltner Channels plus MACD), this tool aggregates that data into a single, easy-to-read visual.
-
Why it's good: It reduces screen clutter (Clean Chart), allowing for faster decisions without interpreting multiple confusing tools.
Summary: This indicator is like a "Spring." It tells you when the spring is being pressed down (Squeeze) and when it snaps back (Fire), along with the direction and strength of that release, helping you jump on the price movement at the perfect moment.