Smart Volume Profile MT5
- Indicatori
- Versione: 1.10
- Aggiornato: 30 novembre 2025
- Attivazioni: 20

Italian
-
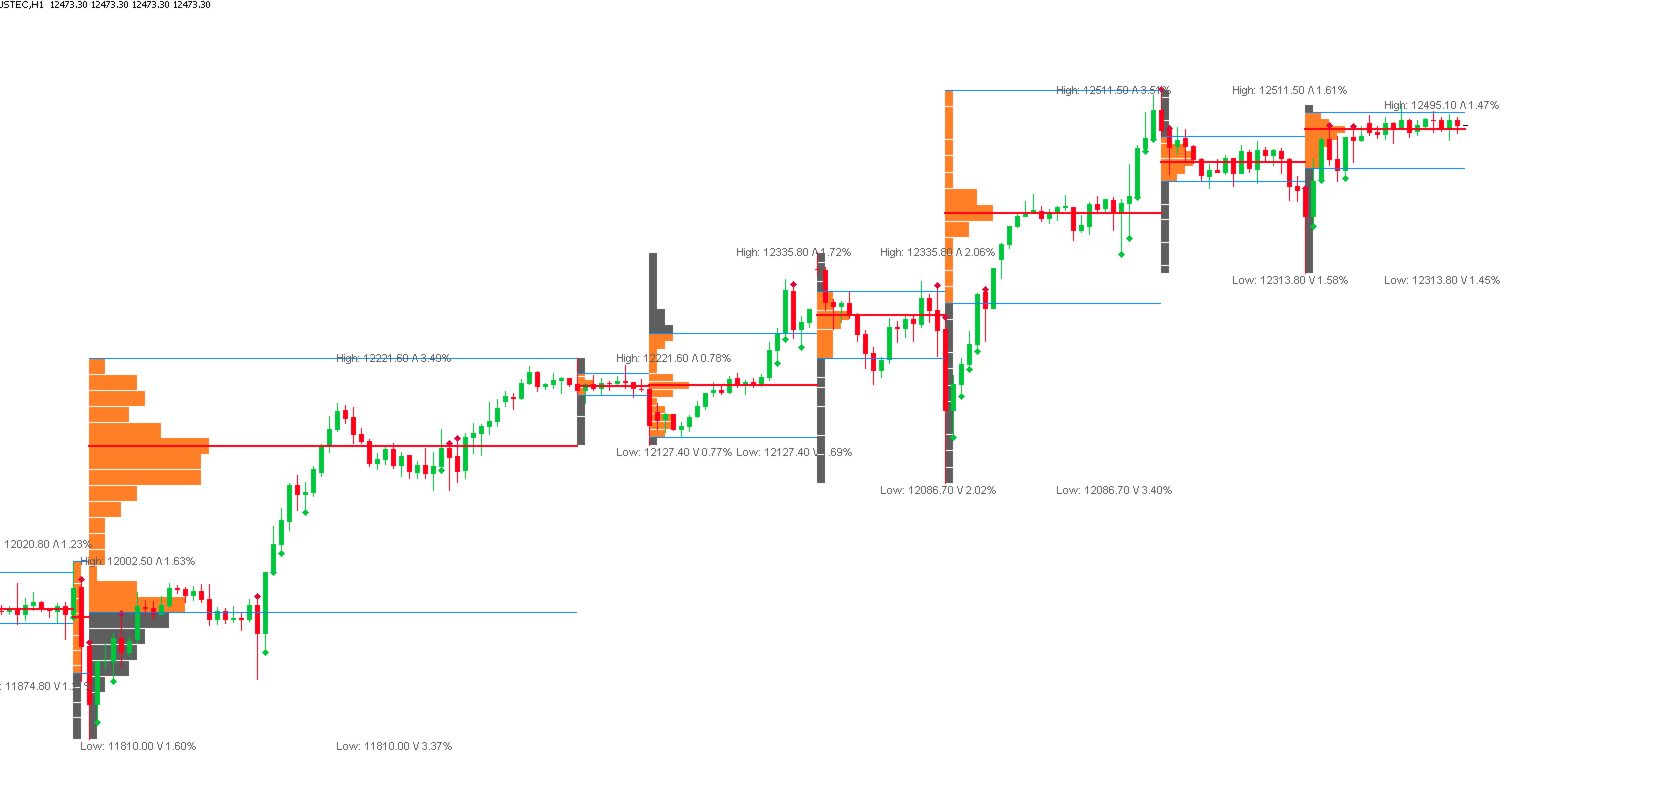
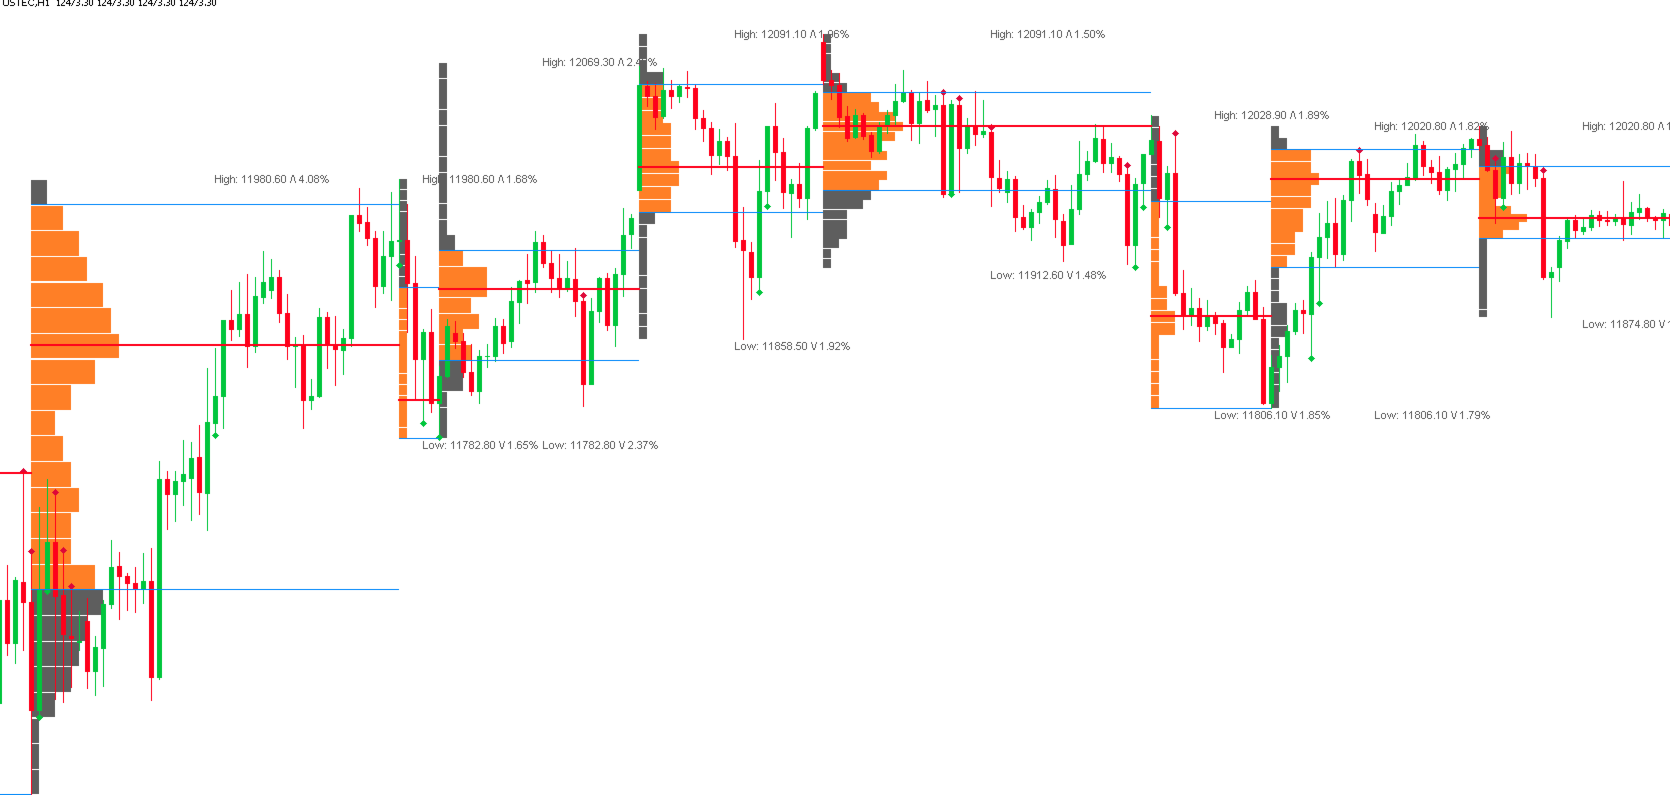
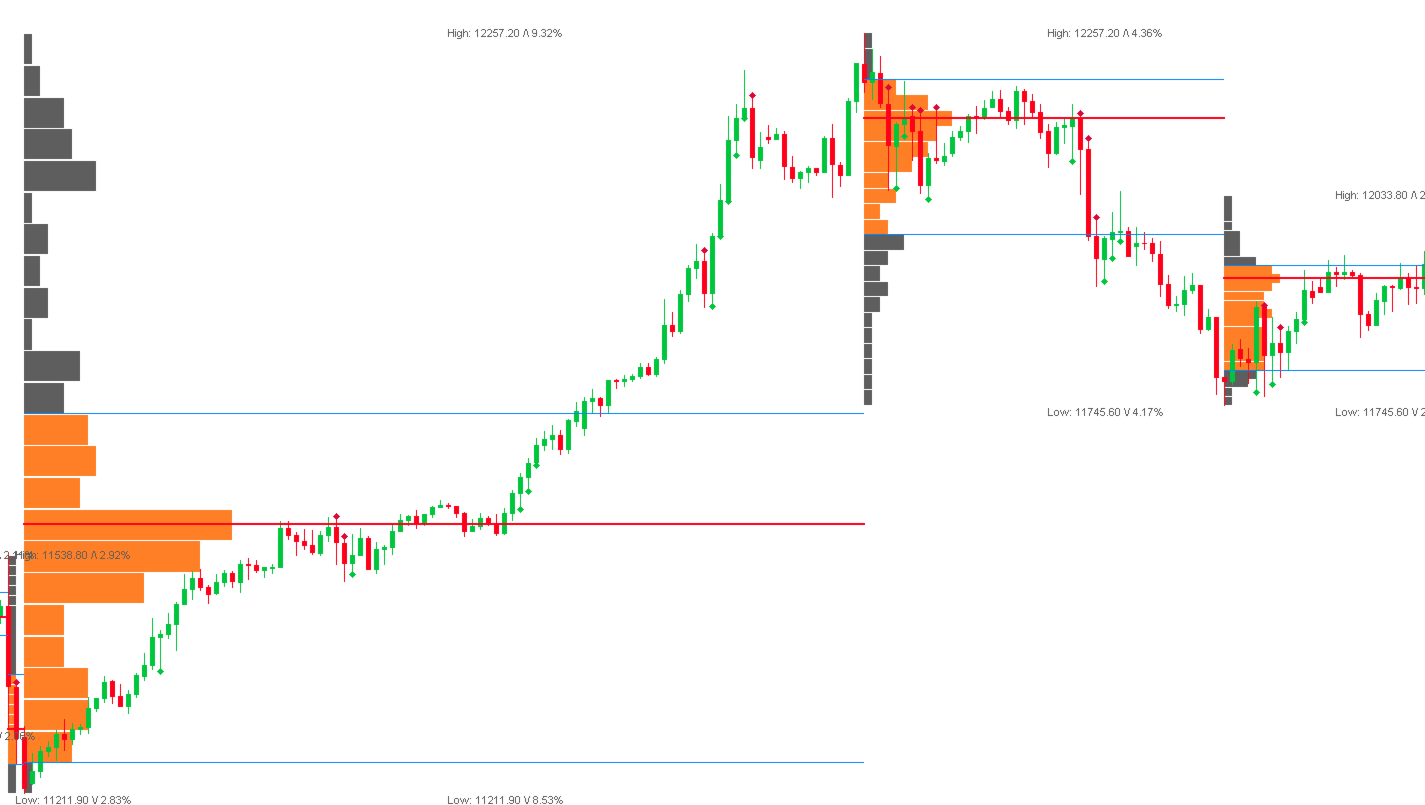
Scansione "Smart Money" (Volume Markers): Le frecce indicano un volume anomalo (superiore alla media) con chiari colori verde/rosso. Aiuta a identificare l'ingresso dei grandi investitori e a filtrare i falsi segnali.
-
Avvisi Critici (Alerts): Non serve fissare lo schermo. Il sistema ti avvisa immediatamente quando il prezzo incrocia la linea POC (Point of Control), che è spesso un punto decisivo per la continuazione o l'inversione.
-
Struttura di Mercato Istantanea (Developing Profile): Mostra il profilo del ciclo di prezzo che si sta formando. Ti permette di vedere se il prezzo sta uscendo da una zona di accumulazione o se viene attratto verso la media.


The smart volume profile indicator is a powerful tool for identifying key support and resistance levels based on real market volume. It clearly displays high volume and low volume areas, including the point of control, which often acts as a strong reaction zone for price. the indicator is easy to read and works well with smart money concepts, it's a reliable tool for traders looking to improve entry precision and market understanding.