Session Volatility Map
- Indicators
-
Strifor (Mauritius) Ltd
 Welcome to Strifor!
Our mission is to promote a culture of conscious trading in the financial markets. - Version: 2.5
- Updated: 12 October 2026
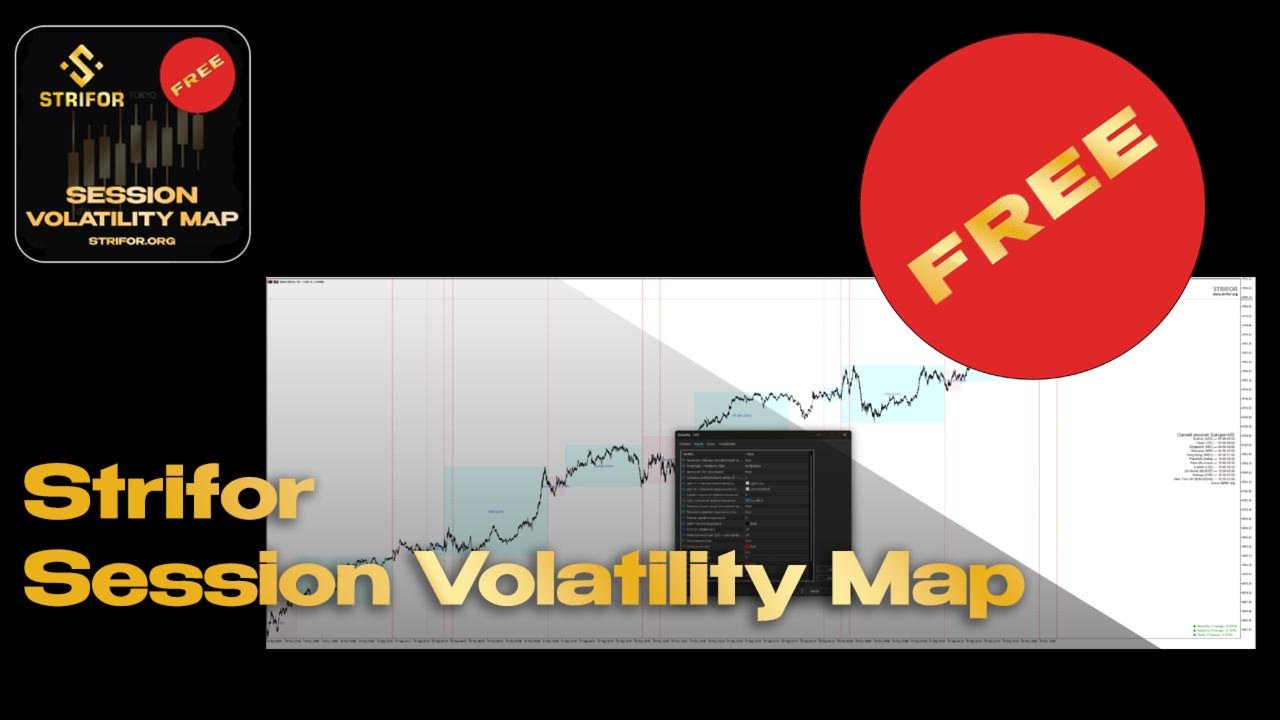
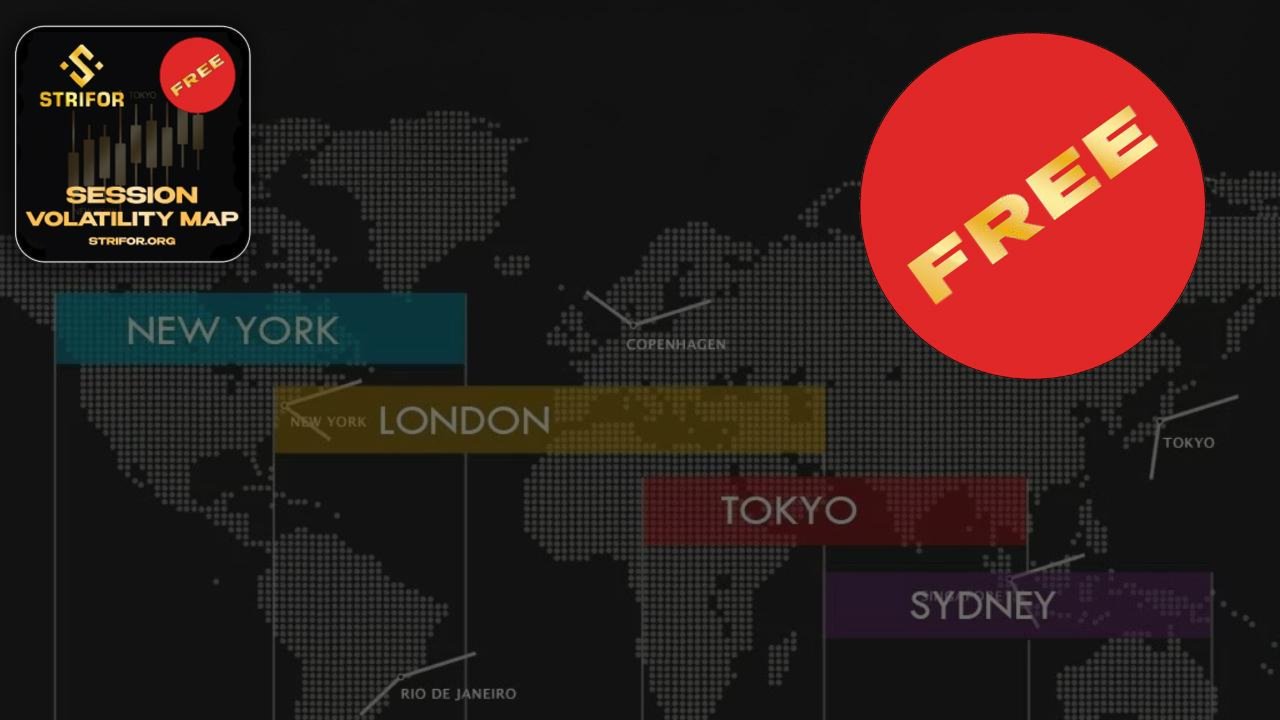
Session Volatility Map is a professional trading indicator that visualizes market behavior through the three key trading sessions: Asia, Europe, and the United States.
It helps traders instantly understand:
- when the market is quiet
- when volatility is increasingwhere major impulses and reversals are likely to form
1. Trading sessions on the chart
The indicator automatically marks:
- Asian session
- European session
- US session
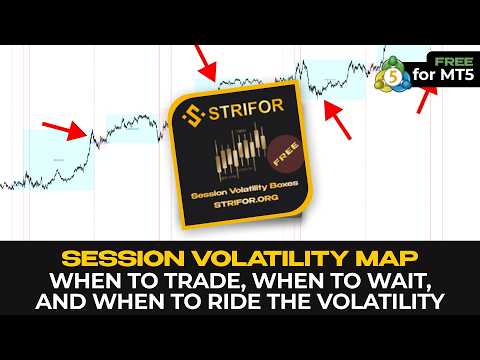
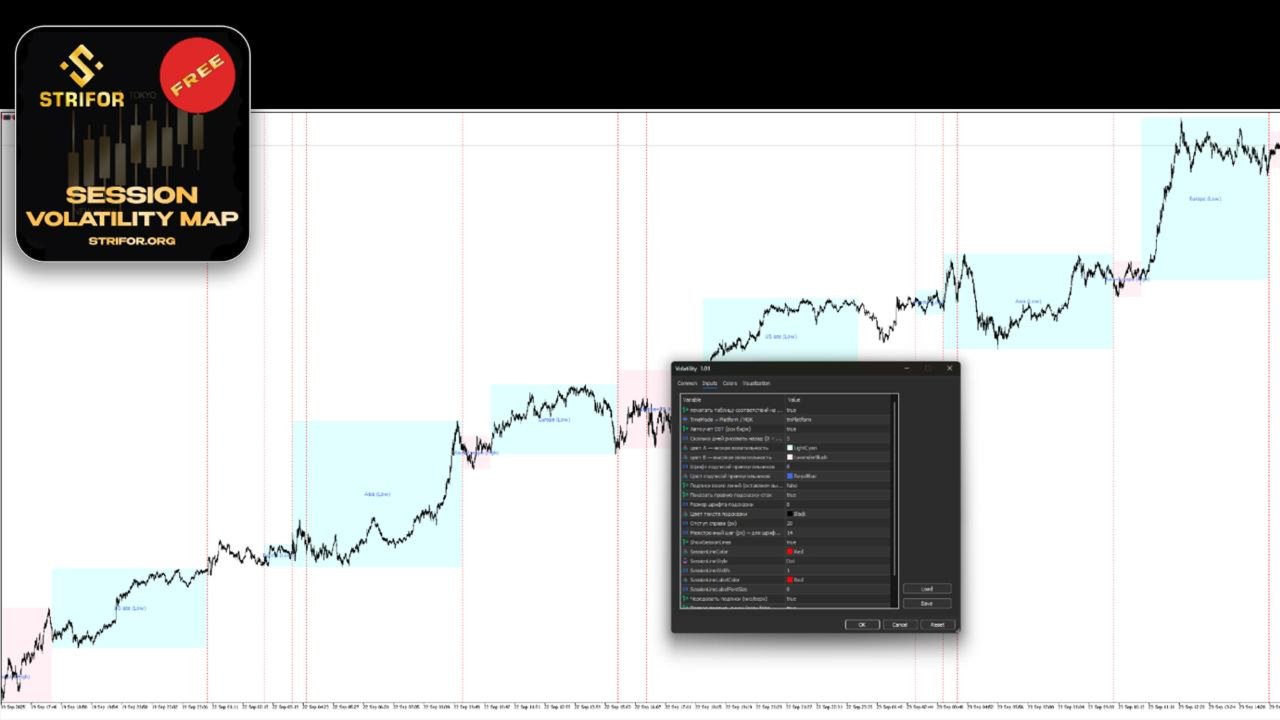
Each session is clearly highlighted on the chart, allowing you to instantly understand the structure of the trading day without manual time analysis.
2. High-volatility zones
Special focus is placed on session overlaps, where market activity typically increases.
These zones often produce:
- strong impulsive moves
- breakouts of key levels
- trend initiation
Overlapping sessions are automatically highlighted as high-volatility areas.
3. High–Low range for each session
For every trading session, the indicator plots:
- session high
- session low
These levels can be used as:
- support
- resistance
- breakout reference zones
4. Active session tracking in real time
The indicator always displays:
- the currently active trading session
- transitions between market phases
5. Automatic time adjustment
No manual configuration is required:
- daylight saving time (DST) support
- accurate session timing across regions
- compatibility with MT4 / MT5 / platform time models
Scalpers
- identify optimal high-volatility moments
- avoid low-activity market conditions
Intraday traders
- understand daily market structure
- trade only active market phases
News traders
- identify which session aligns with news releases
- evaluate potential market impact
The indicator is fully customizable to fit any trading style.
Time configuration
- Time model (Platform / MT4 / MT5)
- Auto DST adjustment
- History depth (days to display)
Session visualization
- Color A — low volatility periods
- Color B — high volatility (session overlaps)
Labels and levels
- Font size and color for range labels
- Extra labels toggle
- Flexible label positioning
Activity panel
- Right-side session panel
- Font size and color settings
- Line spacing and padding
- Panel font selection
Chart elements
- vertical session start lines
- customizable line color, style, and width
- session line labels
- top or bottom label positioning
Markets do not move randomly.
They move in session-driven phases:
- Asia — accumulation
- Europe — expansion
- US — momentum
Session Volatility Map visualizes this structure directly on the chart without manual analysis.
SummaryWith this indicator, you can always see:
- when the market is preparing for movement
- where volatility is likely to increase
- which levels are currently relevant
- what phase of the trading day you are in




















































Instant installation, easy setup, useful for daily trading and scalping