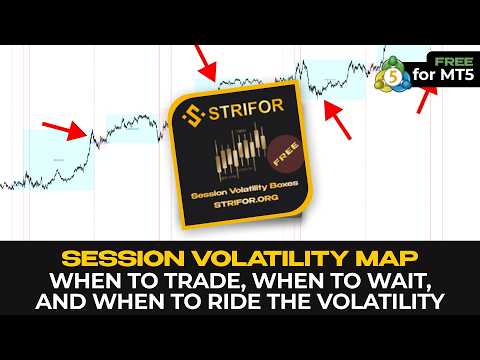
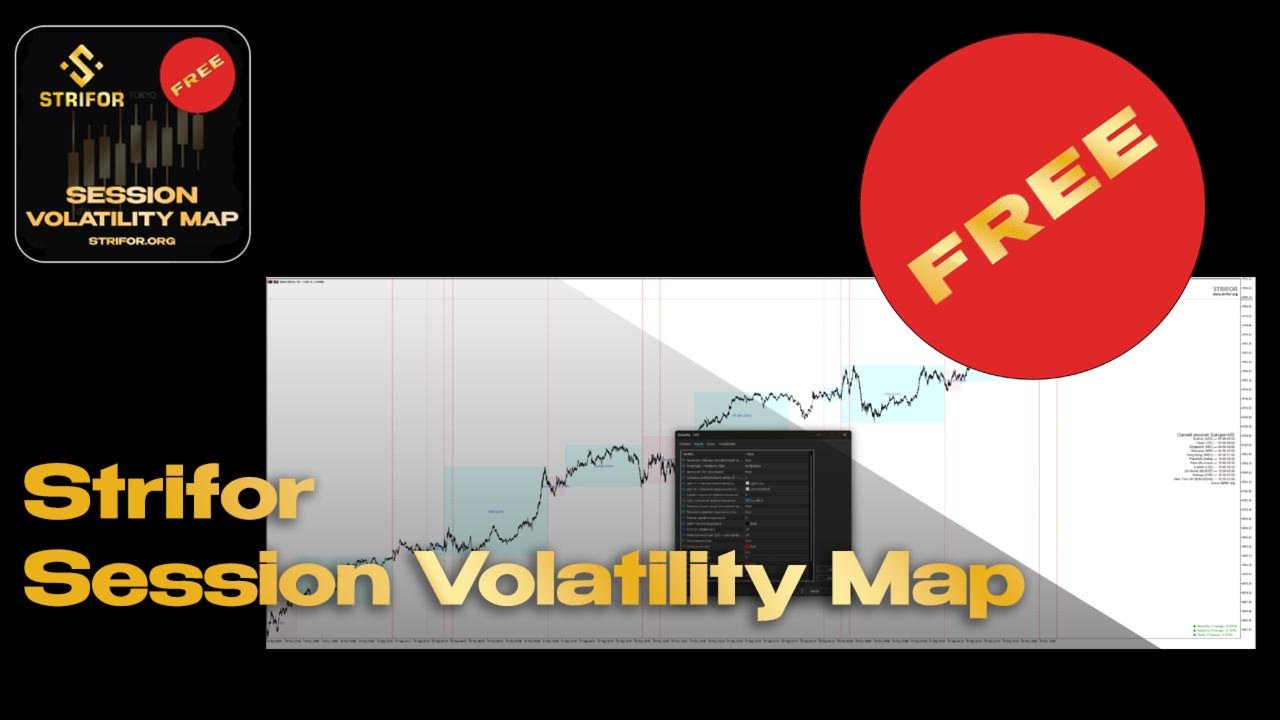
Session Volatility Map
- 지표
-
Strifor (Mauritius) Ltd
 Ltd") Welcome to Strifor!
Welcome to Strifor!
Our mission is to promote a culture of conscious trading in the financial markets. - 버전: 2.3
- 업데이트됨: 10 11월 2025
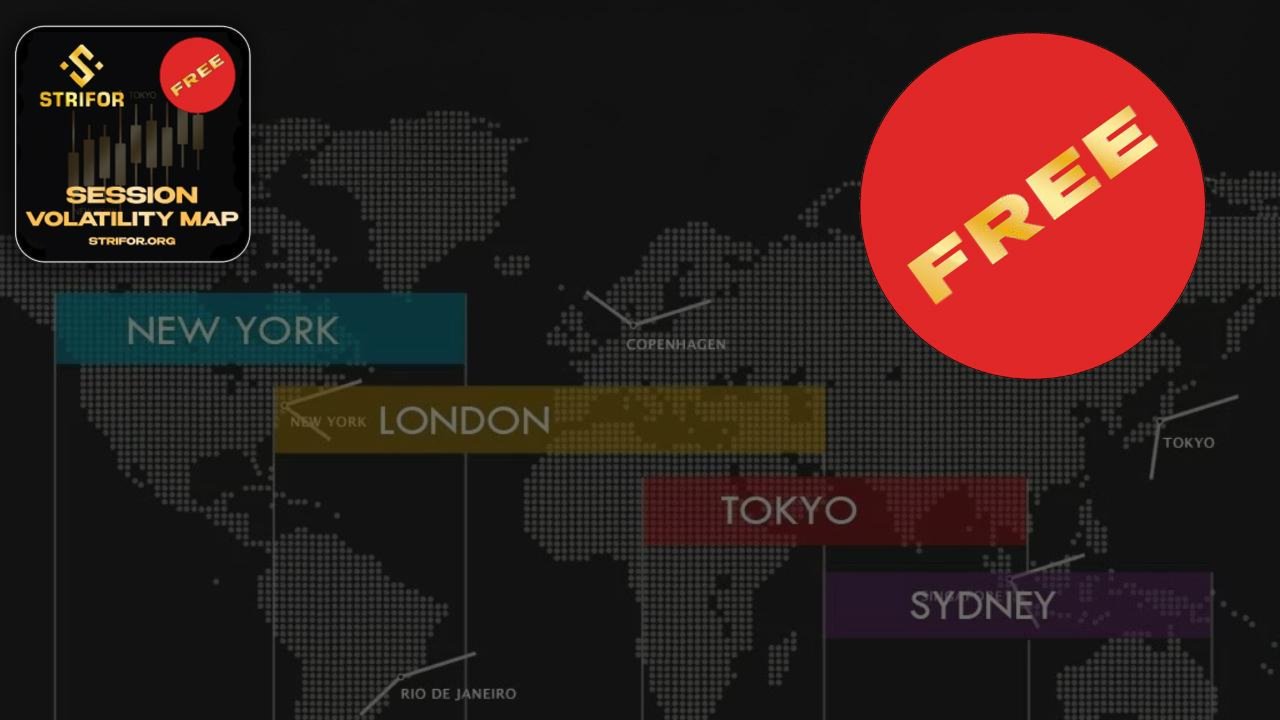
Session Volatility Map — 주요 거래 세션(아시아, 유럽, 미국)을 차트에 표시하는 지표입니다.
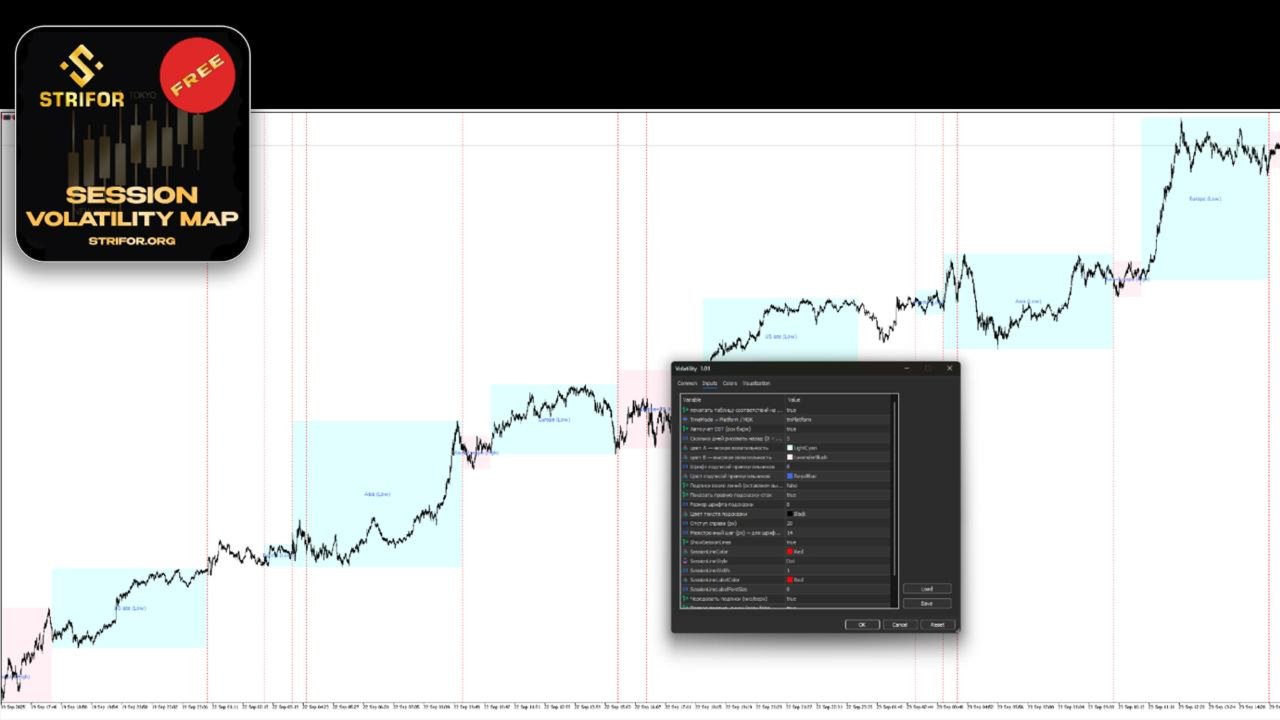
🔹 세션 경계와 교차 구간 자동 표시 — 높은 변동성이 발생하는 구간
🔹 각 세션 High–Low 범위 표시 — 지지/저항 확인
🔹 현재 활성 거래 세션 강조
🔹 서머타임/윈터타임 자동 반영 (유럽/미국)
유용한 대상
✔ 스캘퍼 — 변동성 높은 시점 확인
✔ 데이트레이더 — 조용한 시간대와 활발한 시간대 필터링
✔ 뉴스 트레이더 — 이벤트가 세션 어느 단계와 일치하는지 파악
⚡ Session Volatility Map으로 시장이 범위 내인지, 돌발 움직임 준비 중인지 항상 확인 가능
설정
-
Time model (Platform/MT4/MT5) — 시간 모델
-
Auto DST adjustment (market aware) — 서머타임 자동 조정
-
How many days to back (0 = today) — 표시할 일수
-
Color A — low volatility — 낮은 변동 색
-
Color B — high volatility — 교차 구간 색
-
Font size / color for rectangle labels — 범위 라벨 글꼴/색
-
Print extra labels (default: off) — 추가 라벨
-
Show right-side hint panel — 우측 활성 세션 패널
-
Font size / color for hint panel — 패널 글꼴/색
-
Right padding / Line spacing (px) — 패널 여백/간격
-
Draw vertical session lines — 세션 수직선
-
SessionLineColor / Style / Width — 선 색/스타일/너비
-
SessionLineLabelColor / FontSize — 선 라벨
-
Alternate label positions — 라벨 상하 교차
-
Put text label at bottom (false = top) — 라벨 위치 고정
-
Panel Font — 패널 글꼴


Instant installation, easy setup, useful for daily trading and scalping