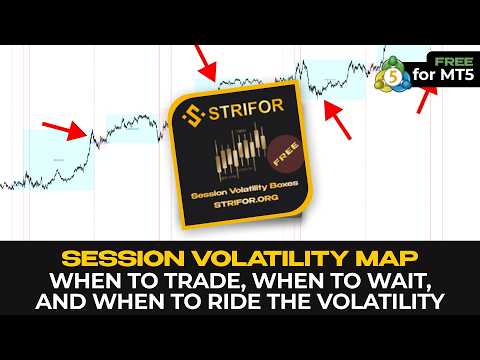
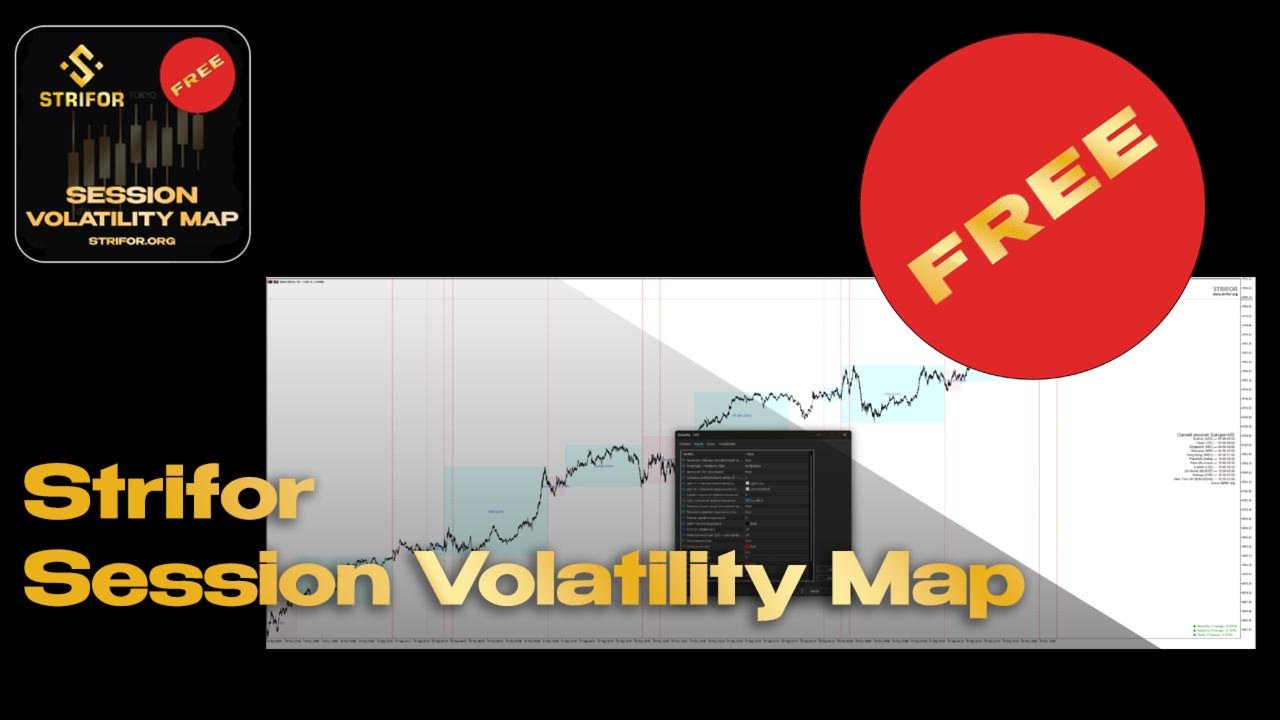
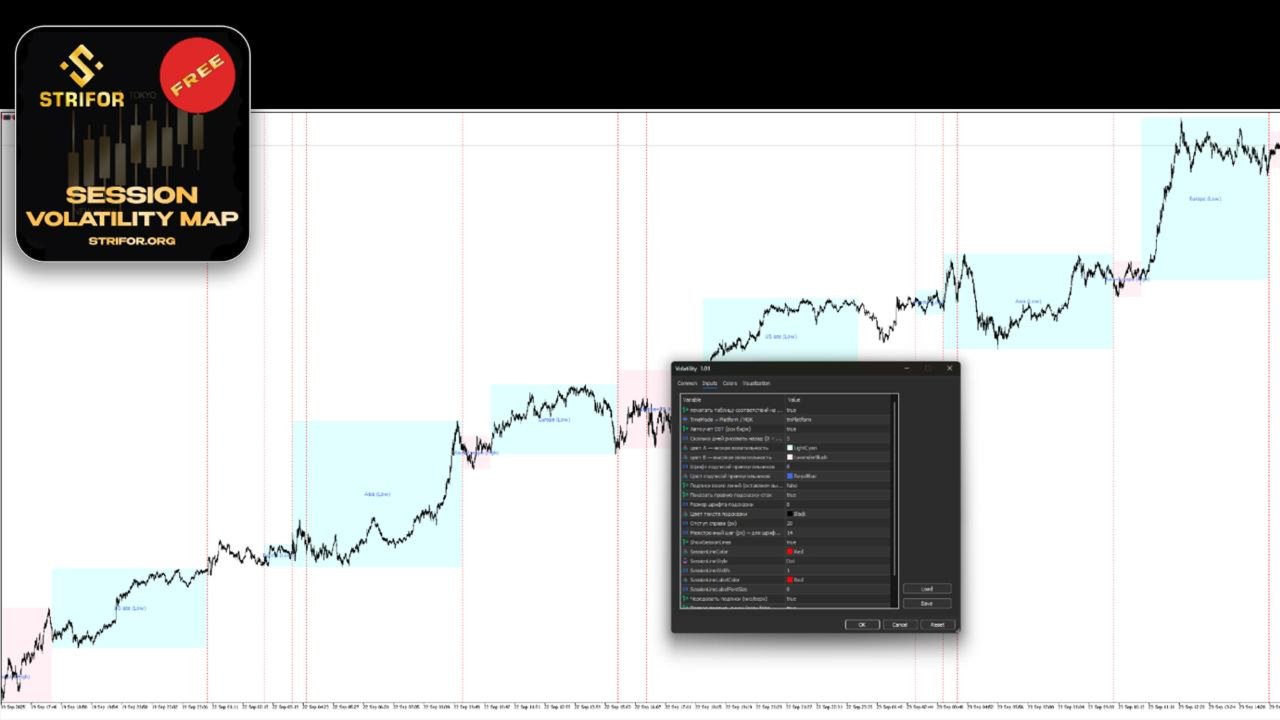
Session Volatility Map
- インディケータ
-
Strifor (Mauritius) Ltd
 Ltd") Welcome to Strifor!
Welcome to Strifor!
Our mission is to promote a culture of conscious trading in the financial markets. - バージョン: 2.3
- アップデート済み: 10 11月 2025
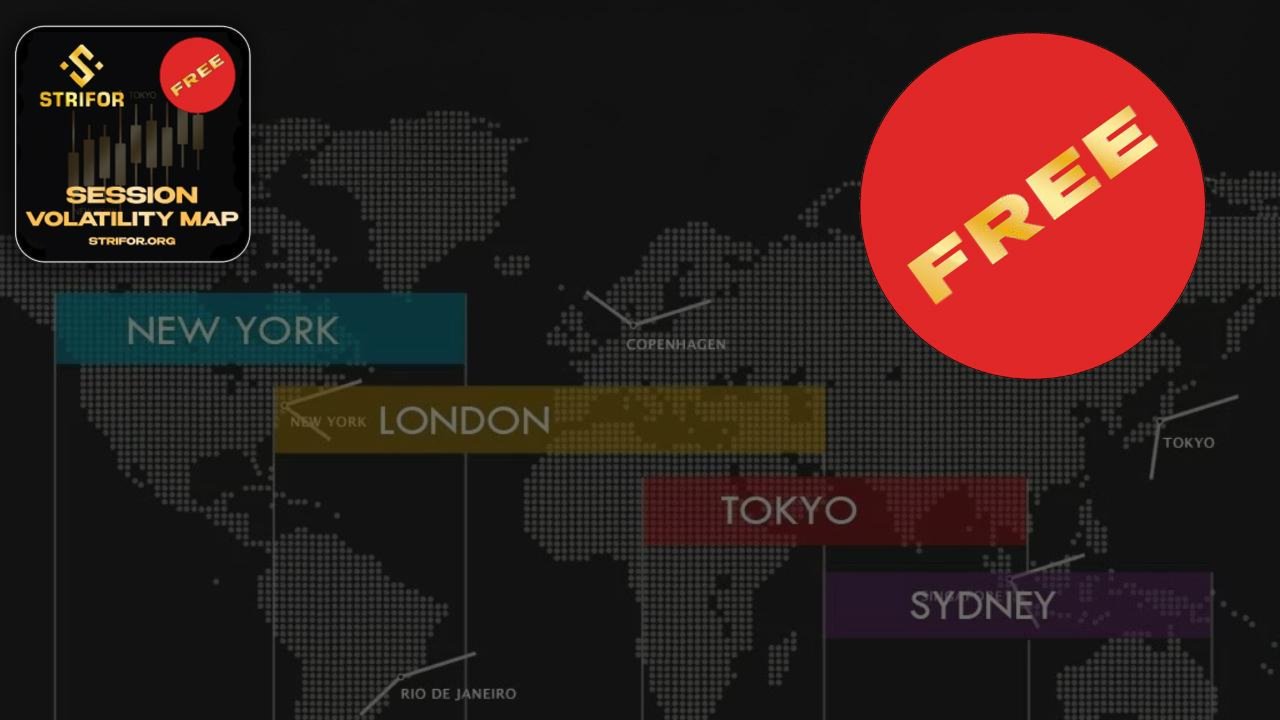
Session Volatility Map — グラフ上に主要な取引セッション(アジア、ヨーロッパ、米国)を表示するインジケーター。
🔹 セッションの境界と交差ゾーンを自動表示。これらのゾーンはボラティリティが高くなる傾向があります。
🔹 各セッションの High–Low 範囲を描画し、サポート・レジスタンスを判断するのに役立ちます。
🔹 現在アクティブな取引セッションをハイライト表示。
🔹 夏時間/冬時間(ヨーロッパ/米国)の自動調整。
対象ユーザー
✔ スキャルパー — ボラティリティの高いタイミングを探す
✔ デイトレーダー — 「静かな時間」と活発な時間をフィルタリング
✔ ニューストレーダー — イベントがセッションのどのフェーズで発生したか把握
⚡ Session Volatility Map で、市場がレンジ内か、インパルスに向けて準備中か常に確認可能。
設定
-
Time model (Platform/MT4/MT5) — 時間モデル選択
-
Auto DST adjustment (market aware) — サマータイム自動調整
-
How many days to back (0 = today) — 表示日数
-
Color A — low volatility — 低ボラティリティ色
-
Color B — high volatility — セッション交差ゾーン色
-
Font size / color for rectangle labels — 範囲ラベルフォント/色
-
Print extra labels (default: off) — 追加ラベル
-
Show right-side hint panel — 右側アクティブセッションパネル
-
Font size / color for hint panel — パネル文字サイズ/色
-
Right padding / Line spacing (px) — パネル間隔
-
Draw vertical session lines — セッション縦線表示
-
SessionLineColor / Style / Width — 線の色/スタイル/幅
-
SessionLineLabelColor / FontSize — 線ラベル色/サイズ
-
Alternate label positions — ラベル交互表示(上/下)
-
Put text label at bottom (false = top) — ラベル位置固定
-
Panel Font — パネルフォント


Instant installation, easy setup, useful for daily trading and scalping