Session Volatility Map
- Indicatori
-
Strifor (Mauritius) Ltd
 Ltd") Welcome to Strifor!
Welcome to Strifor!
Our mission is to promote a culture of conscious trading in the financial markets. - Versione: 2.3
- Aggiornato: 10 novembre 2025
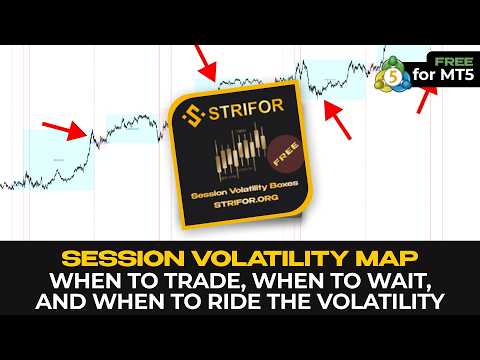
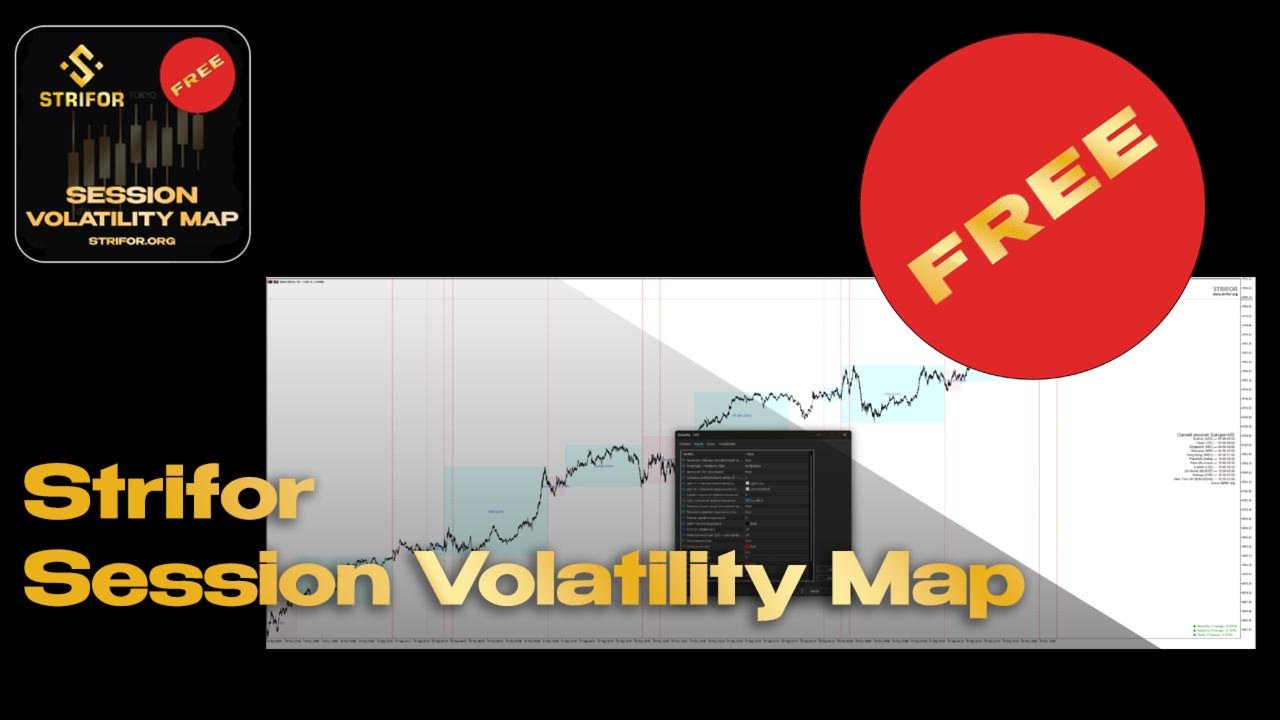
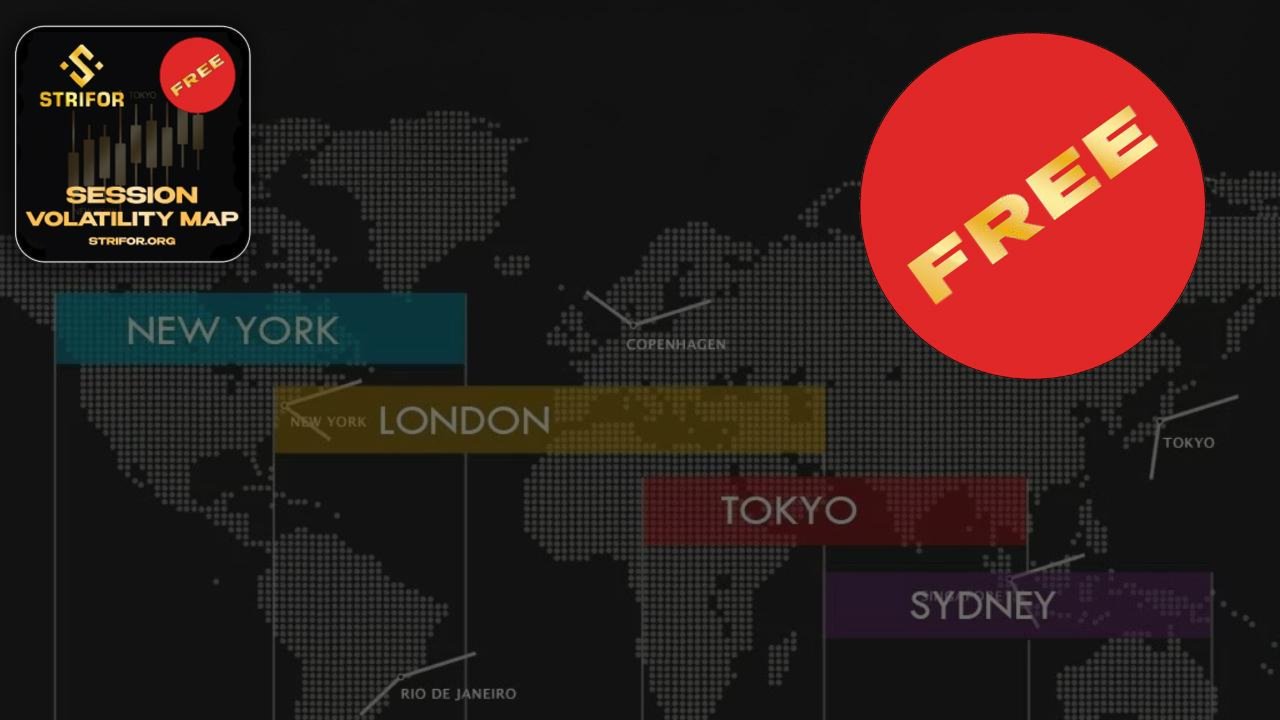
Session Volatility Map — indicatore che mostra le principali sessioni di trading (Asia, Europa, USA) direttamente sul grafico.
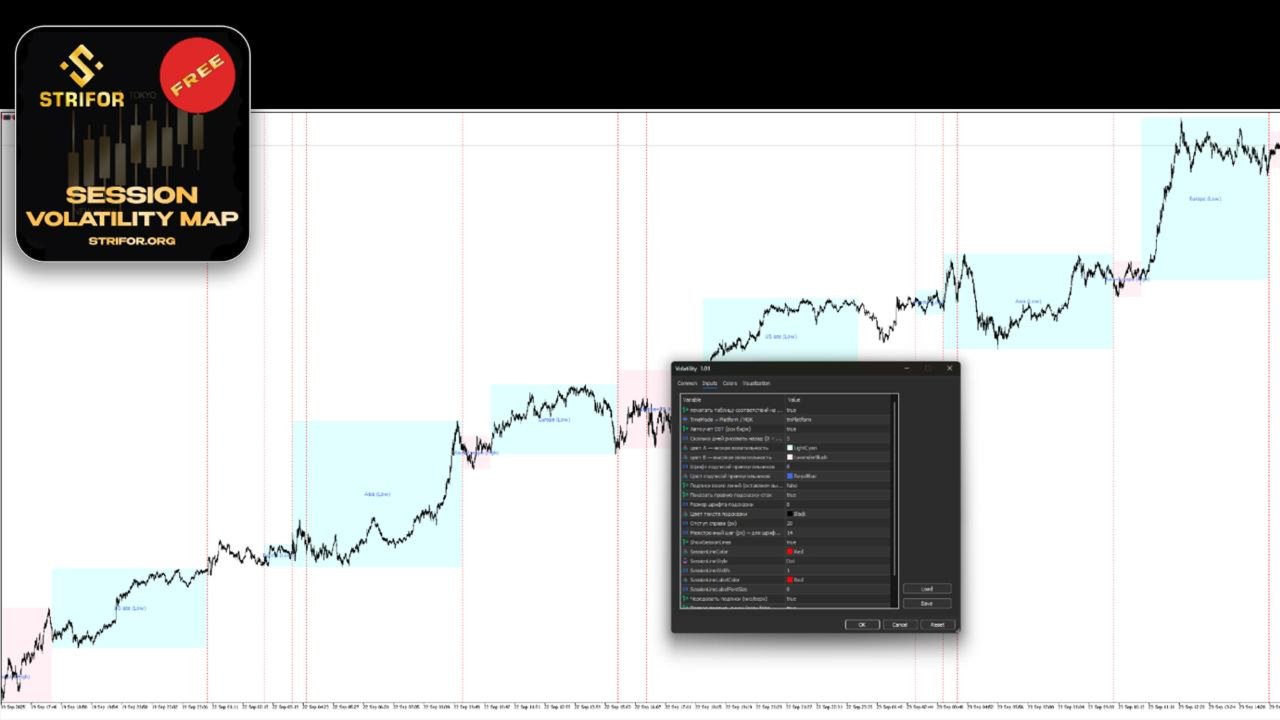
🔹 Mostra automaticamente i confini delle sessioni e le zone di intersezione, dove la volatilità è più alta.
🔹 Disegna il range High–Low di ogni sessione, utile per identificare supporti e resistenze.
🔹 Evidenzia la sessione attiva corrente.
🔹 Regola automaticamente l’ora legale/invernale (Europa/USA).
Utile per:
✔ Scalper — per individuare momenti di alta volatilità
✔ Trader intraday — filtrare periodi “tranquilli” e attivi
✔ Trader news — capire in quale fase della sessione avviene un evento
⚡ Con Session Volatility Map sai sempre: il mercato è in range o pronto a un movimento impulsivo.
Impostazioni
-
Time model (Platform/MT4/MT5) — modello orario
-
Auto DST adjustment (market aware) — regolazione automatica DST
-
How many days to back (0 = today) — giorni visualizzati
-
Color A — low volatility — colore bassa volatilità
-
Color B — high volatility — colore zone intersezione
-
Font size / color for rectangle labels — dimensione/colore etichette
-
Print extra labels (default: off) — etichette extra
-
Show right-side hint panel — pannello a destra
-
Font size / color for hint panel — font/colore pannello
-
Right padding / Line spacing (px) — spaziatura pannello
-
Draw vertical session lines — linee verticali sessione
-
SessionLineColor / Style / Width — colore/stile/larghezza linee
-
SessionLineLabelColor / FontSize — colore/dimensione etichette linee
-
Alternate label positions — alternanza etichette (sopra/sotto)
-
Put text label at bottom (false = top) — posizione fissa testo
-
Panel Font — font del pannello


Instant installation, easy setup, useful for daily trading and scalping