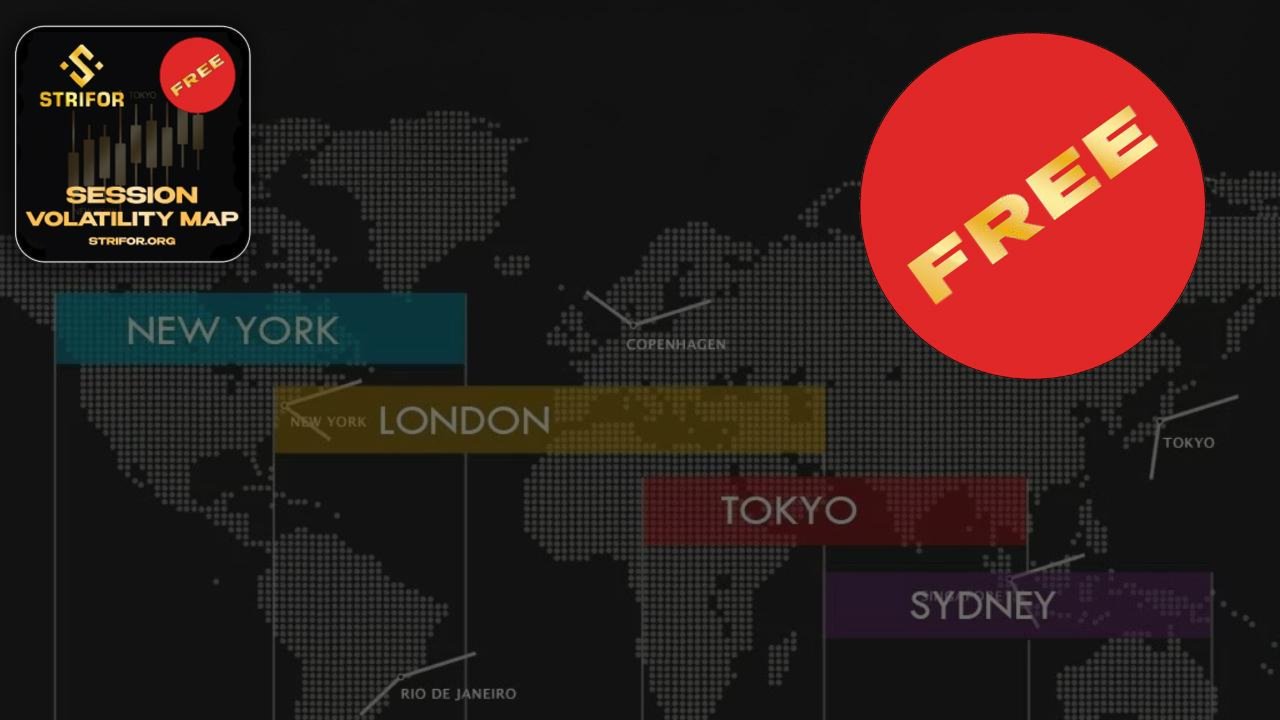
Session Volatility Map
- 指标
- 版本: 2.5
- 更新: 12 十月 2026

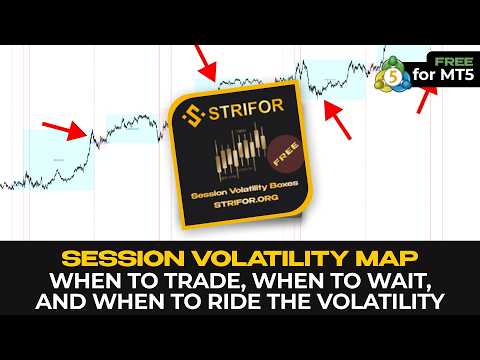
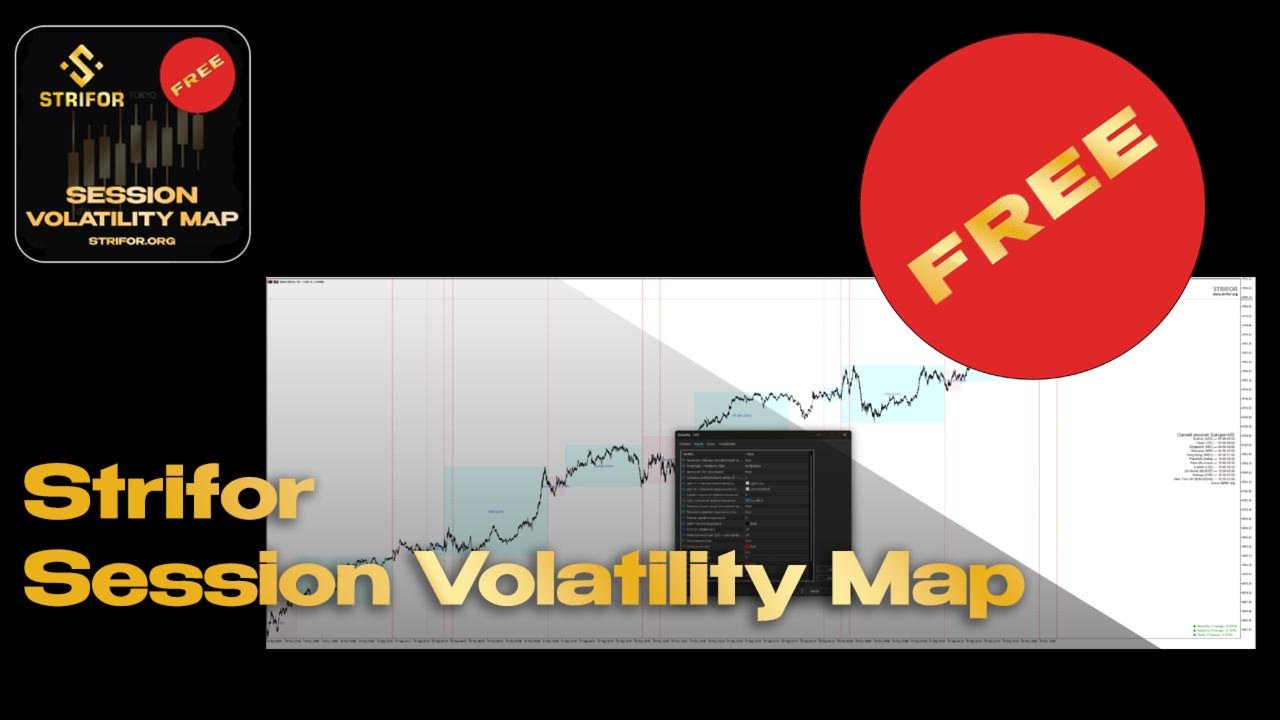
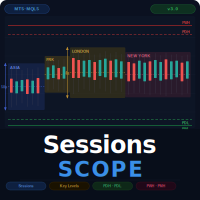
Session Volatility Map — 是一个在图表上显示主要交易时段(亚洲、欧洲、美国)的指标。
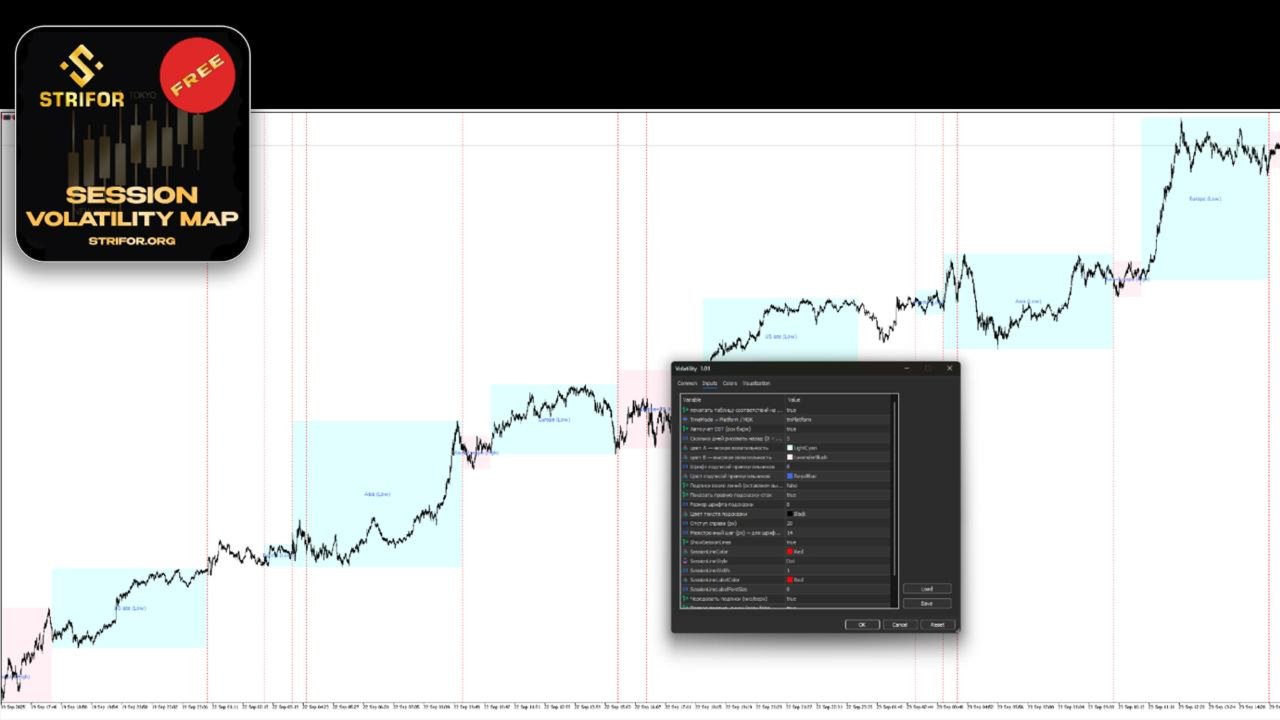
🔹 自动显示交易时段边界及其交汇区,这些区域通常波动性较高。
🔹 绘制每个时段的 High–Low 范围,帮助确定支撑和阻力位。
🔹 高亮显示当前活跃交易时段。
🔹 自动考虑夏令时/冬令时切换(欧洲/美国)。
适用人群
✔ 短线交易者 — 寻找高波动时段。
✔ 日内交易者 — 筛选“安静”和活跃时段。
✔ 新闻交易者 — 了解事件发生时对应的交易时段阶段。
⚡ 使用 Session Volatility Map,你总能知道:市场是在区间内,还是准备启动冲击性行情。
设置
-
Time model (Platform/MT4/MT5) — 时间模式选择
-
Auto DST adjustment (market aware) — 自动夏令时调整
-
How many days to back (0 = today) — 显示天数
-
Color A — low volatility — 低波动颜色
-
Color B — high volatility — 高波动颜色
-
Font size / color for rectangle labels — 范围标签字体和颜色
-
Print extra labels (default: off) — 额外标签
-
Show right-side hint panel — 右侧活跃时段面板
-
Font size / color for hint panel — 面板文字设置
-
Right padding / Line spacing (px) — 面板间距
-
Draw vertical session lines — 画竖直时段线
-
SessionLineColor / Style / Width — 线条颜色/样式/宽度
-
SessionLineLabelColor / FontSize — 线条标签颜色/大小
-
Alternate label positions — 标签交替显示(上/下)
-
Put text label at bottom (false = top) — 标签固定位置
-
Panel Font — 面板字体选择





















































Instant installation, easy setup, useful for daily trading and scalping