Visual Momentum Wave Indicator
- Indicators
-
AL MOOSAWI ABDULLAH JAFFER BAQER
 To trade successfully we need to go through the proven path that others had gone and reached!
Here are 17 quotes from such successful investors:
1- Limit your size in any position so that fear does not become the prevailing instinct guiding your judgment.
Joe Vidich - Version: 1.0
- Activations: 5
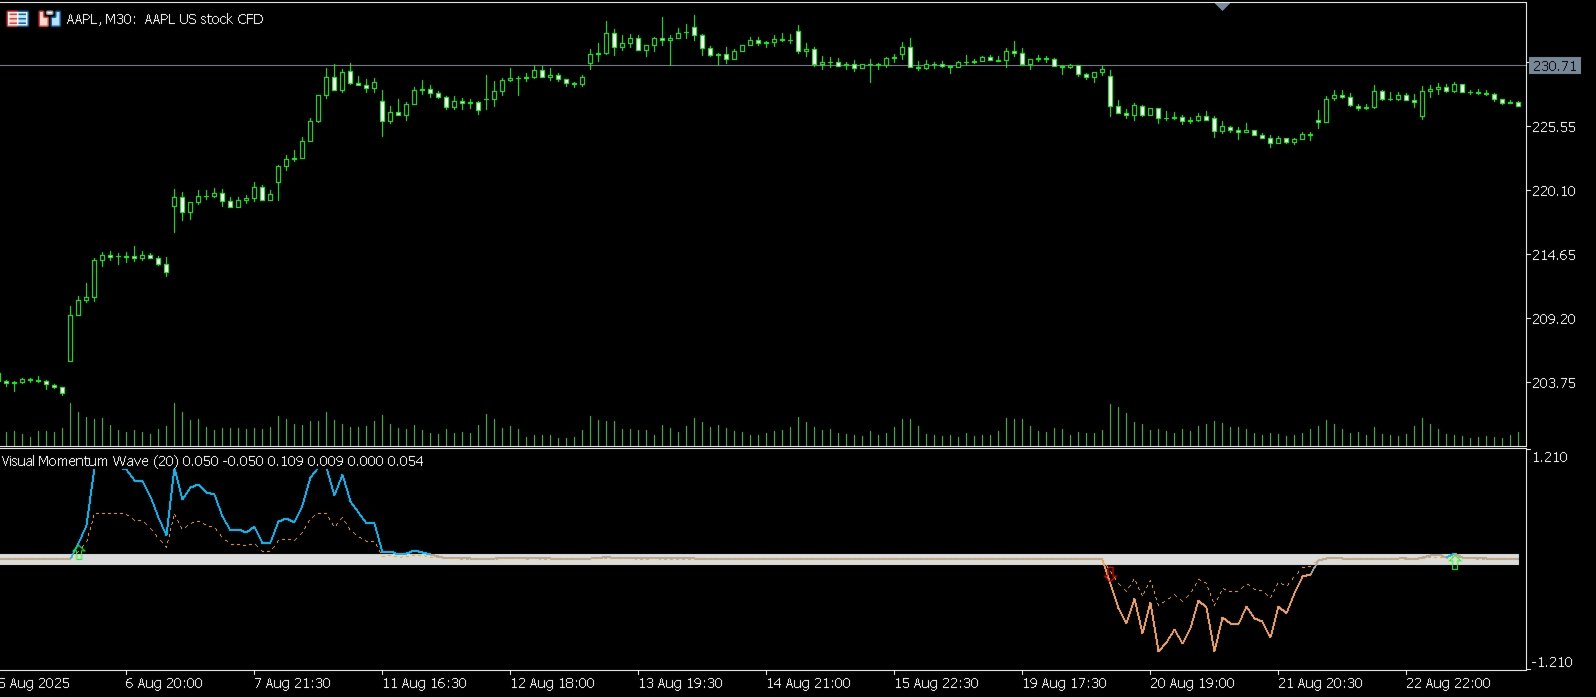
Visual Momentum Wave Indicator: Ride the True Market Force
Unlock the market's underlying momentum and trade with newfound confidence for just $30!
Are you tired of indicators that lag behind the price or generate false signals in choppy markets? The Visual Momentum Wave Indicator is a next-generation tool meticulously engineered to solve this problem. It moves beyond simple price averaging to measure the true force and acceleration behind market trends, giving you a clear, actionable view of potential entry and exit points.
Unlike standard momentum oscillators, this indicator uses a unique, proprietary algorithm to identify when momentum is not just present, but rapidly accelerating. This allows you to get in on moves early and avoid the frustrating sideways markets where most traders lose money.
The Logic Behind the Edge
The power of the Visual Momentum Wave Indicator lies in its sophisticated, multi-step calculation process designed to filter out market noise and pinpoint genuine trading opportunities.
-
Advanced Double Smoothing: The indicator starts by applying a double-smoothed moving average to the price data. This advanced filtering technique is far superior to a standard moving average, as it significantly reduces lag and prevents the false signals commonly seen during periods of low volatility.
-
Core Momentum Calculation: It then calculates the rate of change (impetus) of both the primary and the smoothed moving averages. This gives us a raw, unfiltered look at the market's speed.
-
The "Trend Direction Force" (TDF) Engine: This is the secret to the indicator's effectiveness. The TDF is a unique formula that measures the divergence between the two moving averages and multiplies it by the cubed power of the average momentum. By cubing the momentum, the indicator exponentially amplifies periods of strong, decisive price action while effectively ignoring insignificant market chatter. The result is a crystal-clear wave that rises and falls with the market's most powerful moves.
-
Adaptive Normalization: Finally, the TDF value is normalized against its own recent history. This makes the indicator incredibly versatile, as it automatically adapts to any instrument or timeframe, from scalping on the 1-minute chart to swing trading on the daily.
Key Features
-
High-Clarity Visual Interface: The indicator plots a smooth, colored wave that makes it effortless to see the market's state. Deep Sky Blue signifies building bullish momentum, Sandy Brown indicates growing bearish momentum, and Dark Gray shows a neutral or weak trend.
-
Clear Buy & Sell Arrow Signals: Non-repainting arrows appear on your chart the moment the momentum wave crosses user-defined trigger levels, providing unambiguous entry signals.
-
"No-Trend Zone" Filling: A shaded area between the trigger levels visually represents a choppy or trendless market, helping you stay out and protect your capital.
-
Built-in Signal Cooldown: To prevent over-trading, you can enable a "Bars Delay" feature, which ensures a minimum number of bars must pass before a new signal can be generated.
-
Fully Customizable: Take full control of your analysis. Adjust the momentum period, trigger levels, colors, arrow sizes, and signal frequency to perfectly match your trading style and strategy.
-
Confirmation Line: An optional, faster-moving dotted line can be enabled to provide early warnings of a potential shift in momentum.
-
Professional Logging: For advanced strategy builders and testers, the indicator includes a comprehensive logging system to track signal generation and performance.
Whether you are a day trader looking for precise entries or a swing trader aiming to capture the bulk of a major trend, the Visual Momentum Wave Indicator provides the edge you need to trade proactively, not reactively.
Invest in a smarter way to trade. Get your copy of the Visual Momentum Wave Indicator today!
Indicator Input Parameters
-
Momentum Period: The main lookback period for the core calculation.
-
Trigger Up/Down Level: The threshold values the momentum wave must cross to generate a signal.
-
Enable Bars Between Signals: True/False to activate the signal cooldown period.
-
Bars to Wait Between Signals: The number of bars to wait before a new signal is allowed.
-
Show Signal Arrows: True/False to display the buy and sell arrows on the chart.
-
Show Confirmation Line: True/False to display the secondary momentum line.
-
Full Visual Customization: Control the colors, sizes, and offsets for all lines and arrows.
-
Logging Controls: Enable or disable detailed logging for performance tracking.