KT SMC Indicator MT5
- Indicators
-
KEENBASE SOFTWARE SOLUTIONS
 Welcome to Keenbase Trading,
📢 Join our Telegram for real-time updates & algo trading tips: https://t.me/keenbasetrading - Version: 1.0
- Activations: 10
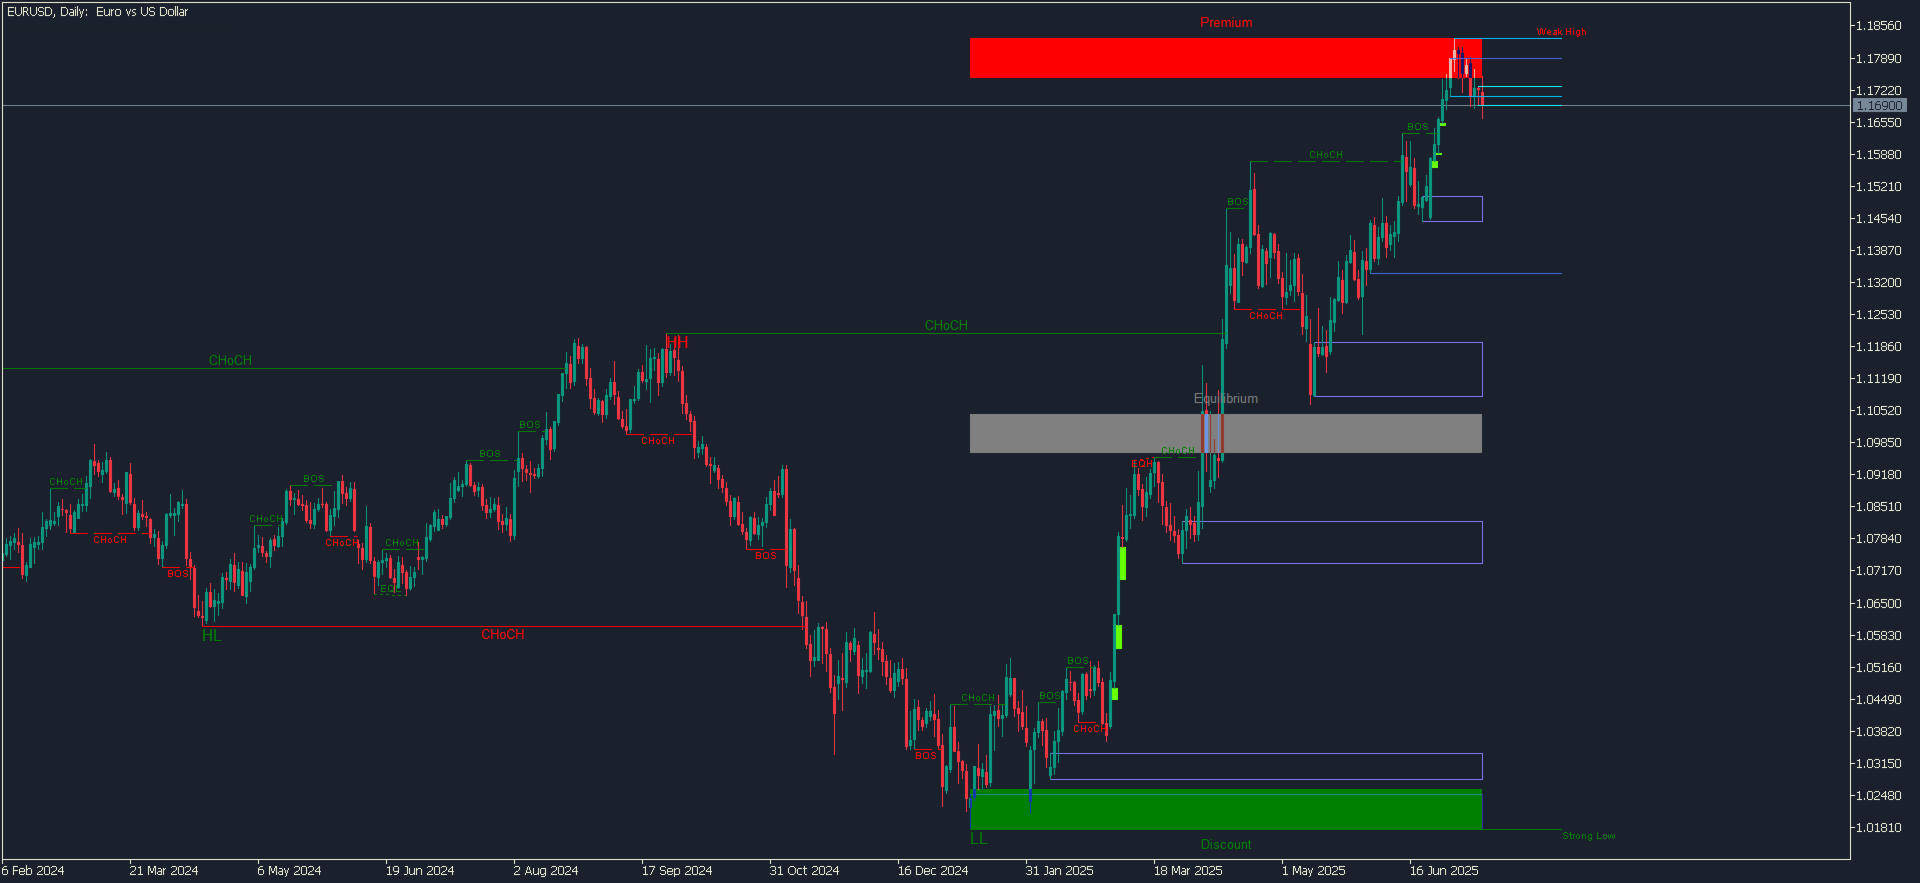
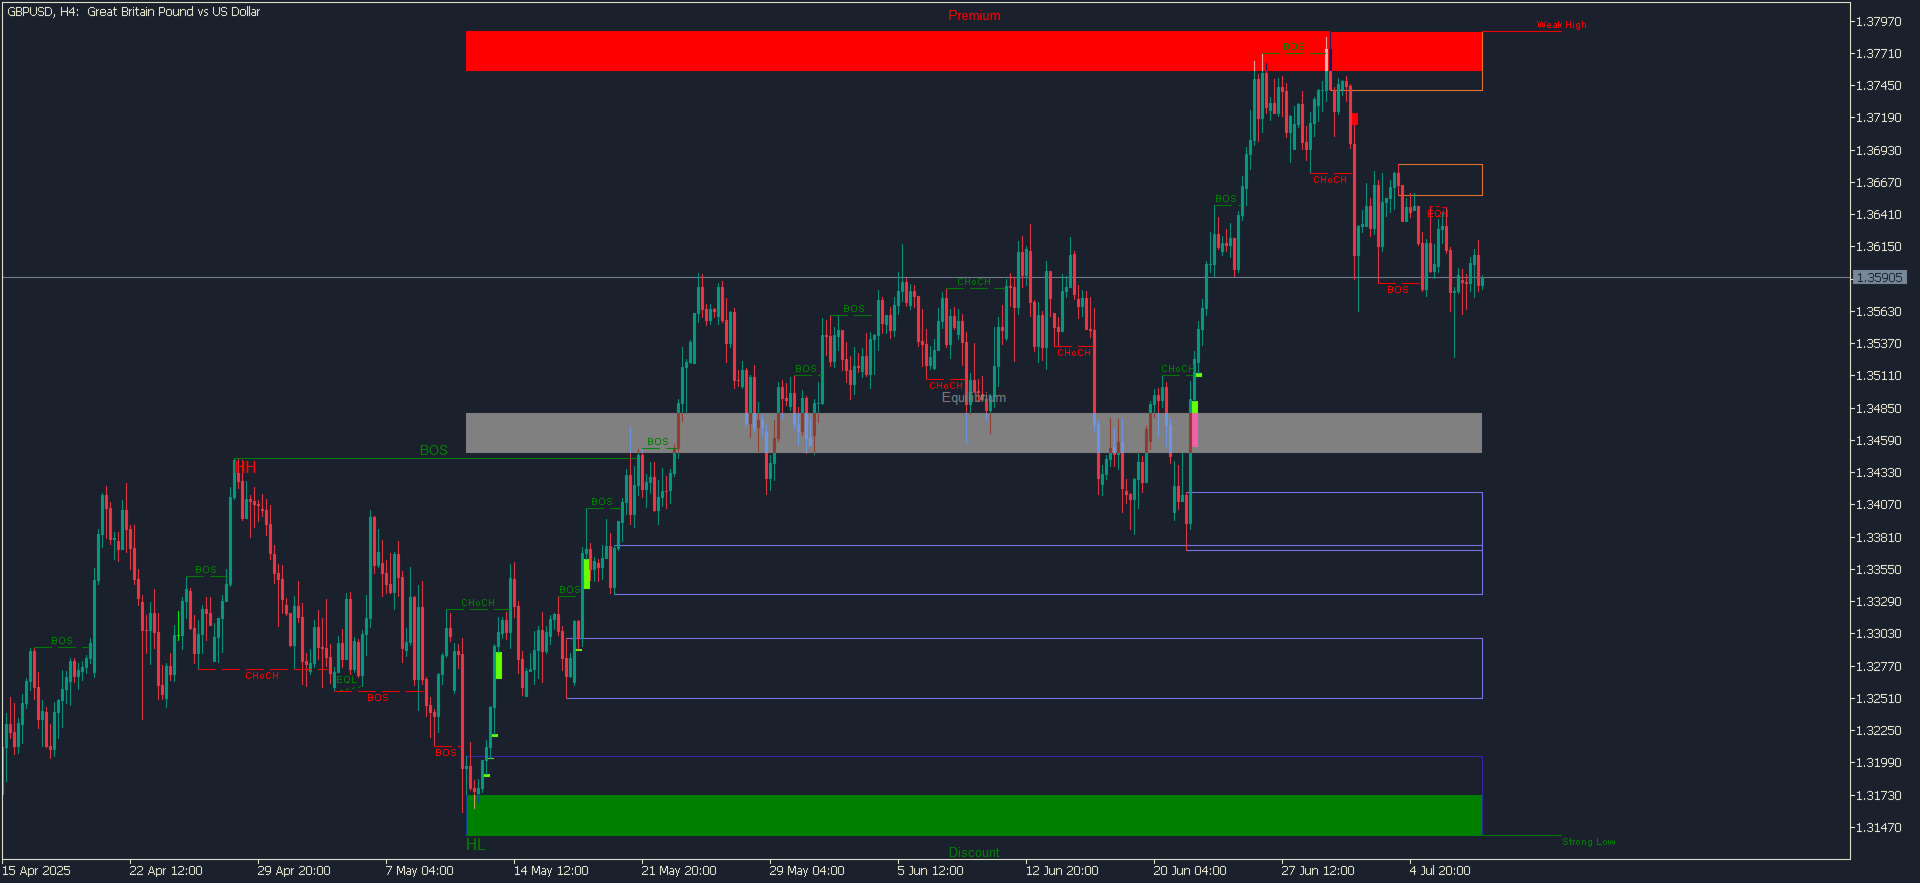
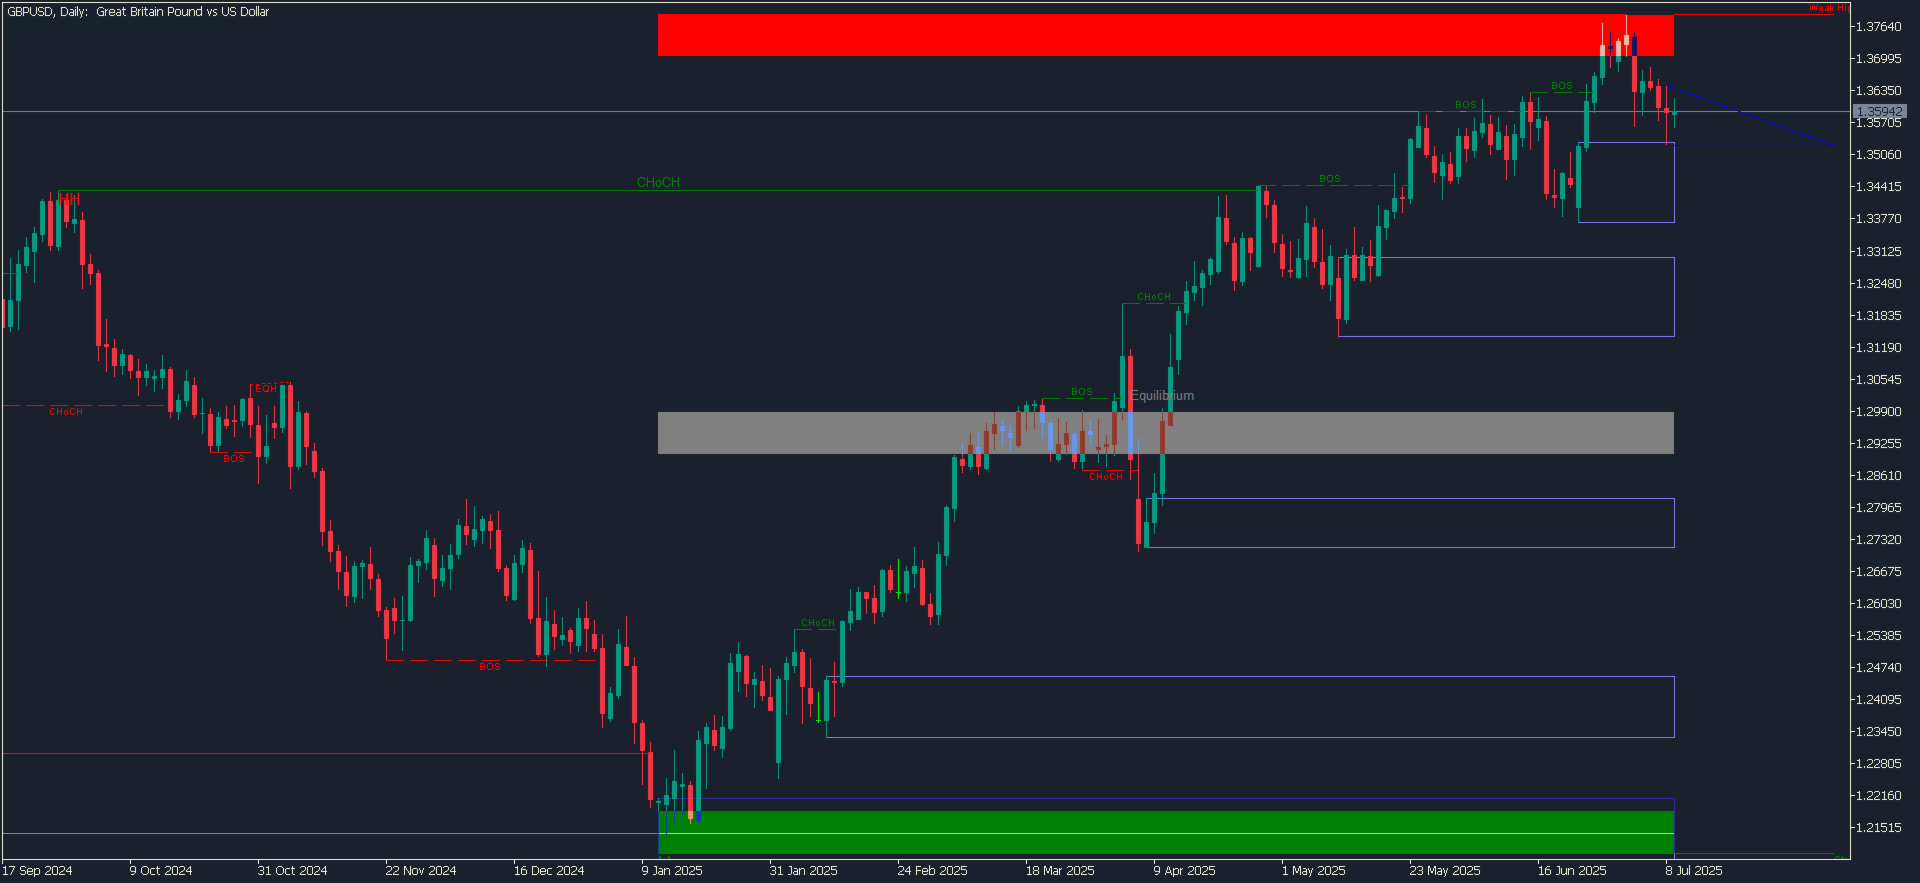
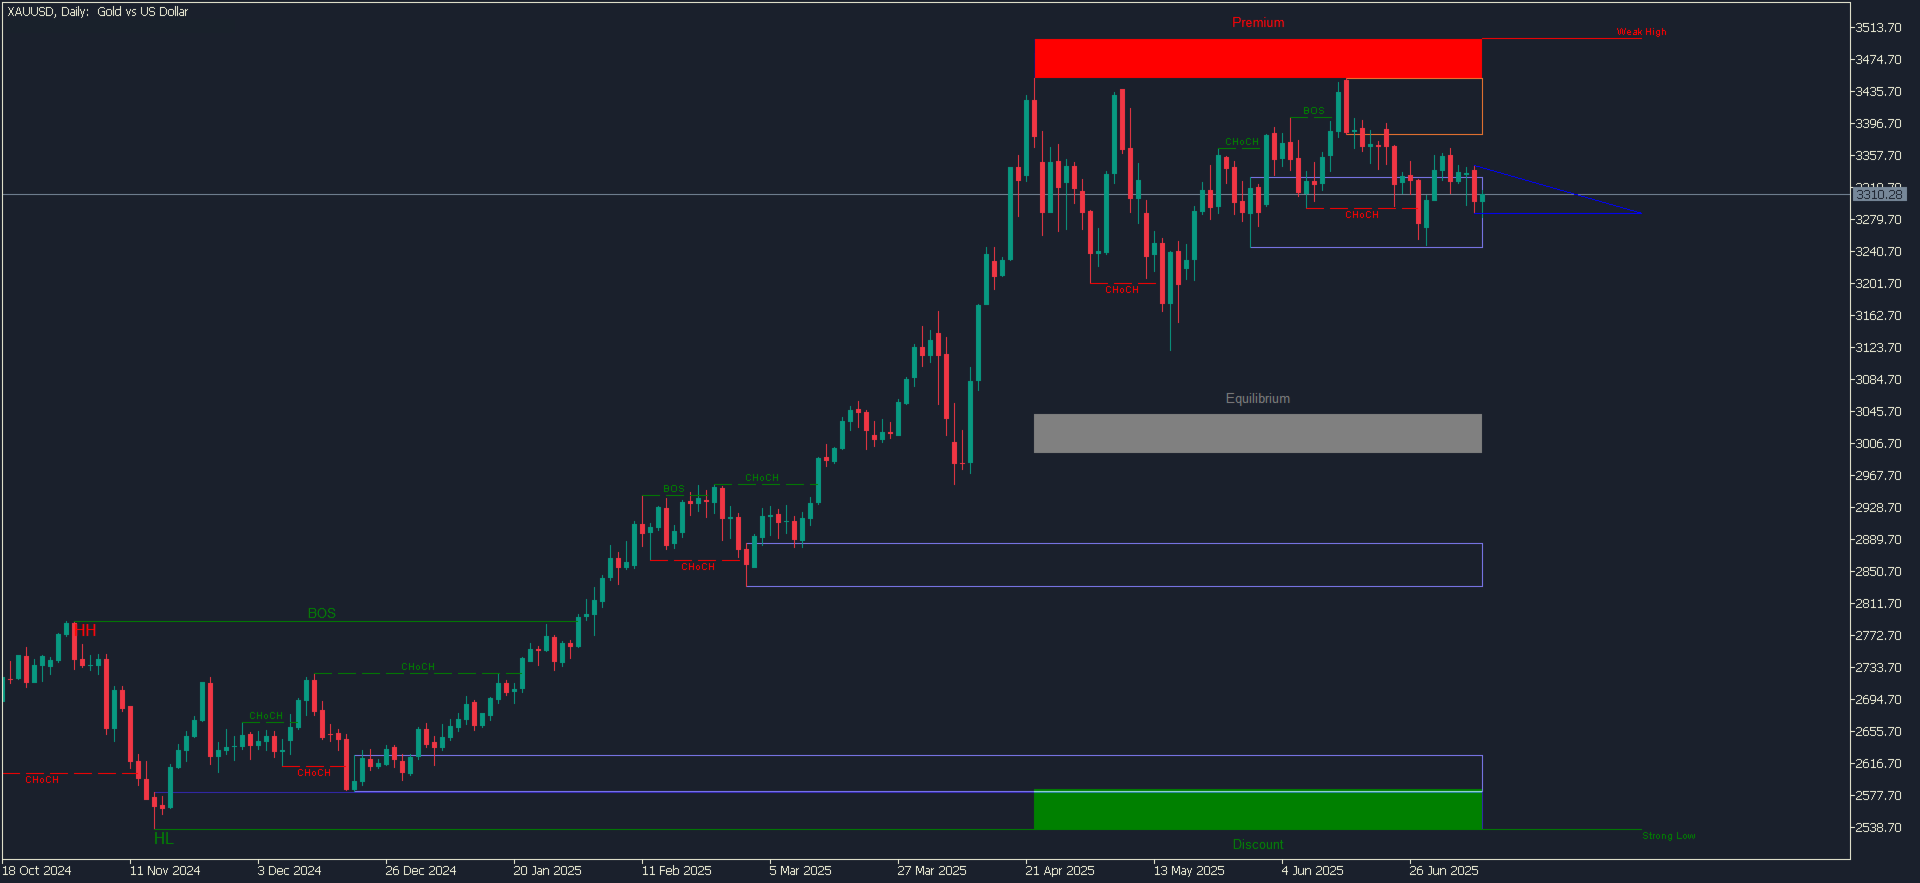
Smart Money Concepts focuses on spotting where large players leave buy-side or sell-side liquidity. By tracking those pools, traders can pinpoint clearer entry and exit zones instead of guessing at random support and resistance.
Features
- Highlights only the core SMC elements: BOS, CHoCH, order blocks, FVGs, equal highs/lows, so the chart stays clean and readable.
- Adds Premium-Discount zones and higher-time-frame levels from daily, weekly and monthly highs and lows, while still keeping the chart tidy.
- Auto-marks every structure shift, liquidity zone and HTF level, so you can read the SMC story in seconds instead of drawing lines by hand.
- Lets you fine-tune every overlay to change line width, box style and colours for BOS, CHoCH, order blocks, FVGs and zones, to match your personal chart theme.
- Sends every alert type Metatrader offers like pop-up, push, sound and email, whenever a BOS, CHoCH, order block break or FVG forms, so you never miss a setup.
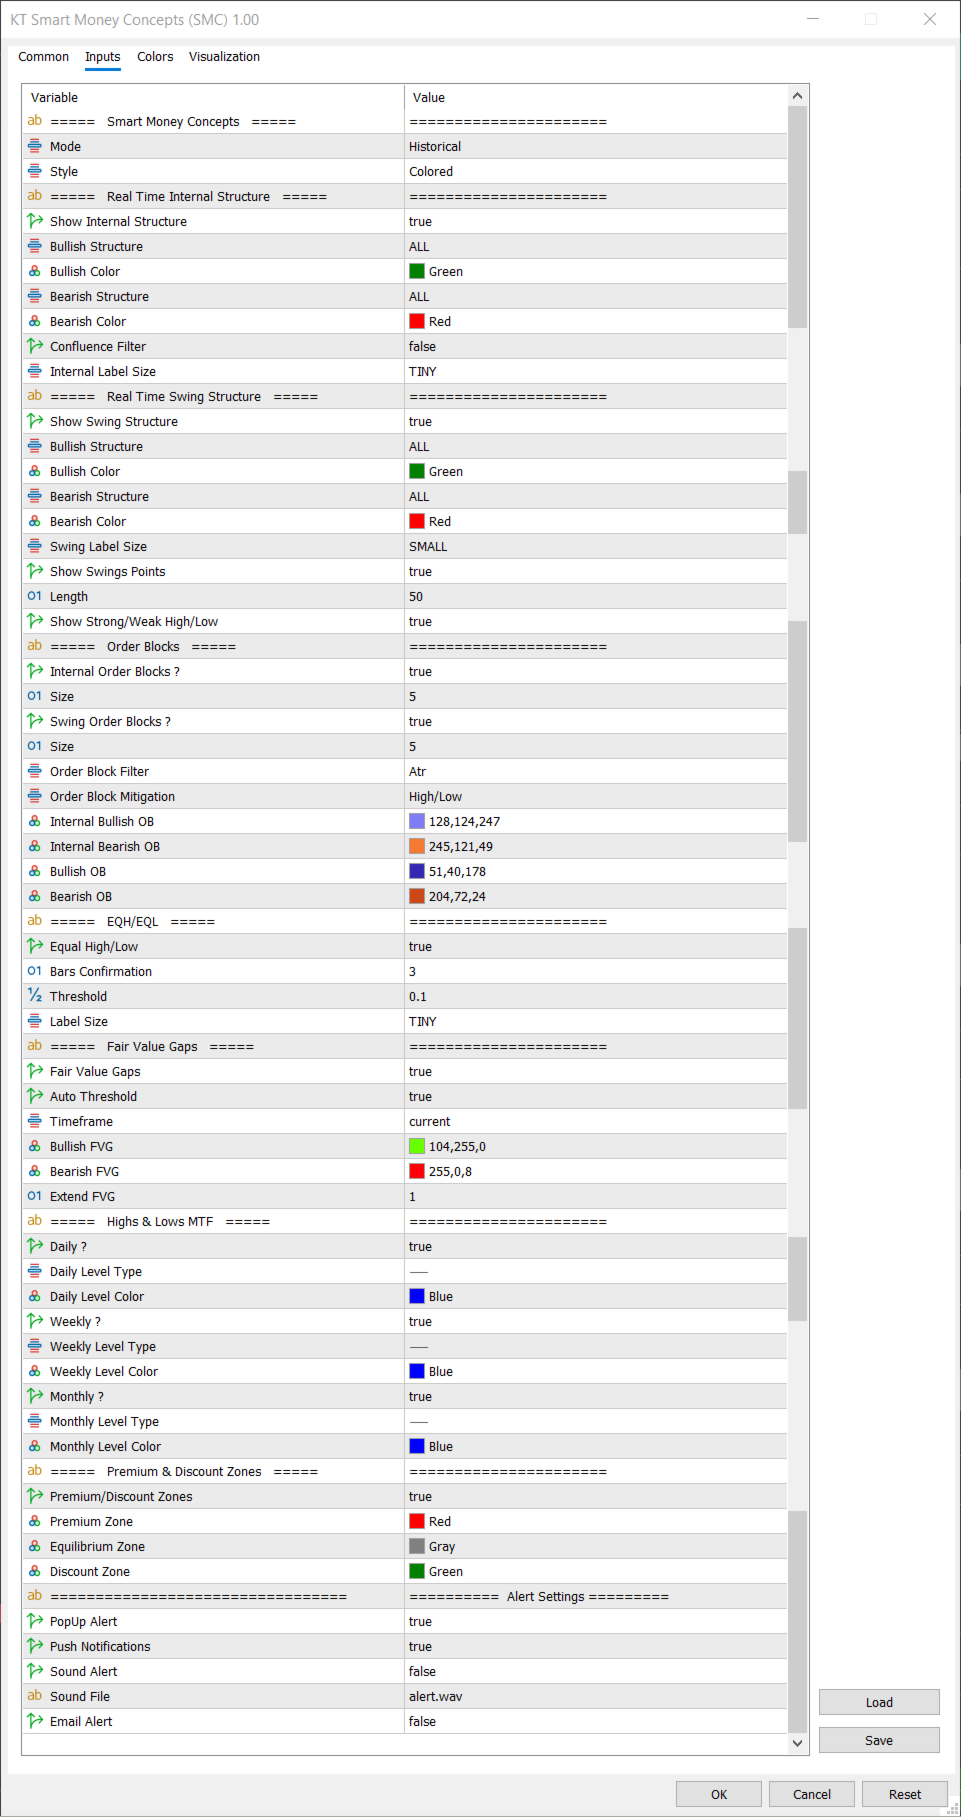
Input Settings
- Mode – Historical: keep every past structure on the chart; Present: show only the latest active structures.
- Style – Colored: displays structures in their full colour scheme; Monochrome: uses a neutral grey palette for a minimalist look.
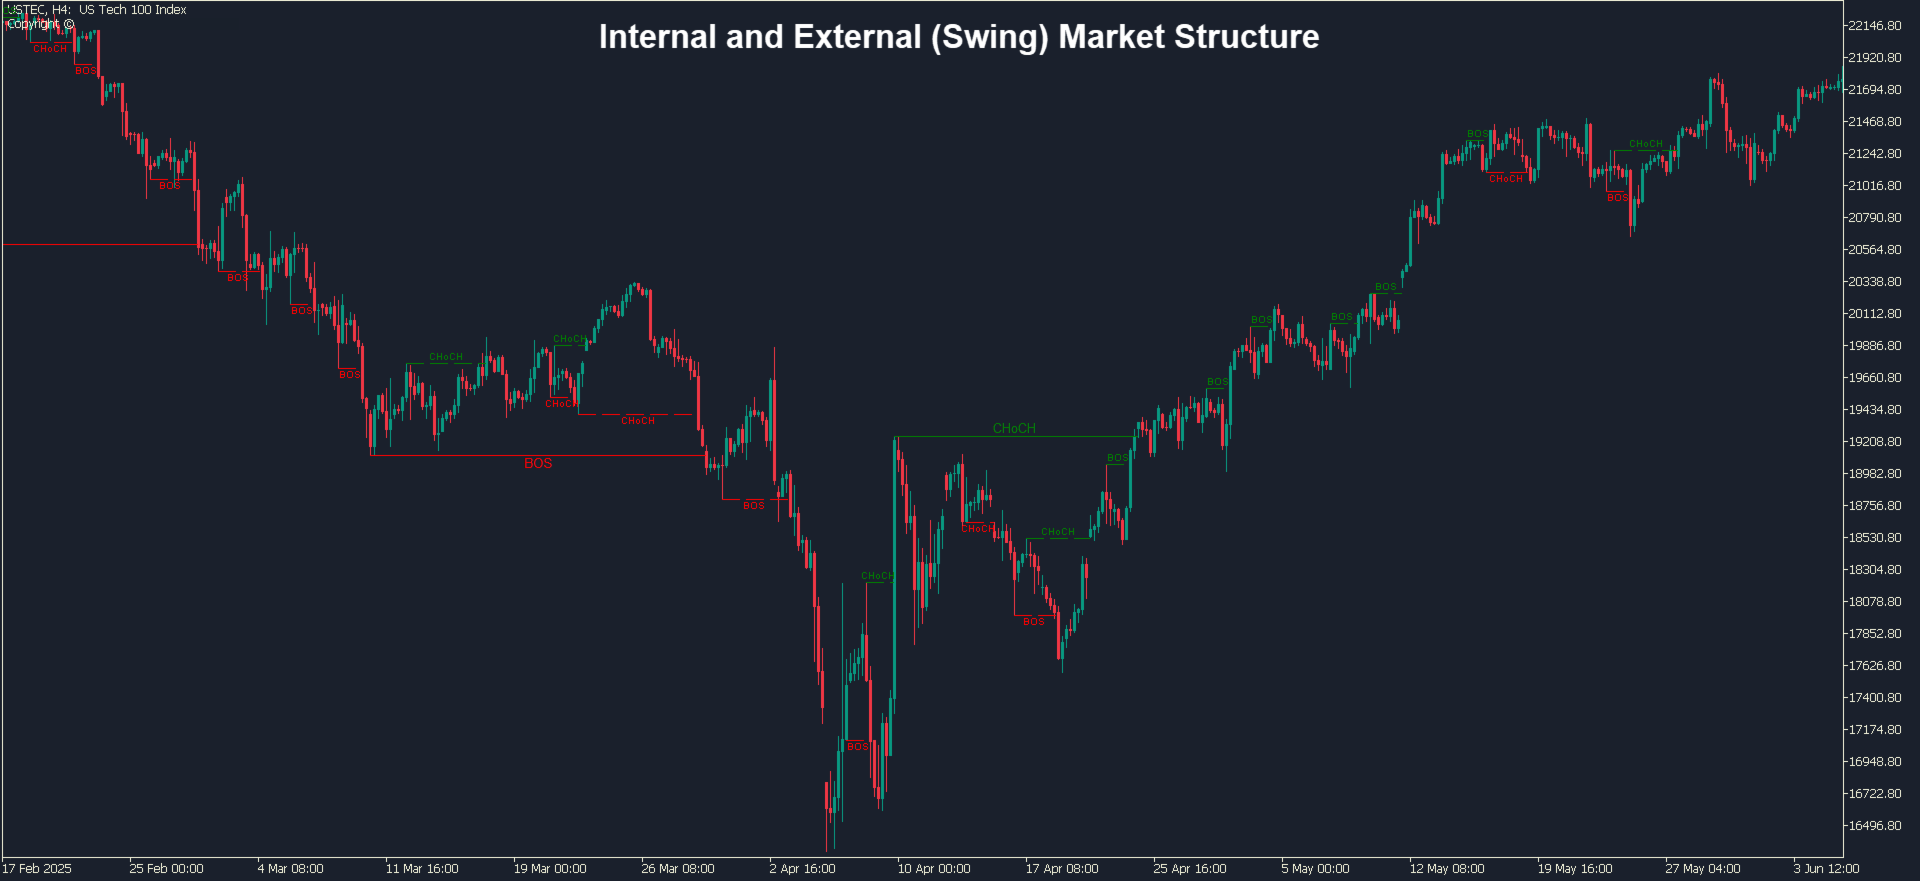
- Show Internal Structure – On: plots real-time internal BOS/CHoCH levels; Off: hides all internal-structure markings.
- Internal Structure Filter (Bull & Bear) – For each side, pick which internal events to plot: All, BOS only, or CHoCH only.
- Internal Confluence Filter – When enabled, ignores weak internal breakouts and keeps only high-probability BOS/CHoCH signals.
- Show Swing Structure – On: displays swing-level BOS/CHoCH; Off: hides all swing-structure markings.
- Swing Structure Filter (Bull & Bear) – Decide which swing events appear: All, BOS only, or CHoCH only.
- Show Swings Points – On: labels HH, HL, LH, LL at each identified swing; Off: omits these swing-point tags.
- Swings Length – Sets how many bars back the indicator looks to confirm each swing high or low.
- Show Strong/Weak High / Low – On: tags the latest strong or weak swing extremes; Off: hides these markers.
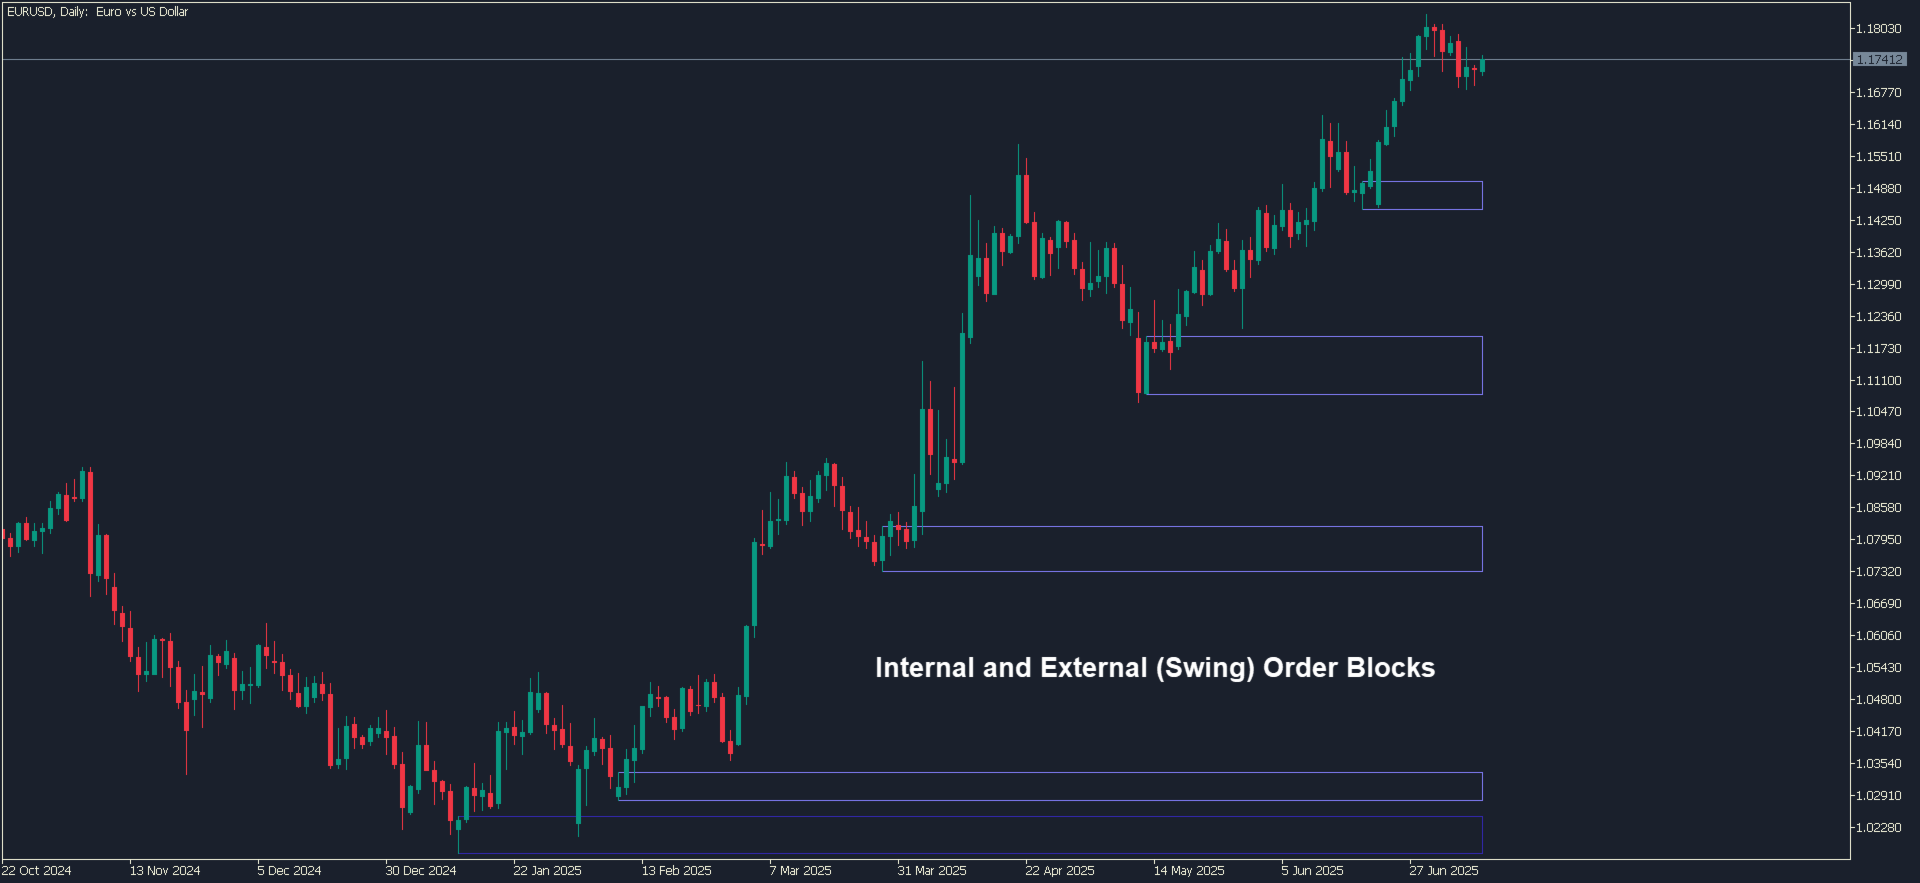
- Show Internal Order Blocks – On: draws internal order-block zones (up to the set count); Off: hides internal OBs.
- Show Swing Order Blocks – On: draws swing-level order-block zones (up to the defined count); Off: hides swing OBs.
- Order Block Filter – Choose ATR or Cumulative-Mean Range to filter out low-quality order blocks.
- Order Block Mitigation Source – Decide how an OB is considered “mitigated”: use High/Low touches or Close-price touches.
- Show Equal Highs & Lows – On: marks EQH/EQL zones; Off: disables equal-high/low detection.
- Equal High/Low Bars Confirmation – Number of bars that must sit between the twin highs or lows for them to count as an EQH/EQL.
- Equal High/Low Threshold – Sets the price-gap tolerance (0–1) used to decide if two swing points are truly equal.
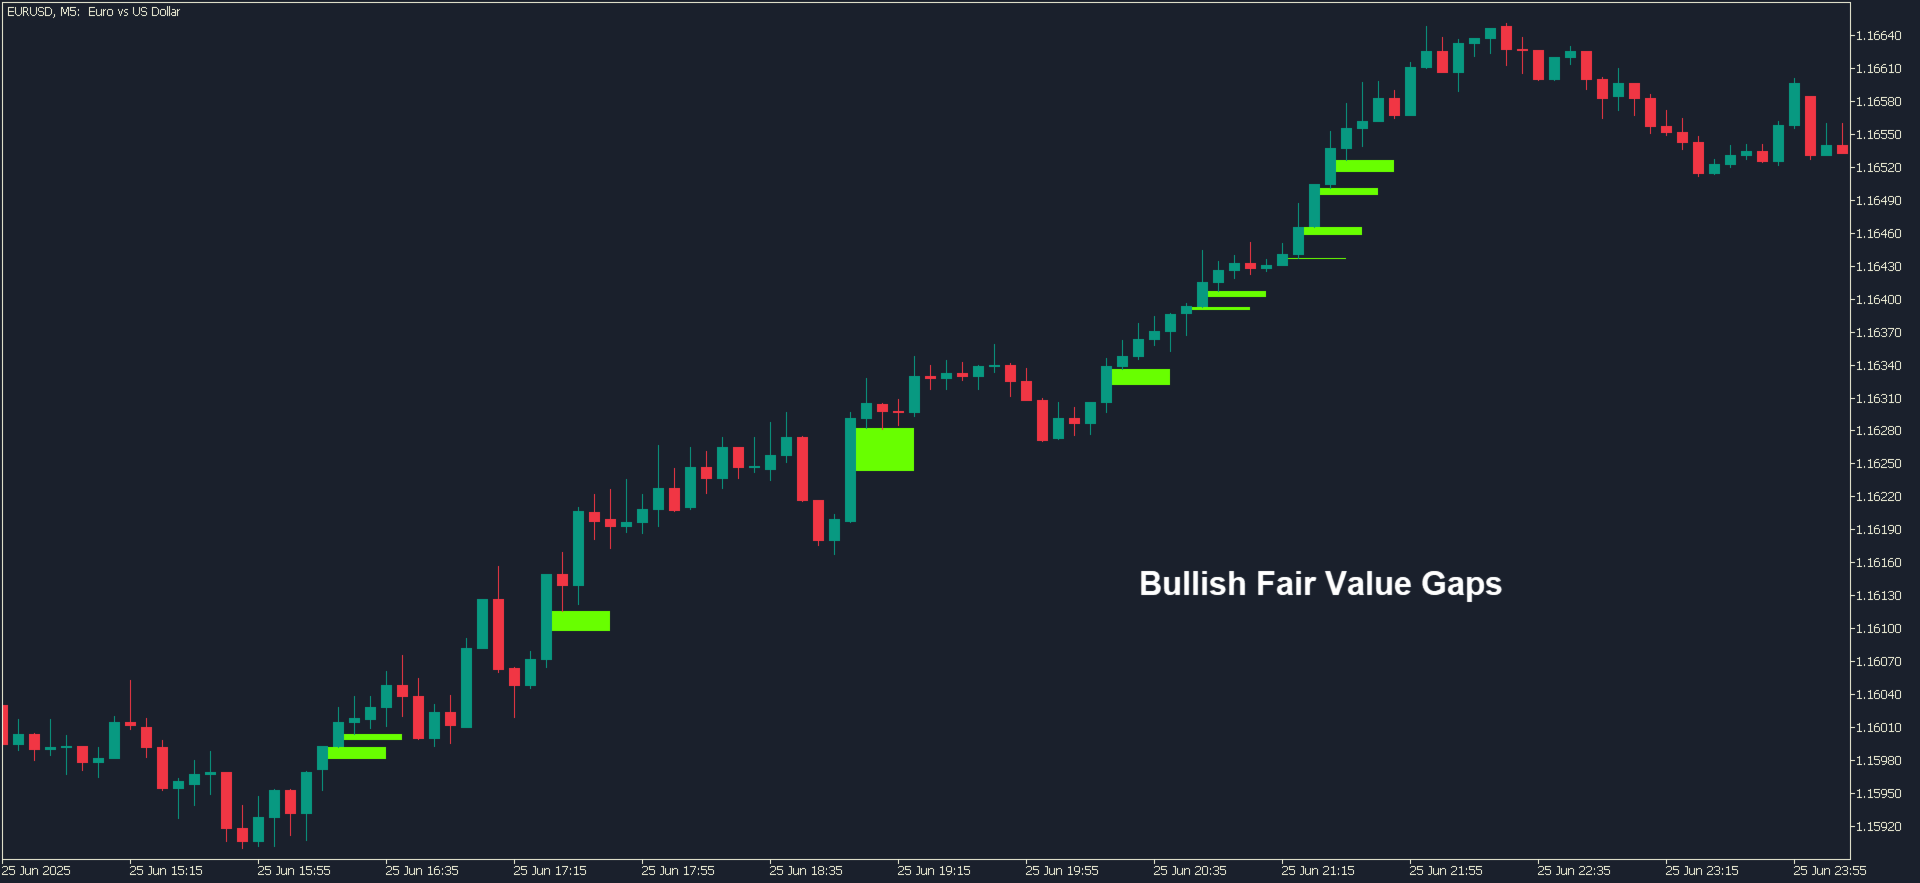
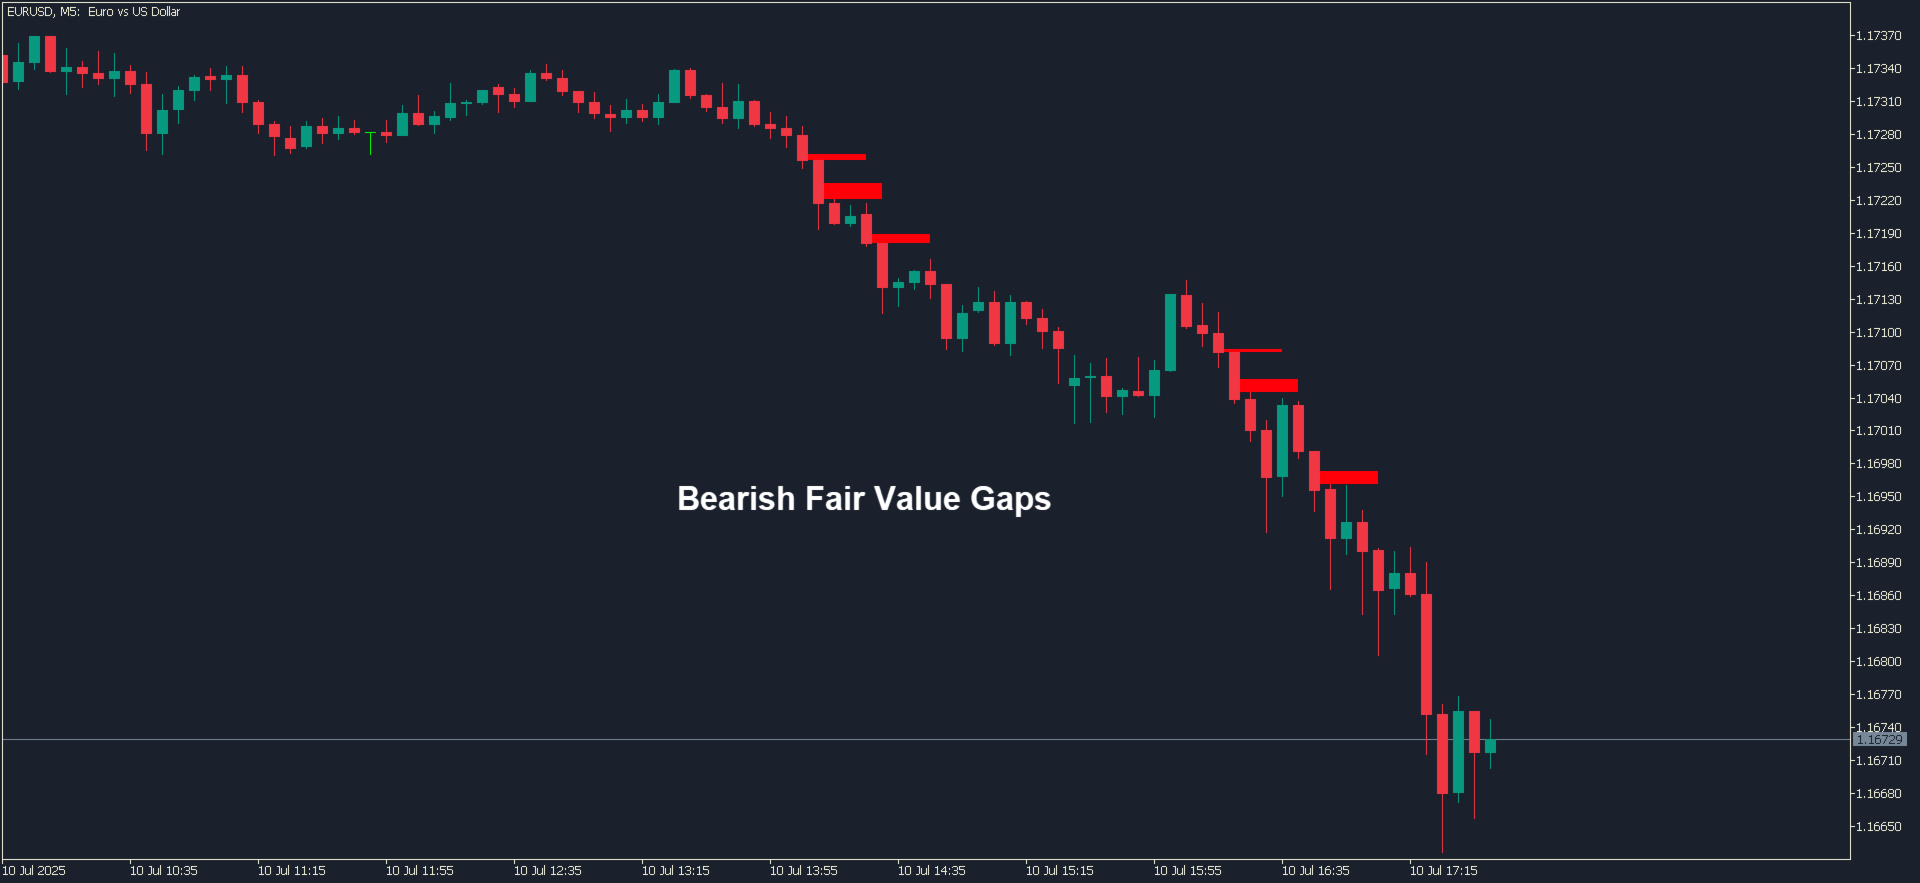
- Show Fair Value Gaps – On: highlights bullish and bearish FVG boxes; Off: hides all FVG markings.
- FVG Auto-Threshold – On: lets the indicator auto-adjust gap sensitivity; Off: uses a fixed tolerance.
- FVG Timeframe – Select which higher-time-frame candle the indicator uses to search for fair-value gaps.
- FVG Extend Bars – Defines how many future bars each Fair-Value-Gap box is projected across.
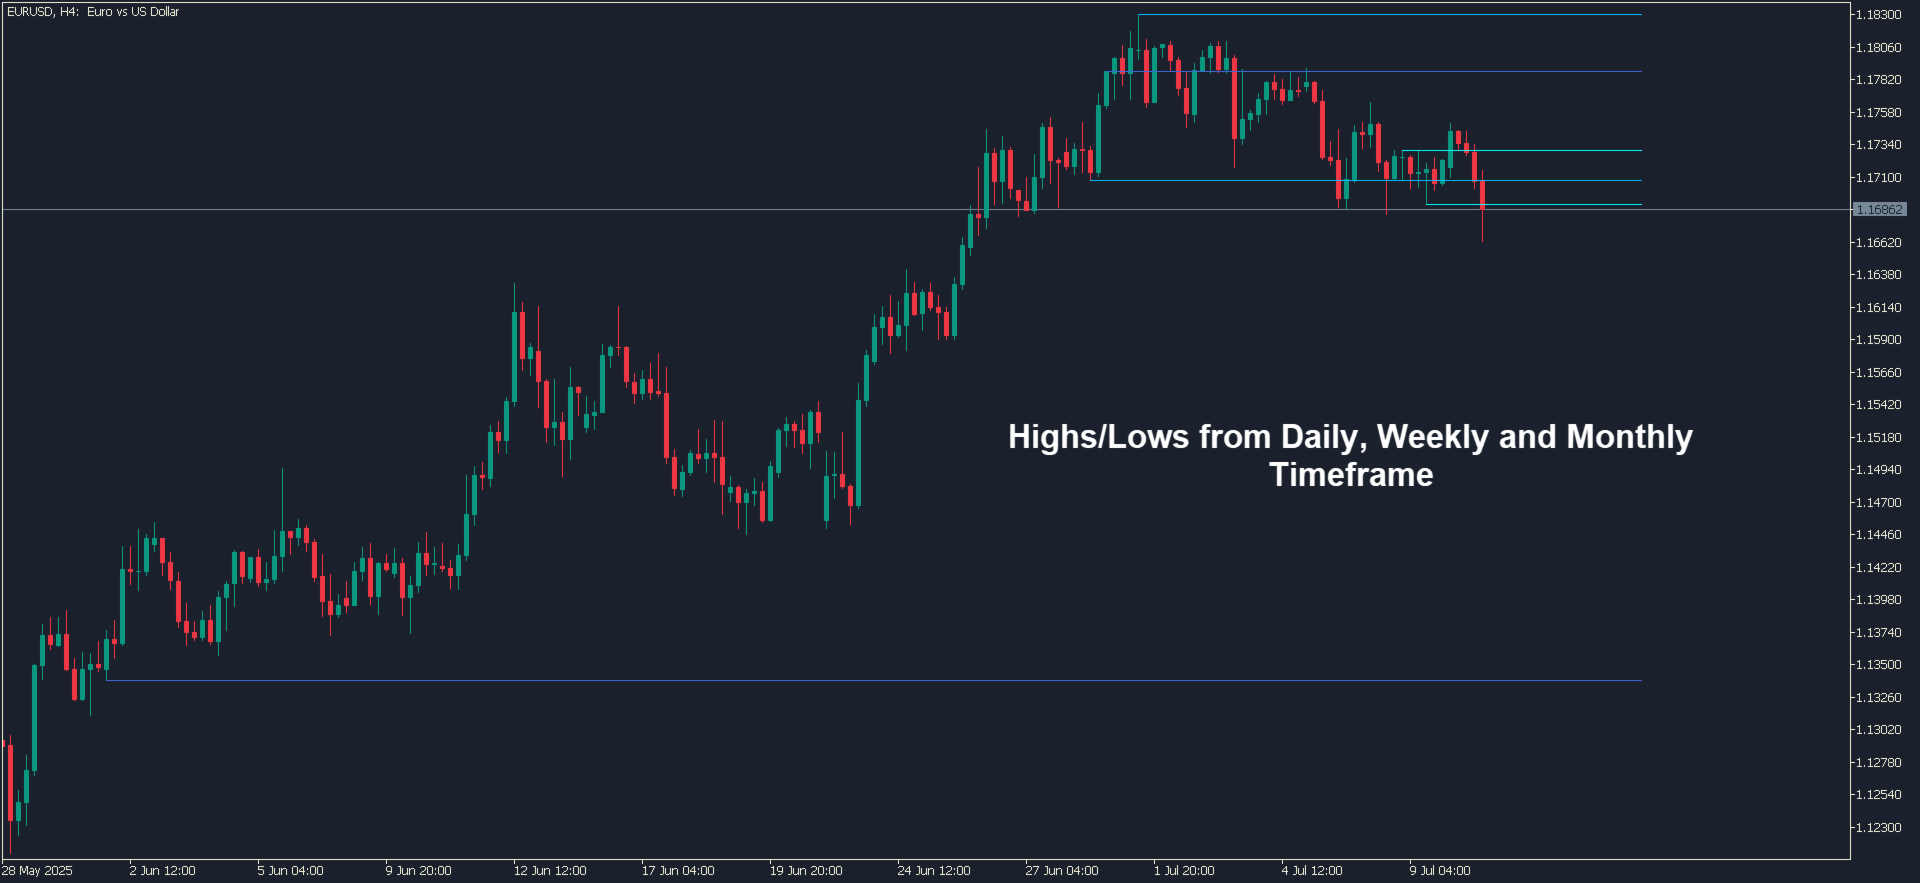
- Show Daily Levels – On: plots the previous day’s high and low lines; Off: hides daily levels.
- Show Weekly Levels – On: plots last week’s high and low; Off: hides weekly reference lines.
- Show Monthly Levels – On: plots last month’s high and low; Off: hides monthly reference lines.
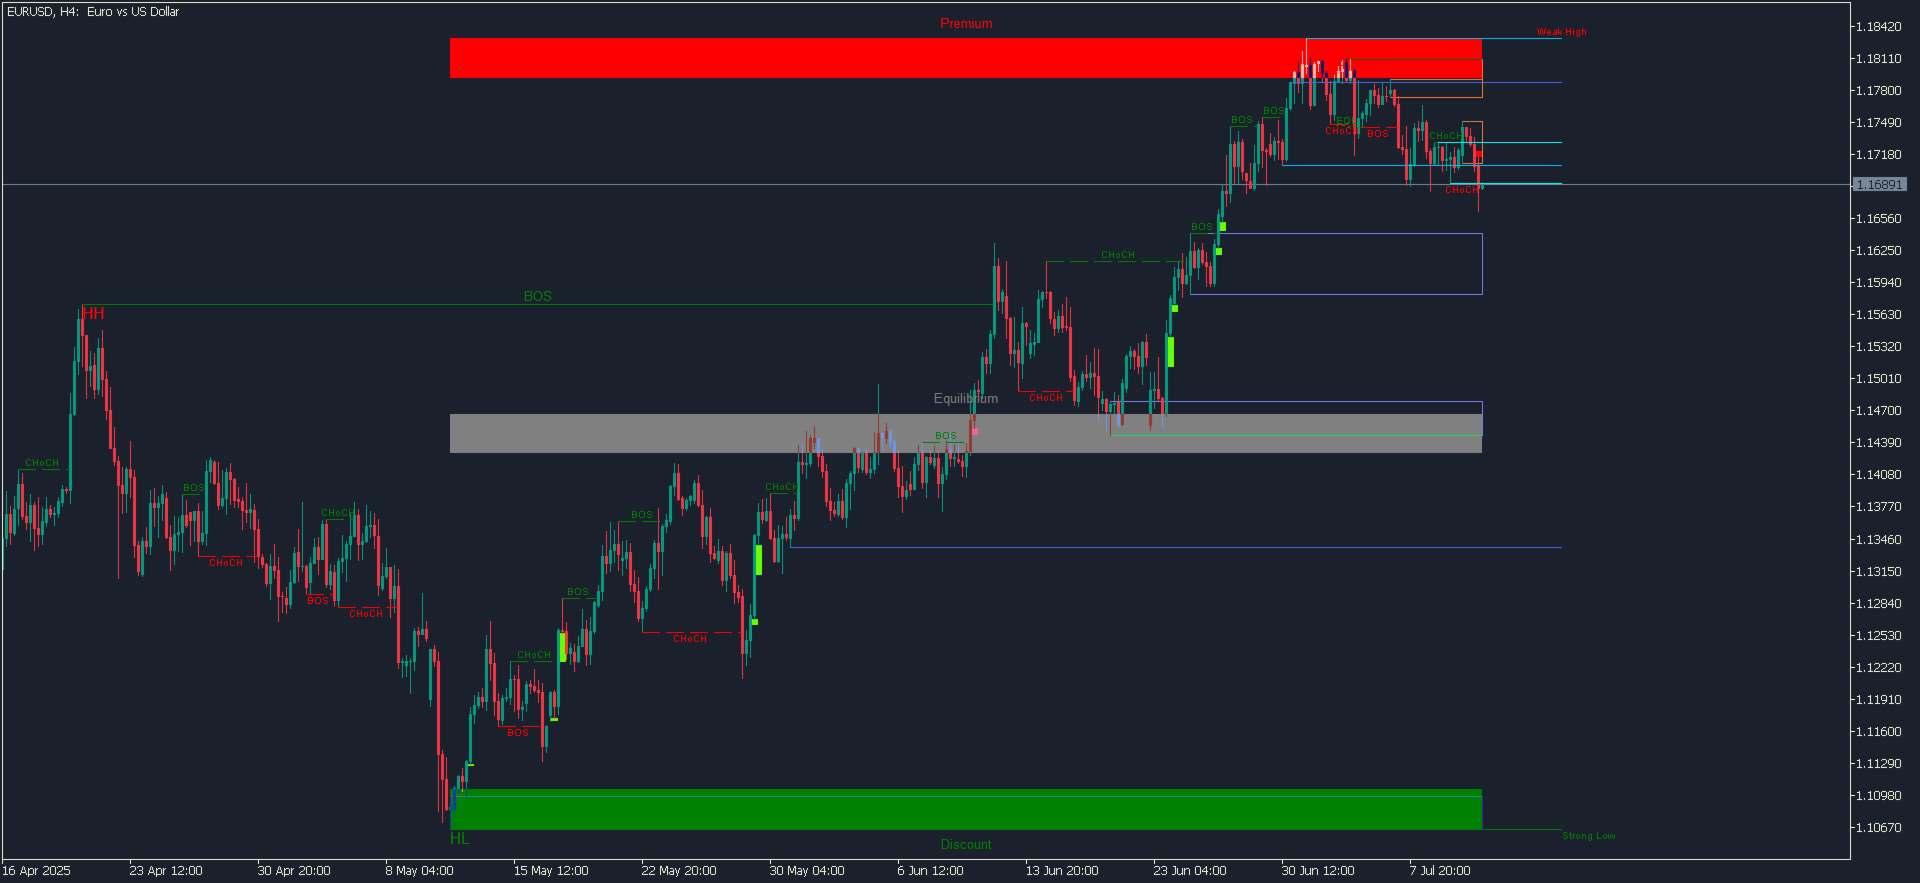
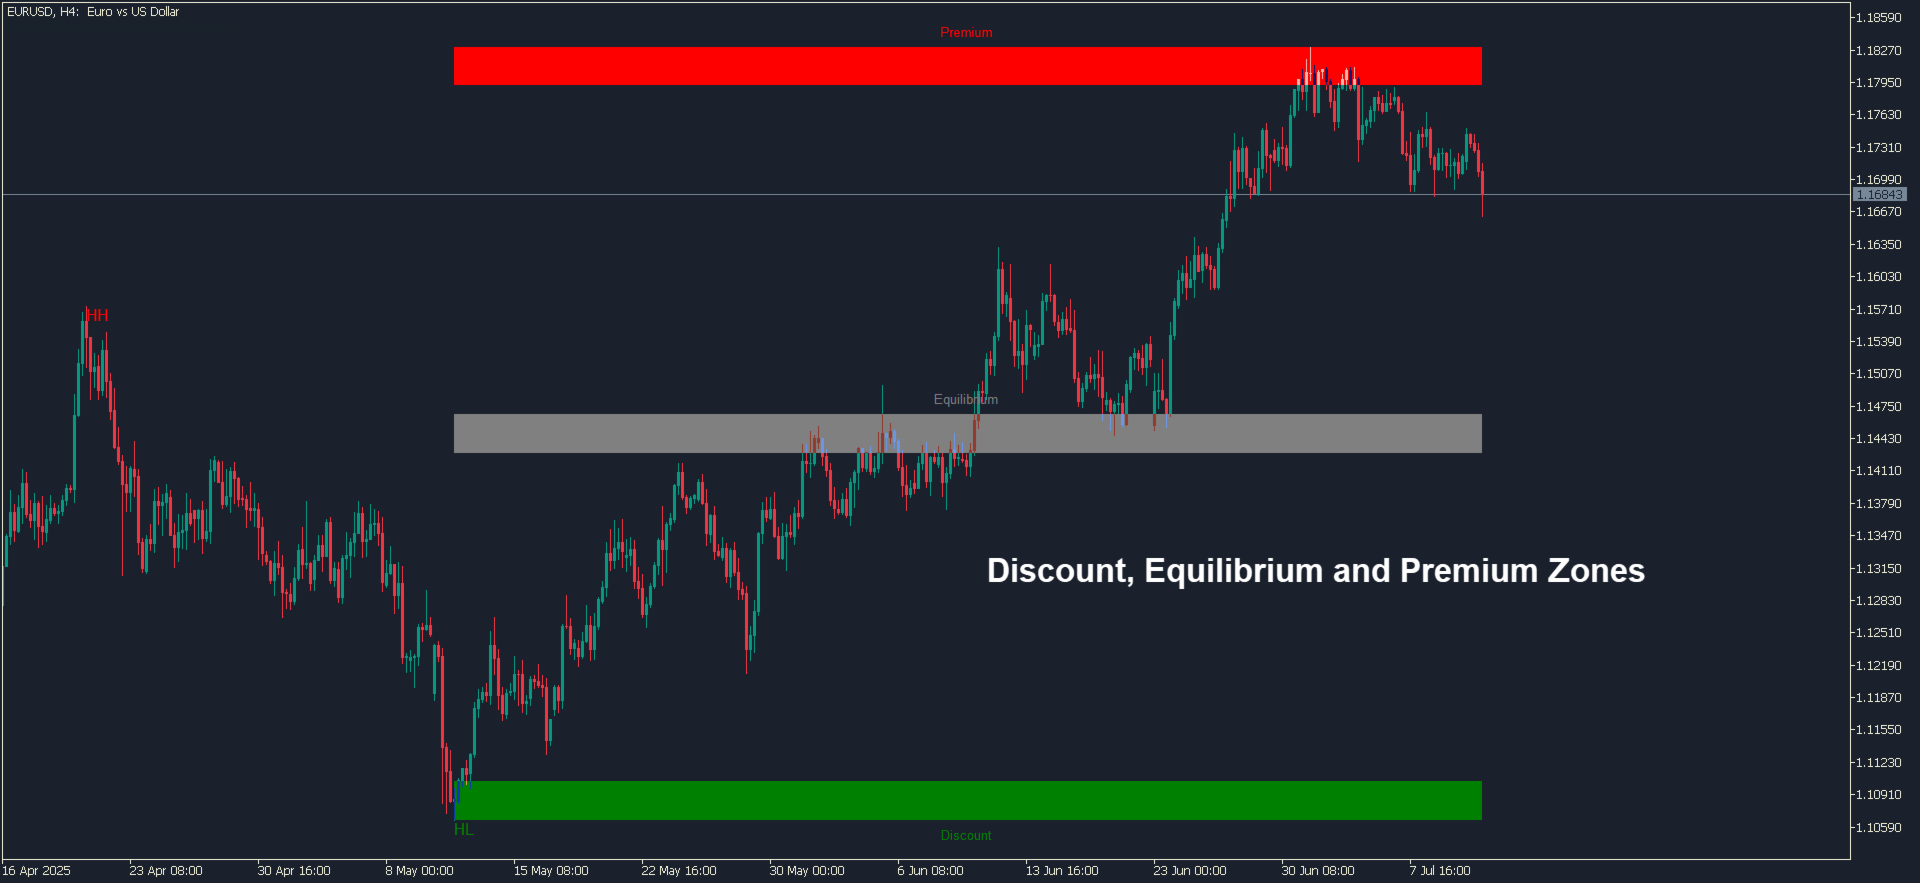
- Show Premium/Discount Zones – On: draws the premium zone, equilibrium zone and discount zone; Off: hides these zones.
How to Use
The indicator puts every selected overlay straight on your chart, so you spend your time reading the story, not drawing it. Simply turn on the elements you need, then combine them with your own ICT or price-action playbook.
Included Patterns
- Break of Structure (BOS)
- Change of Character (CHoCH)
- Internal and Swing Order Blocks
- Fair-Value Gaps (FVG)
- Equal Highs and Equal Lows (EQH/EQL)
- Premium, Equilibrium and Discount Zones
- Swing Points: HH, HL, LH, LL with Strong / Weak tags
- Higher-Time-Frame Levels: Daily, Weekly and Monthly highs and lows
Conclusion
The KT SMC indicator puts every key Smart Money Concepts marker on the chart: structure breaks, liquidity pools, zones and higher-time-frame levels, so you can read market intent faster and with less clutter.
Use it as a visual aid, not a promise of “bank-level” insight; like any tool, its value depends on your own risk management and trade plan.