Zone Shift MT4 Scanner
- Indicators
-
Duc Hoan Nguyen
 I develop practical trading tools for MetaTrader 4/5, with a focus on indicator integration, Multi-Timeframe analysis, market scanning, and automated trading solutions.
My work mainly includes:
• Indicator-to-EA Solutions - Version: 1.0
- Activations: 10
New tools will be $30 for the first week or the first 3 purchases!
Trading Tools Channel on MQL5: Join my MQL5 channel to update the latest news from me
See more MT5 version at: Zone Shift MT5 Scanner
See more MT4 version at: Zone Shift MT4 Scanner
See more products at: All Products
KEY FEATURES
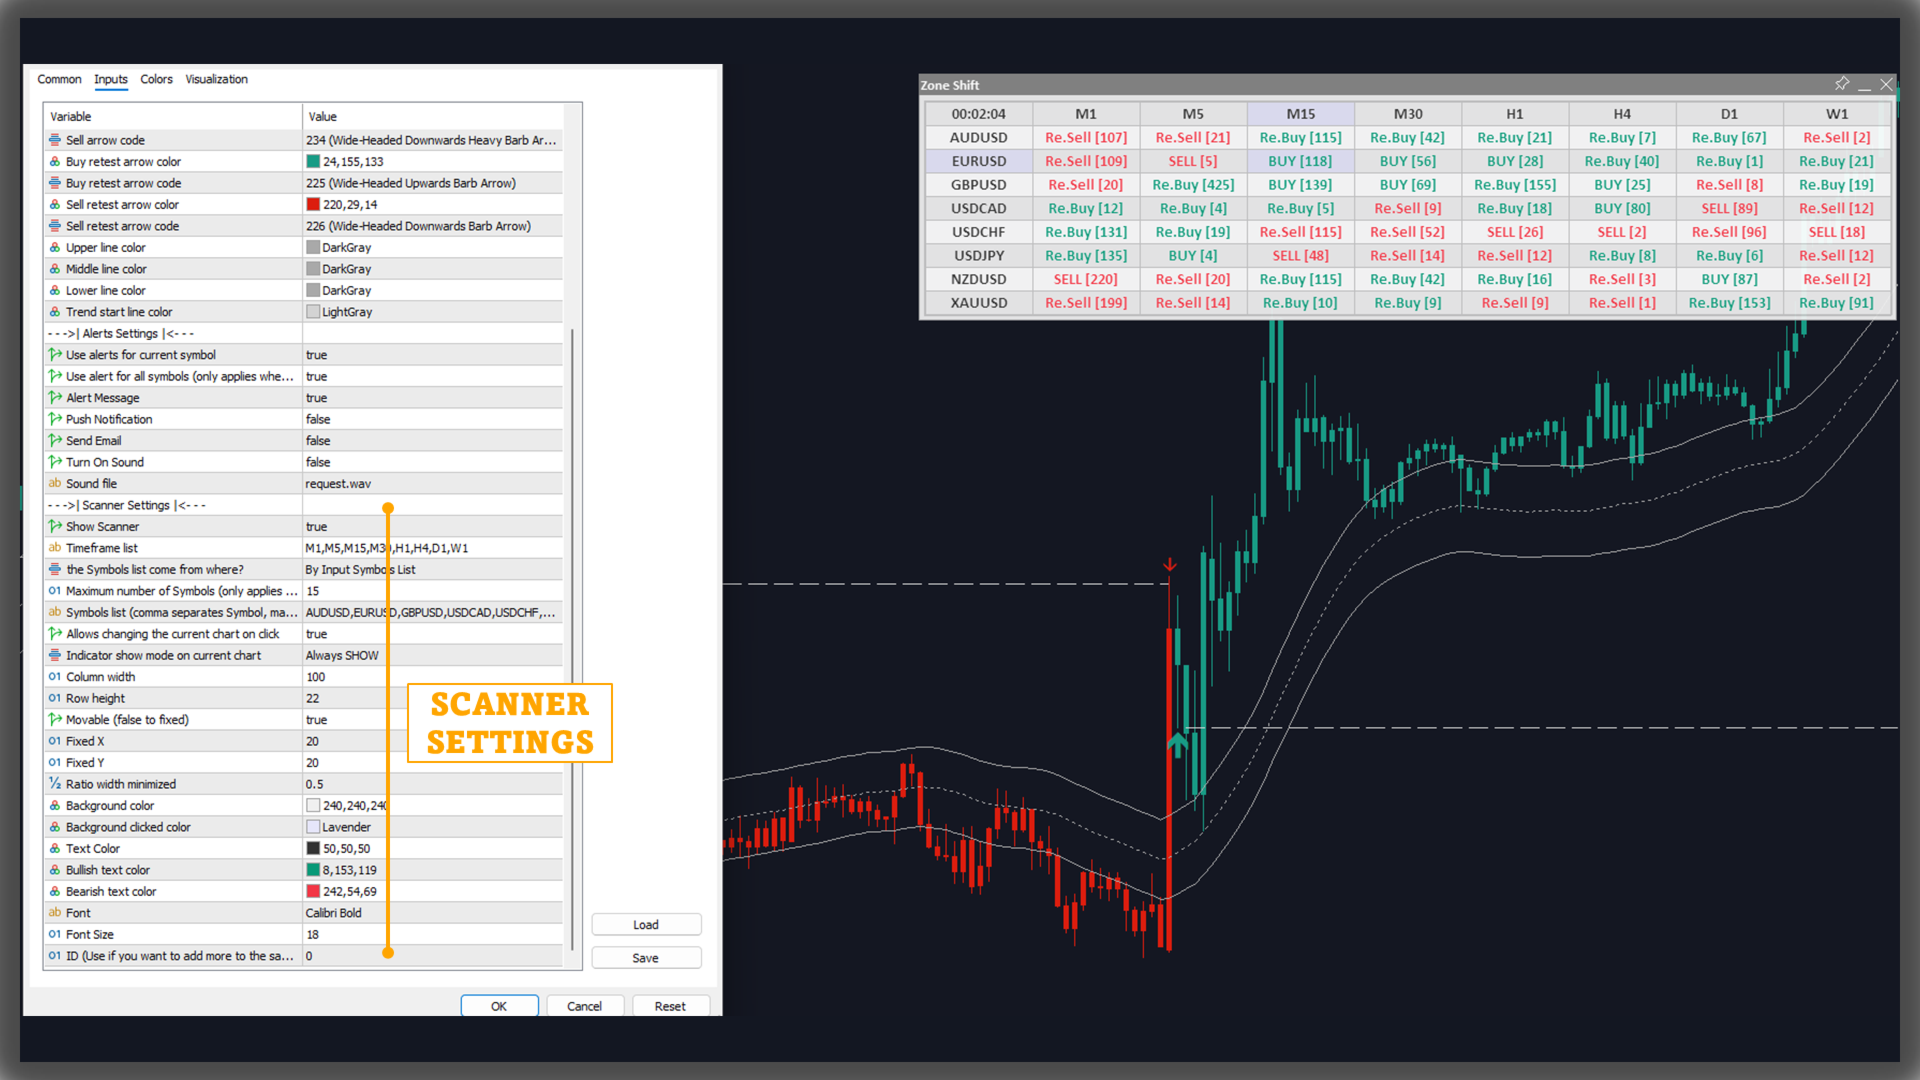
1) Dynamic EMA-HMA Band
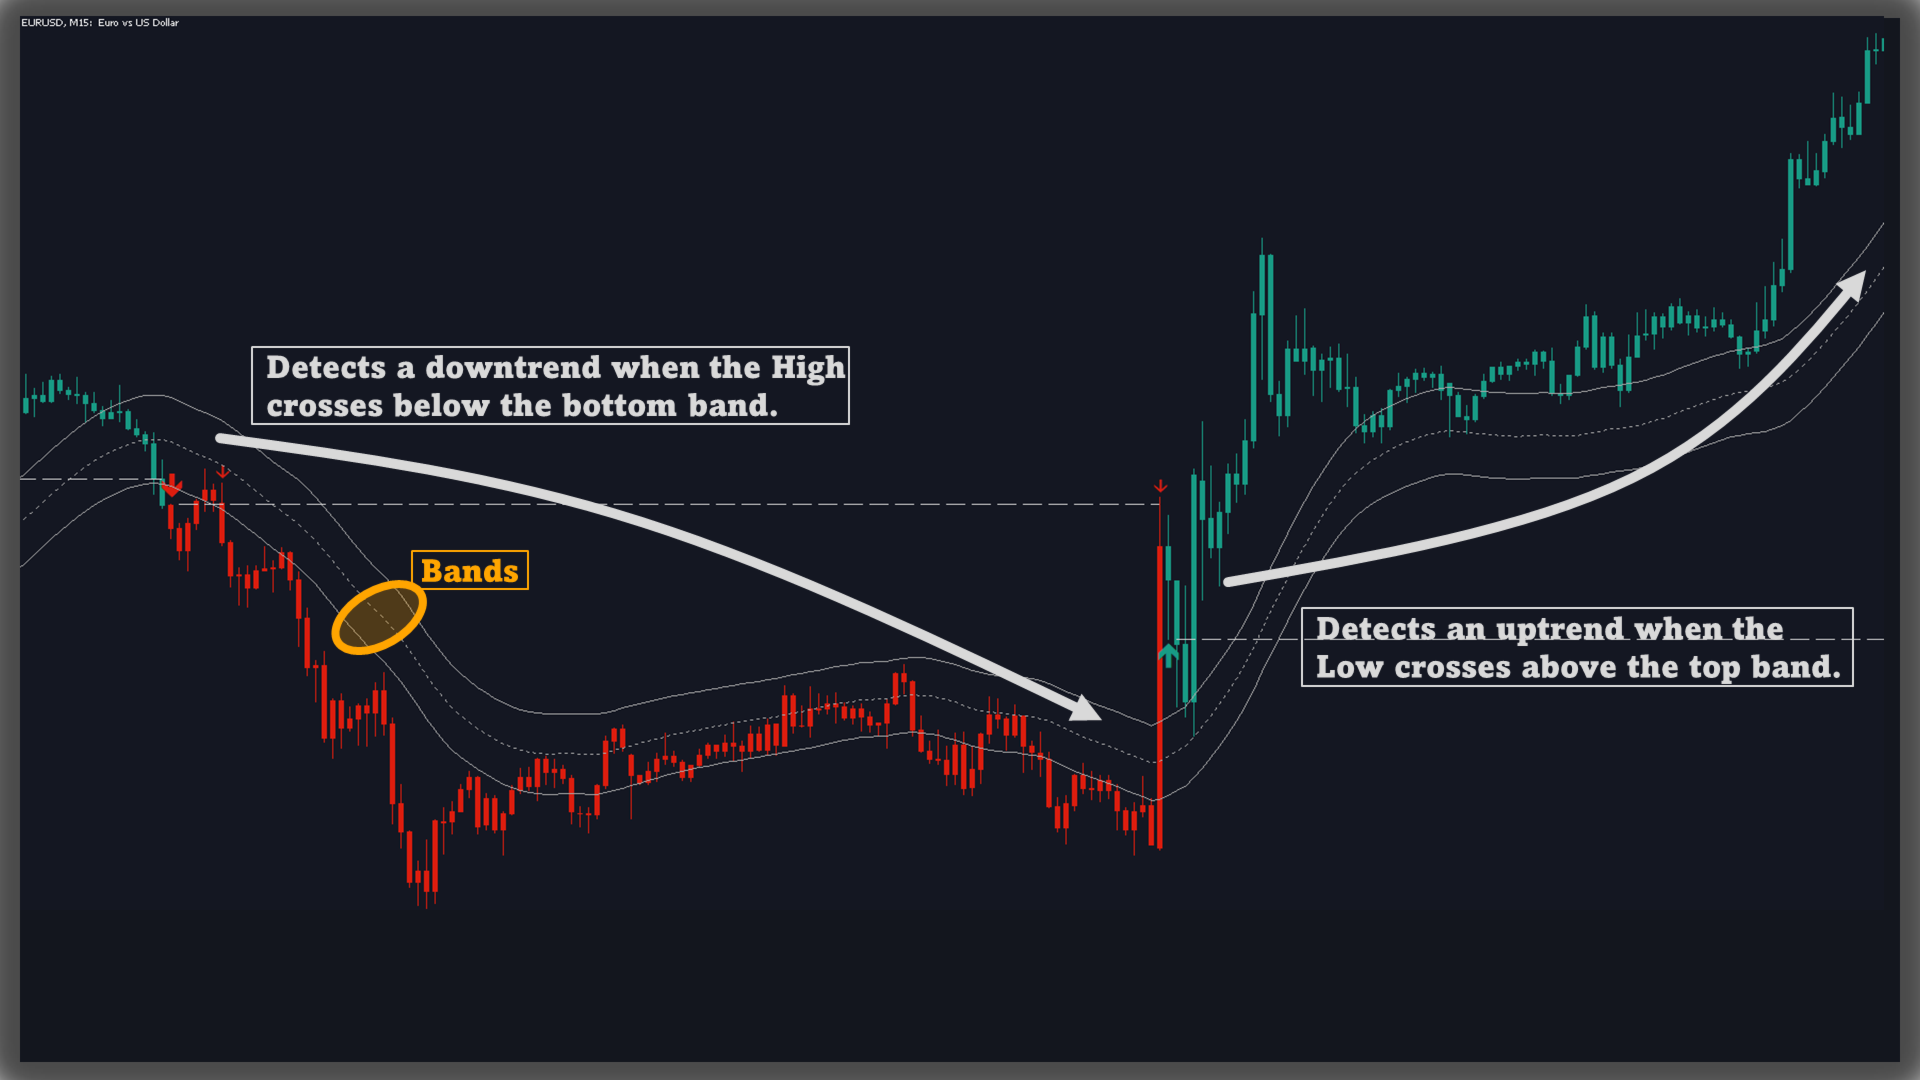
Builds a three-line channel: the midline is the average of EMA and HMA; the upper and lower bounds expand based on average candle range. The band adapts to market volatility to reflect the current operating zone.
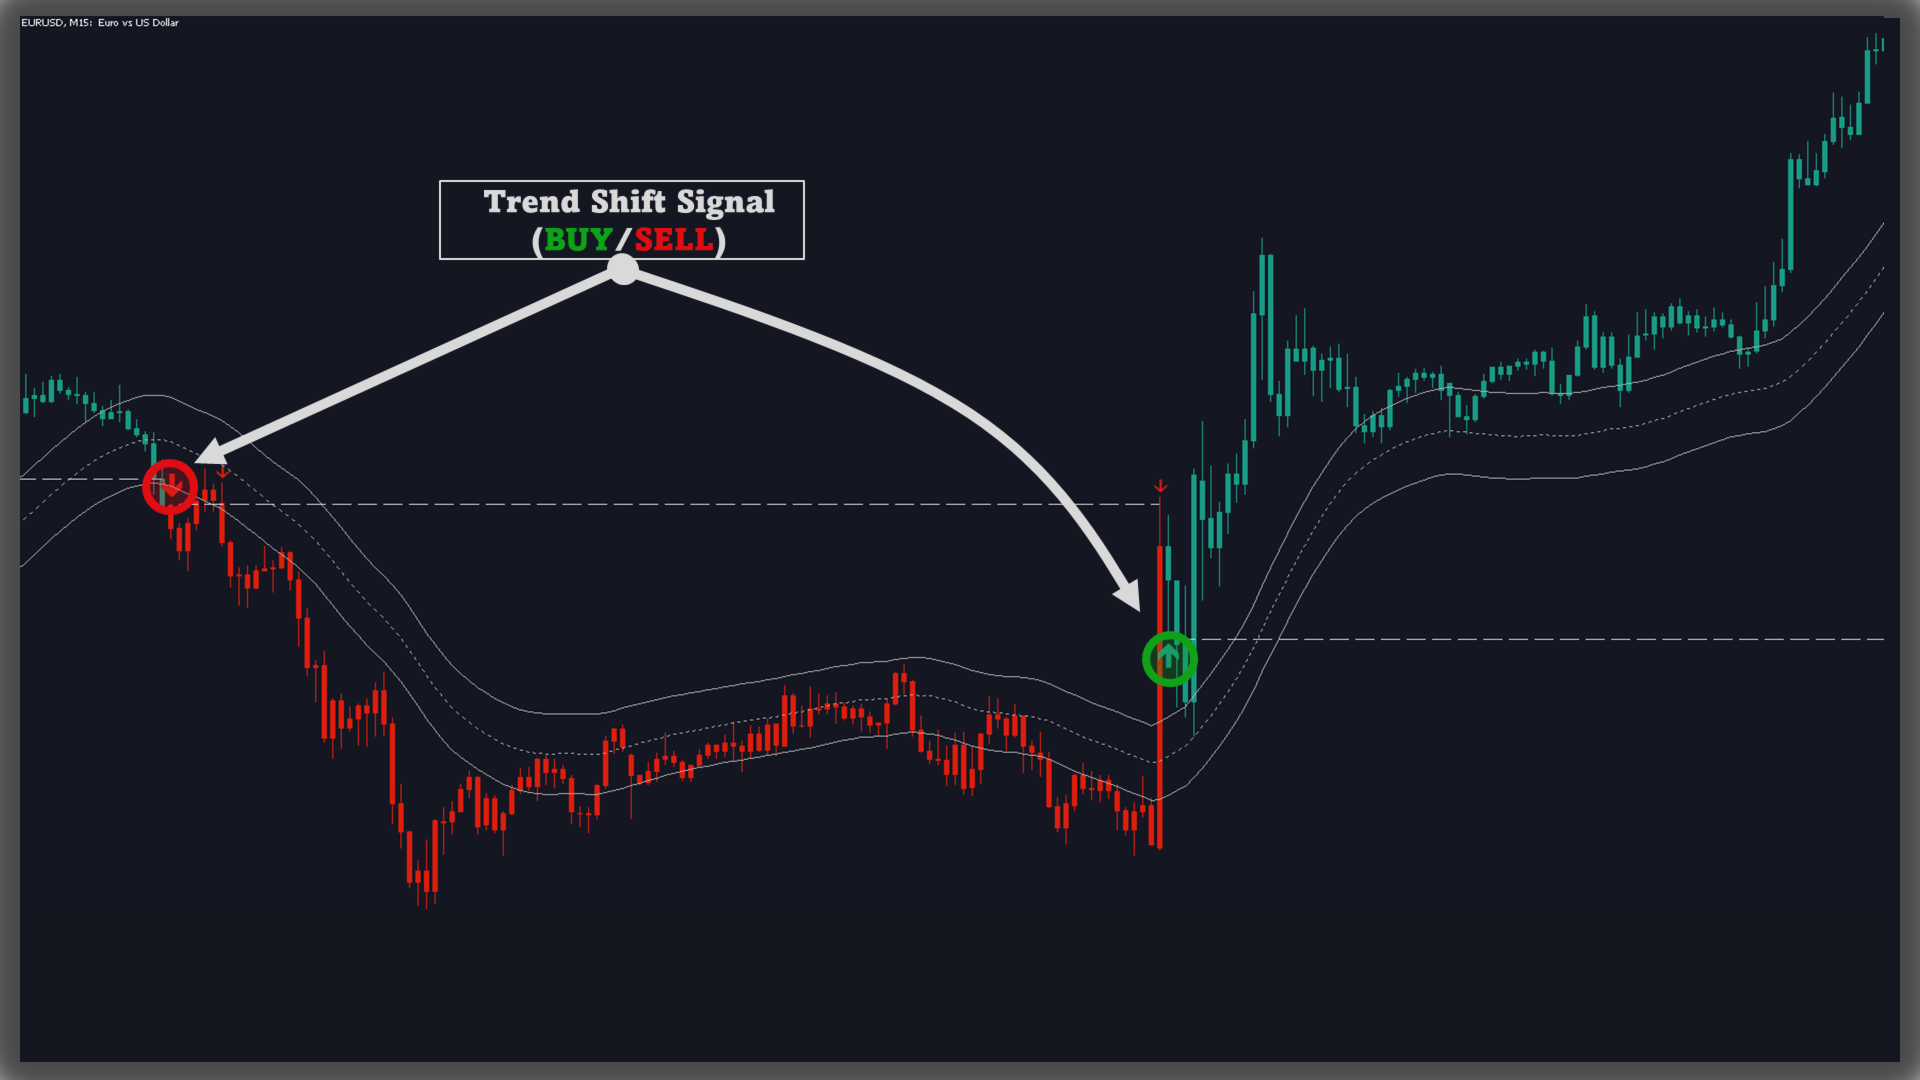
2) Trend Detection (Band Cross Logic)
-
Identifies an uptrend when the Low crosses above the upper band.
-
Identifies a downtrend when the High crosses below the lower band.
-
Candles recolor: lime for uptrends and red for downtrends.
3) Trend Initiation Level
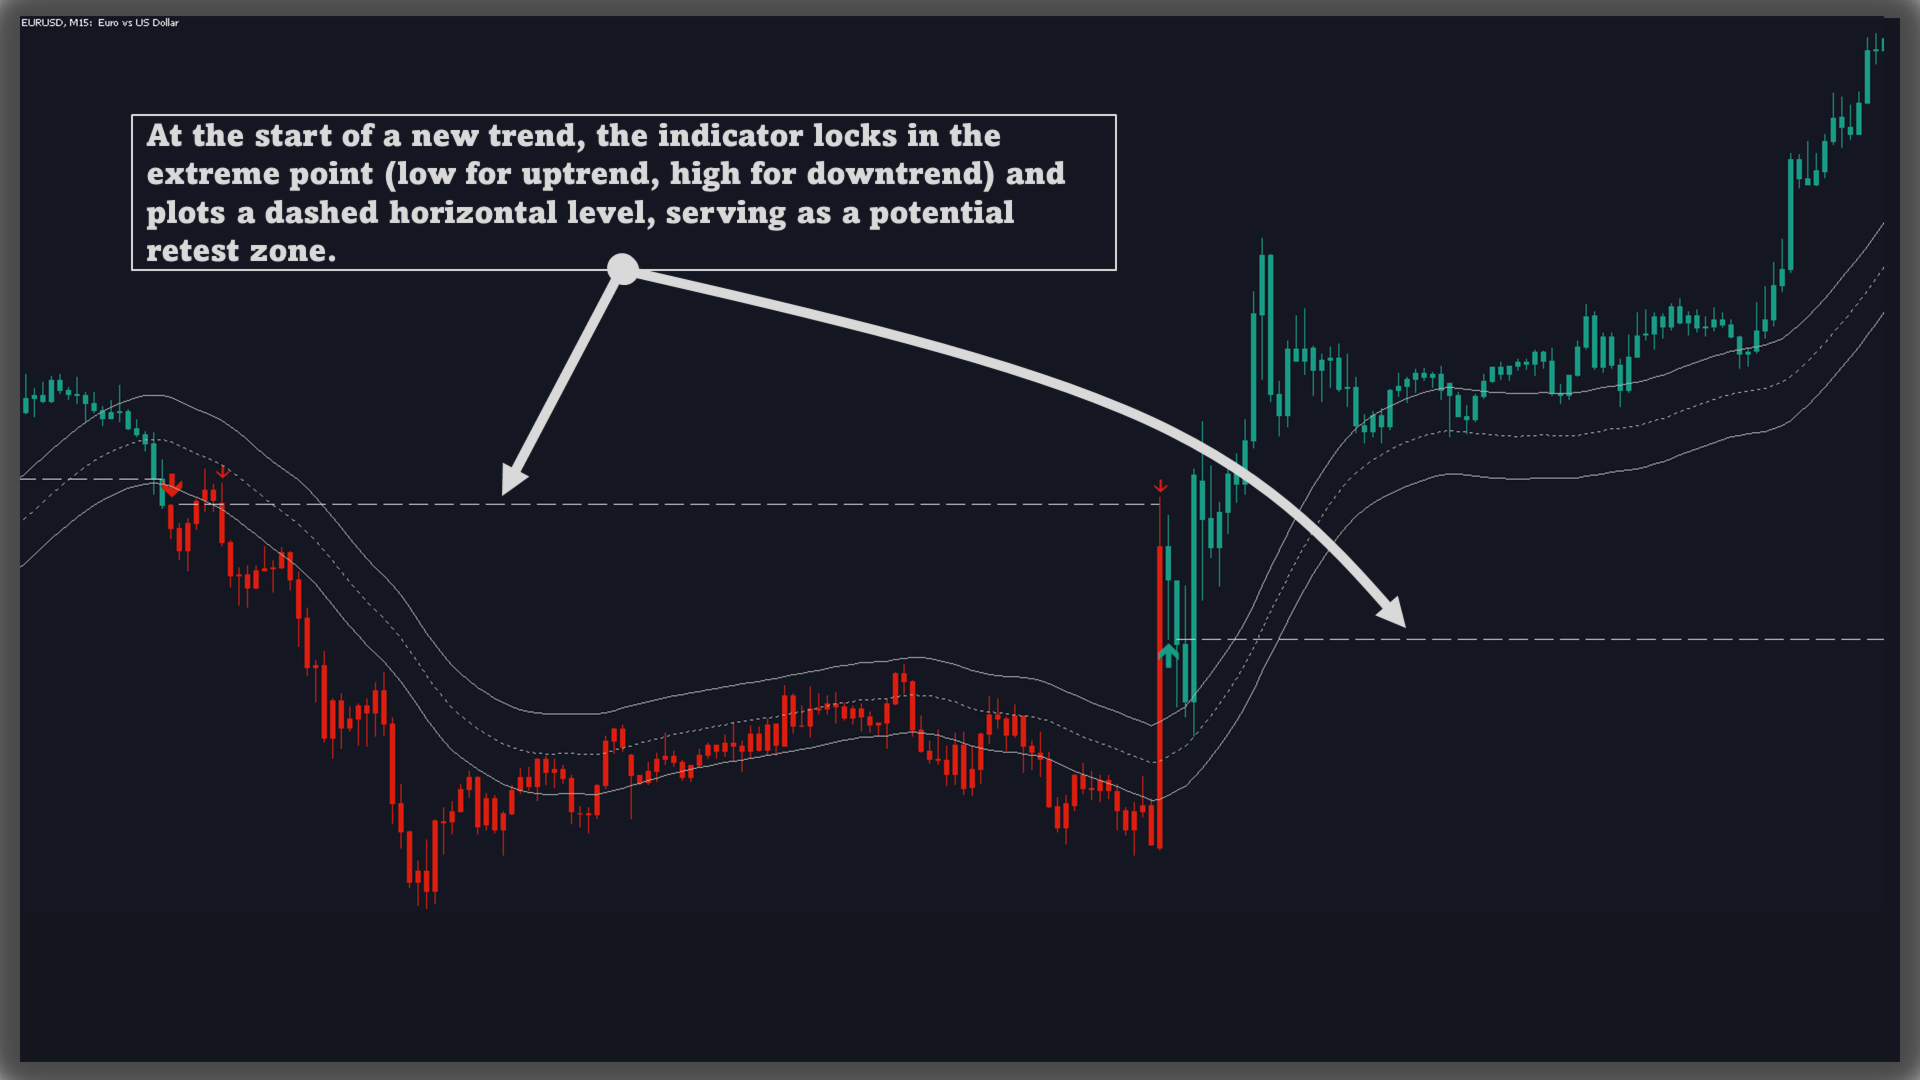
At the start of a new trend, the tool records the extreme point (low for uptrends, high for downtrends) and draws a dashed horizontal level at this price as a potential retest zone.
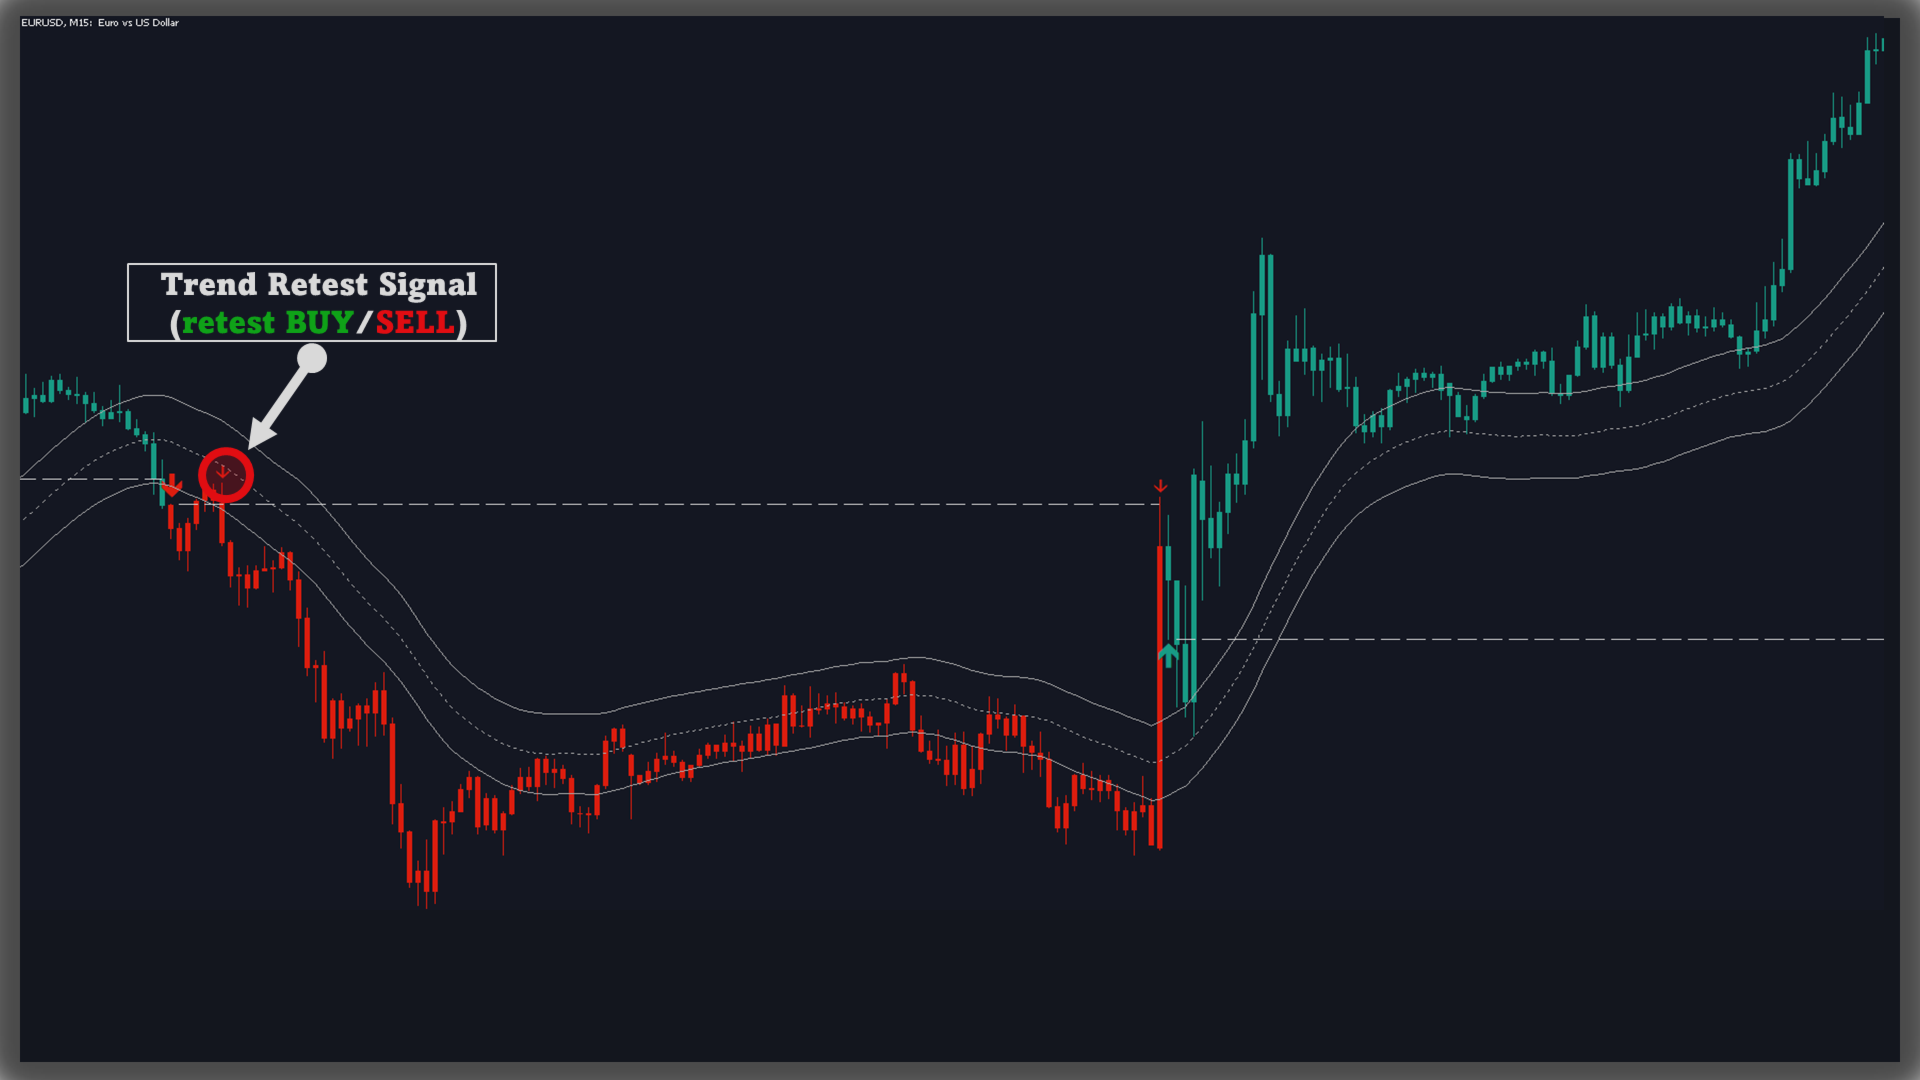
4) Trend Retest Signal
If price crosses back over the Trend Initiation level in the direction of the active trend, a corresponding arrow appears at the retest point, indicating that price is revisiting the shift level.
5) Visual Band Layout
-
Midline: Dashed line representing the average of EMA and HMA.
-
Top/Bottom: Solid lines representing dynamic thresholds above/below the midline.
This layout helps visualize compression, expansion, and potential breakout areas.
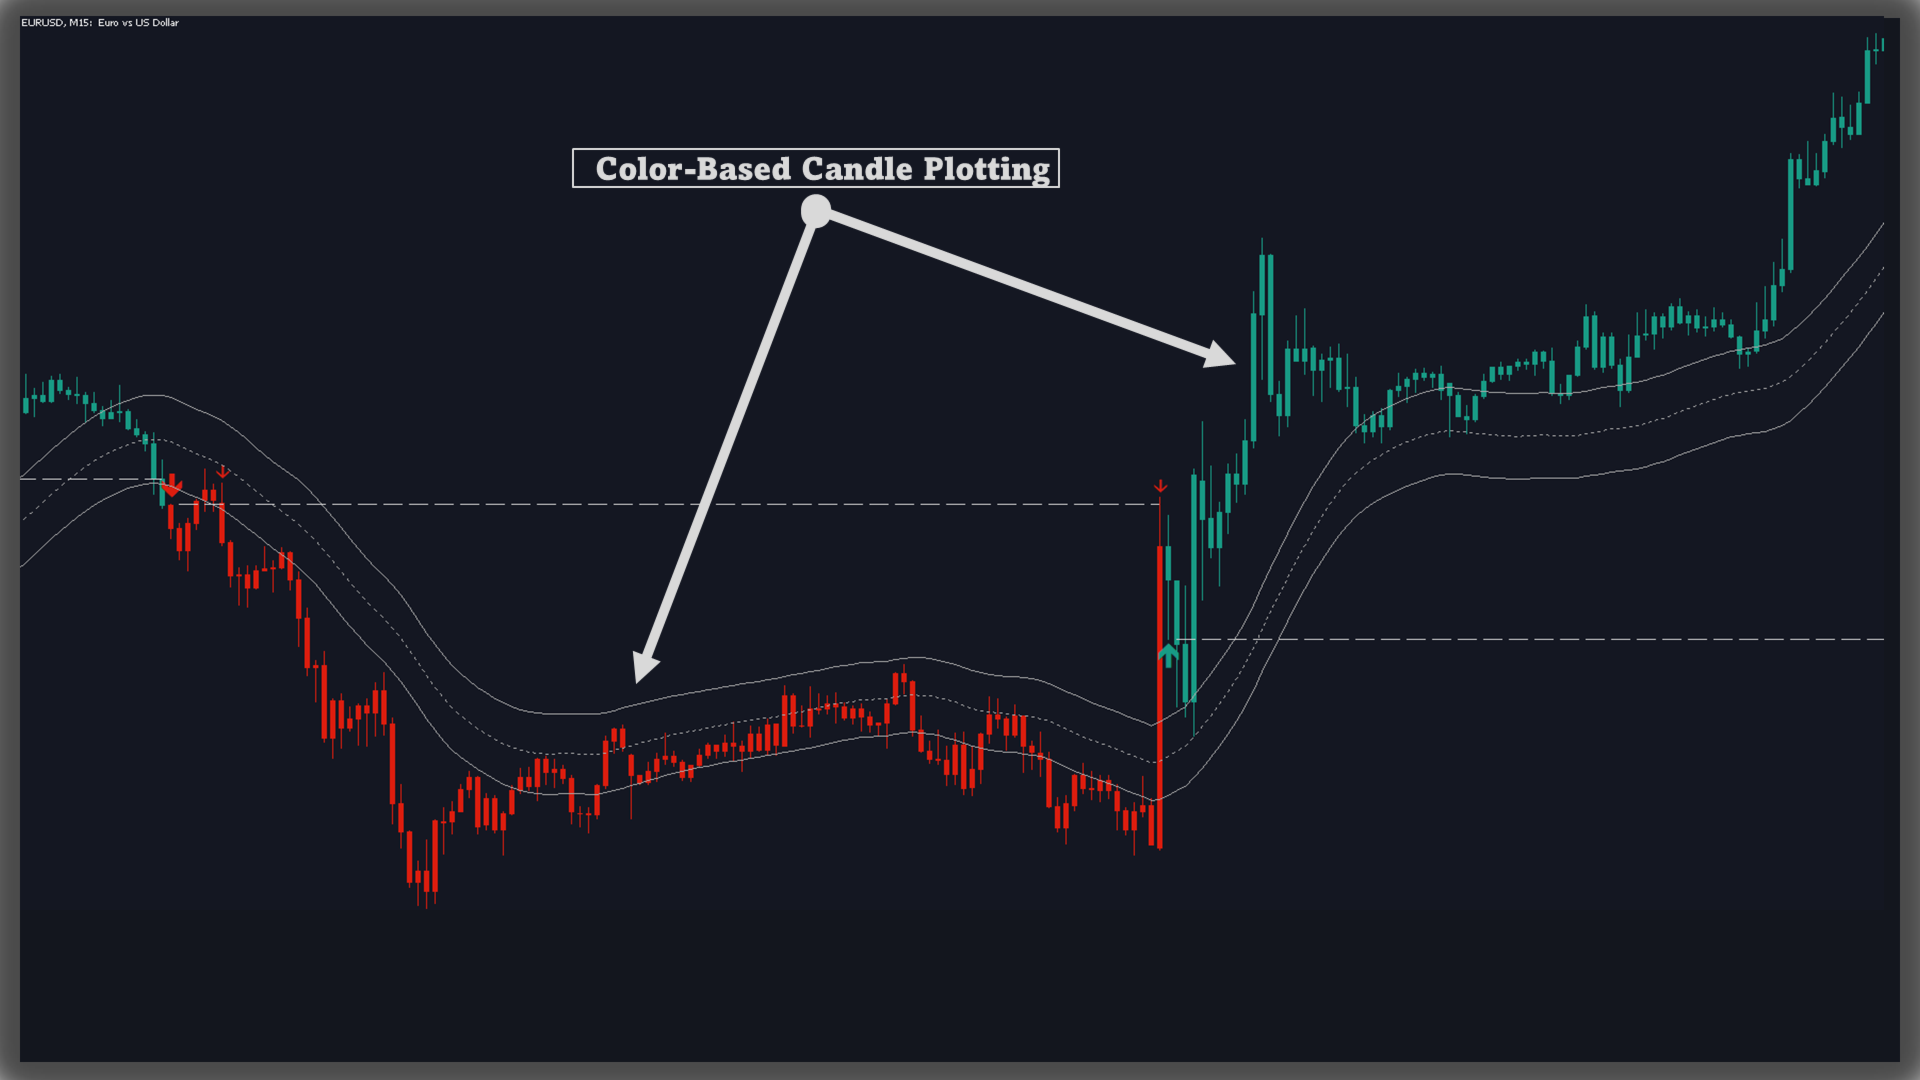
6) Color-Based Candle Plotting
Candles are recolored in real time according to the current trend, providing an immediate visual view of directional bias.
7) Noise-Filtered Retests
Retests are marked only if they occur more than 5 bars (adjust at input) after the previous one, filtering out minor, repetitive fluctuations.
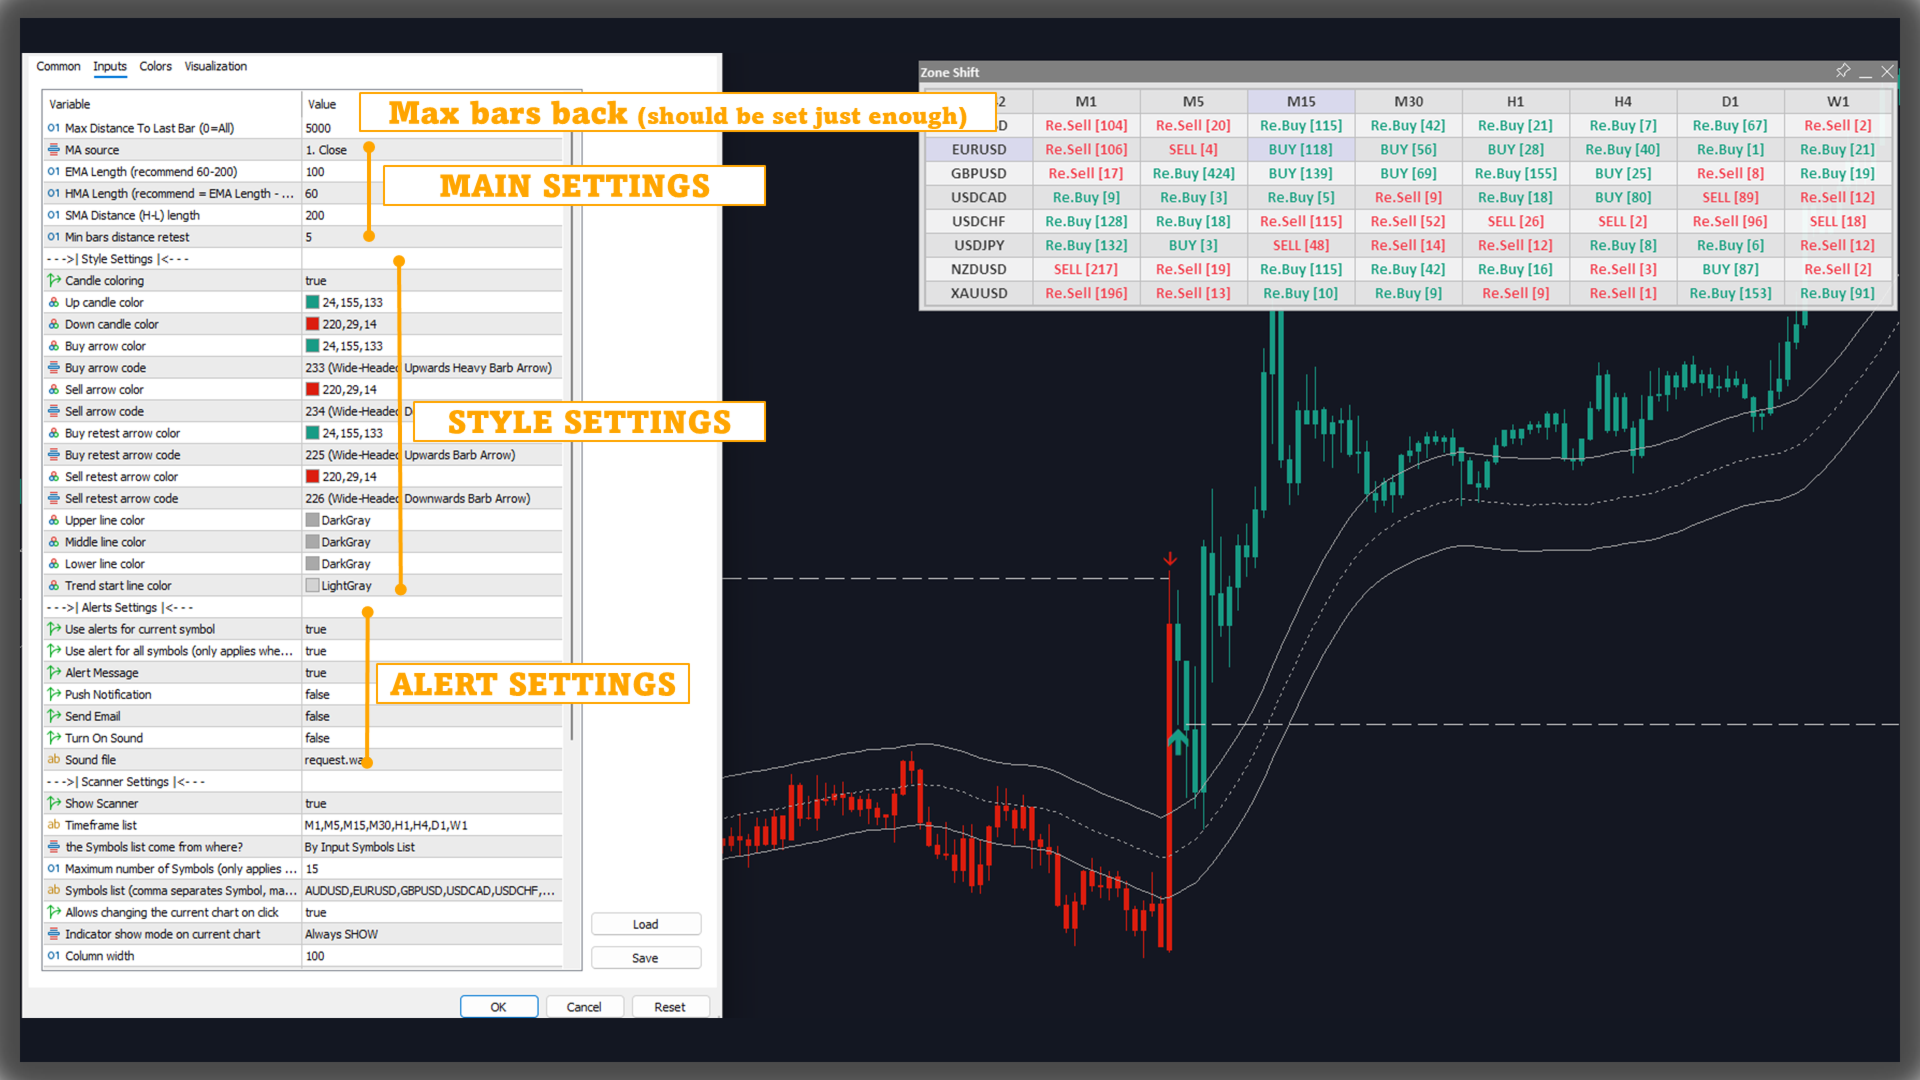
SCANNER AND ALERTS
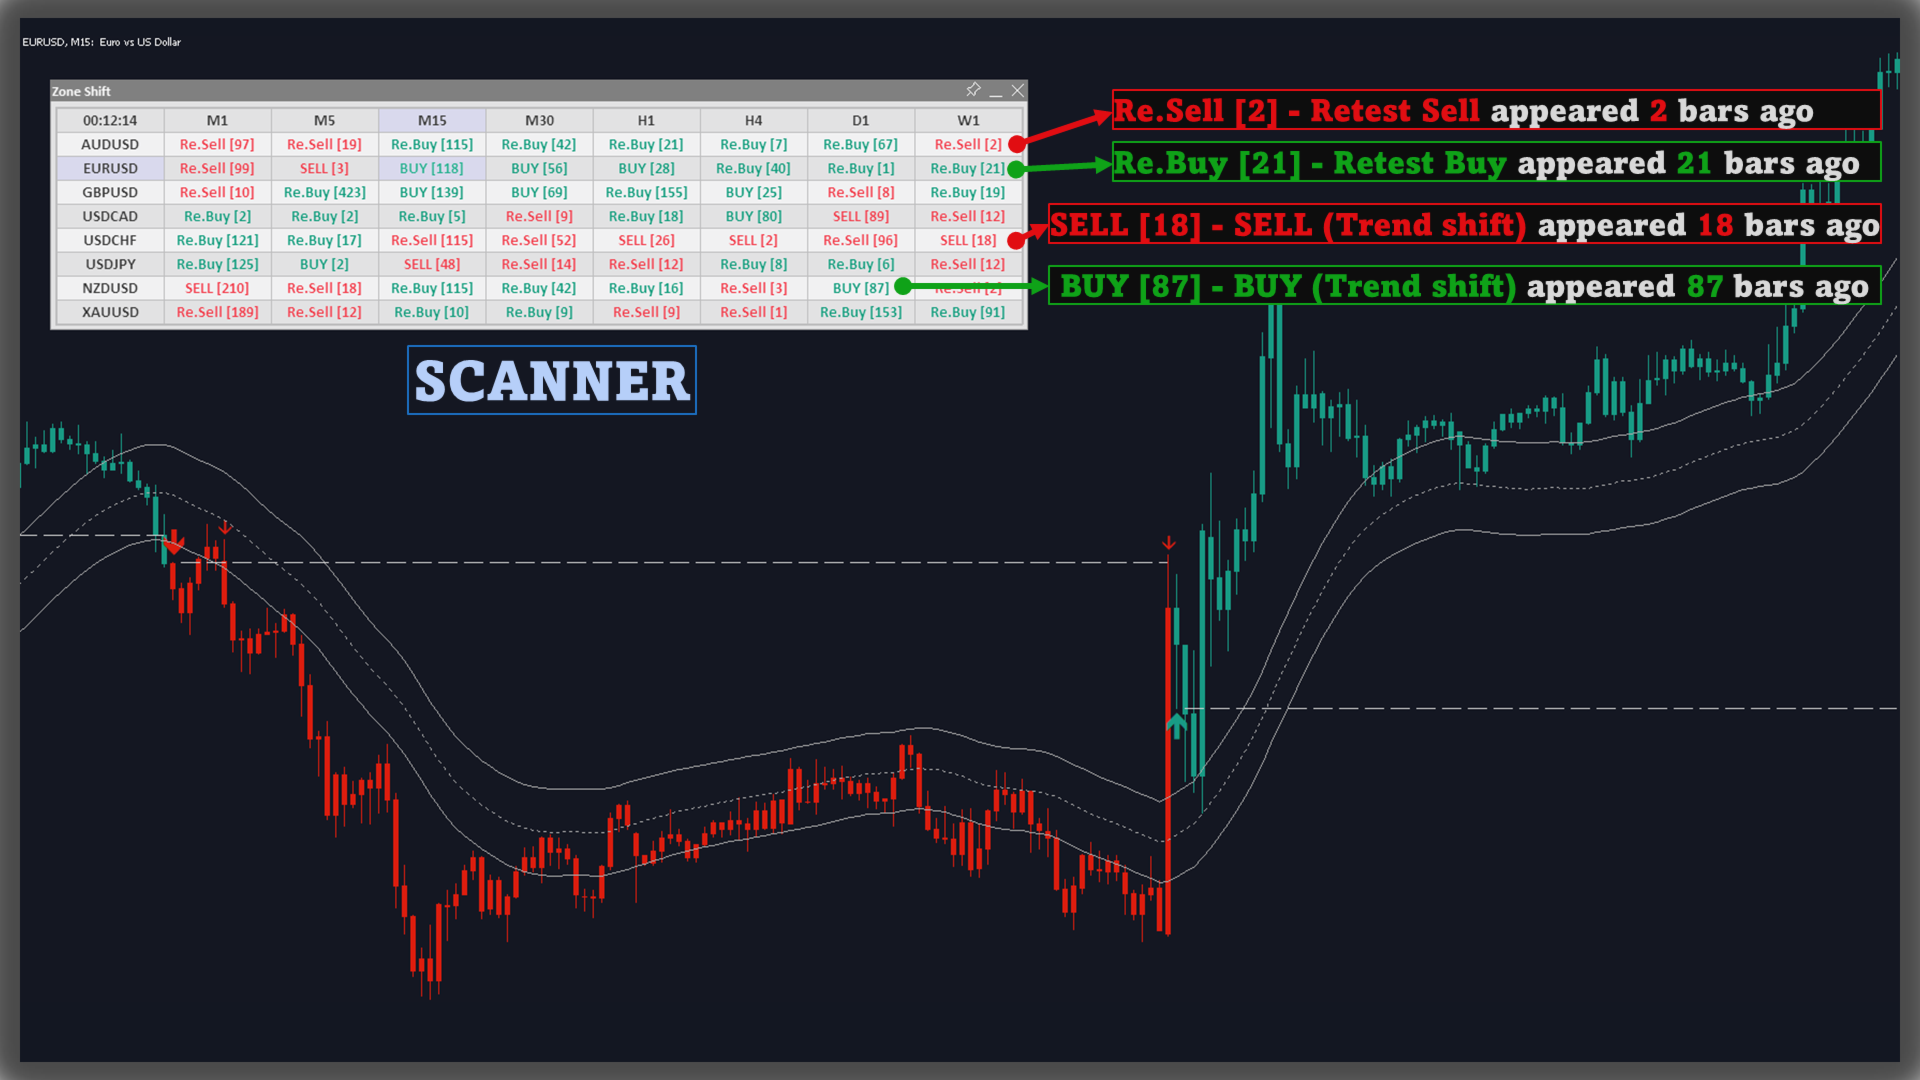
Users can turn on/off the scanner to monitor other charts quickly.
The indicator has signal alerts when Buy/Sell appear, Breakout arrows appear, users can easily grasp market information with these alerts (especially when using Scanner)
USAGE
-
Use candle colors to align trades with the prevailing trend.
-
Treat dashed trend start levels as notable support/resistance zones.
-
Watch for the corresponding arrow as confirmation of retests for potential continuation or entry.
-
Use band boundaries to assess trend strength and volatility expansion.
-
Combine with existing methods to confirm momentum and zone shifts.
CONCLUSION
Zone Shift provides a visual way to observe trend changes and key reaction points. By combining band breakouts with real-time retest signals and trend-colored candles, the tool streamlines reading market structure shifts and identifying entry areas with strong confluence.


























































User didn't leave any comment to the rating