HawkEye Volume Indicator for MT5
- Indicators
- Eda Kaya
- Version: 2.1
HawkEye Volume Indicator MetaTrader 5
The HawkEye Volume Indicator is a powerful oscillator on the MetaTrader 5 platform, specifically designed to enhance volume-based market analysis. By using color-coded histogram bars, it helps traders evaluate price strength, direction, and potential reversals with greater accuracy.
«Indicator Installation & User Guide»
MT5 Indicator Installation | HawkEye Volume Indicator for MT4 | ALL Products By TradingFinderLab | Best MT5 Indicator: Refined Order Block Indicator for MT5 | Best MT5 Utility: Trade Assistant Expert TF MT5 | TP & SL Tool: Risk Reward Ratio Calculator RRR MT5 | Prop Firm Protector: Trade Assist Prop Firm Plus TF Expert MT5 | Money Management + DrawDown Protector: Trade Panel Prop Firm Drawdawn Limiter Pro MT5
HawkEye Volume Indicator Specifications
| Category | Oscillator – Currency Strength – Trading Tool |
| Platform | MetaTrader 5 |
| Skill Level | Intermediate |
| Type of Indicator | Reversal – Continuation |
| Timeframe | Multi-timeframe |
| Trading Style | Scalping – Intraday |
| Market | Cryptocurrency – Forex – Stocks – Commodities |
Indicator Overview
The HawkEye Volume Indicator uses histograms to represent volume changes tied to candlestick behavior.
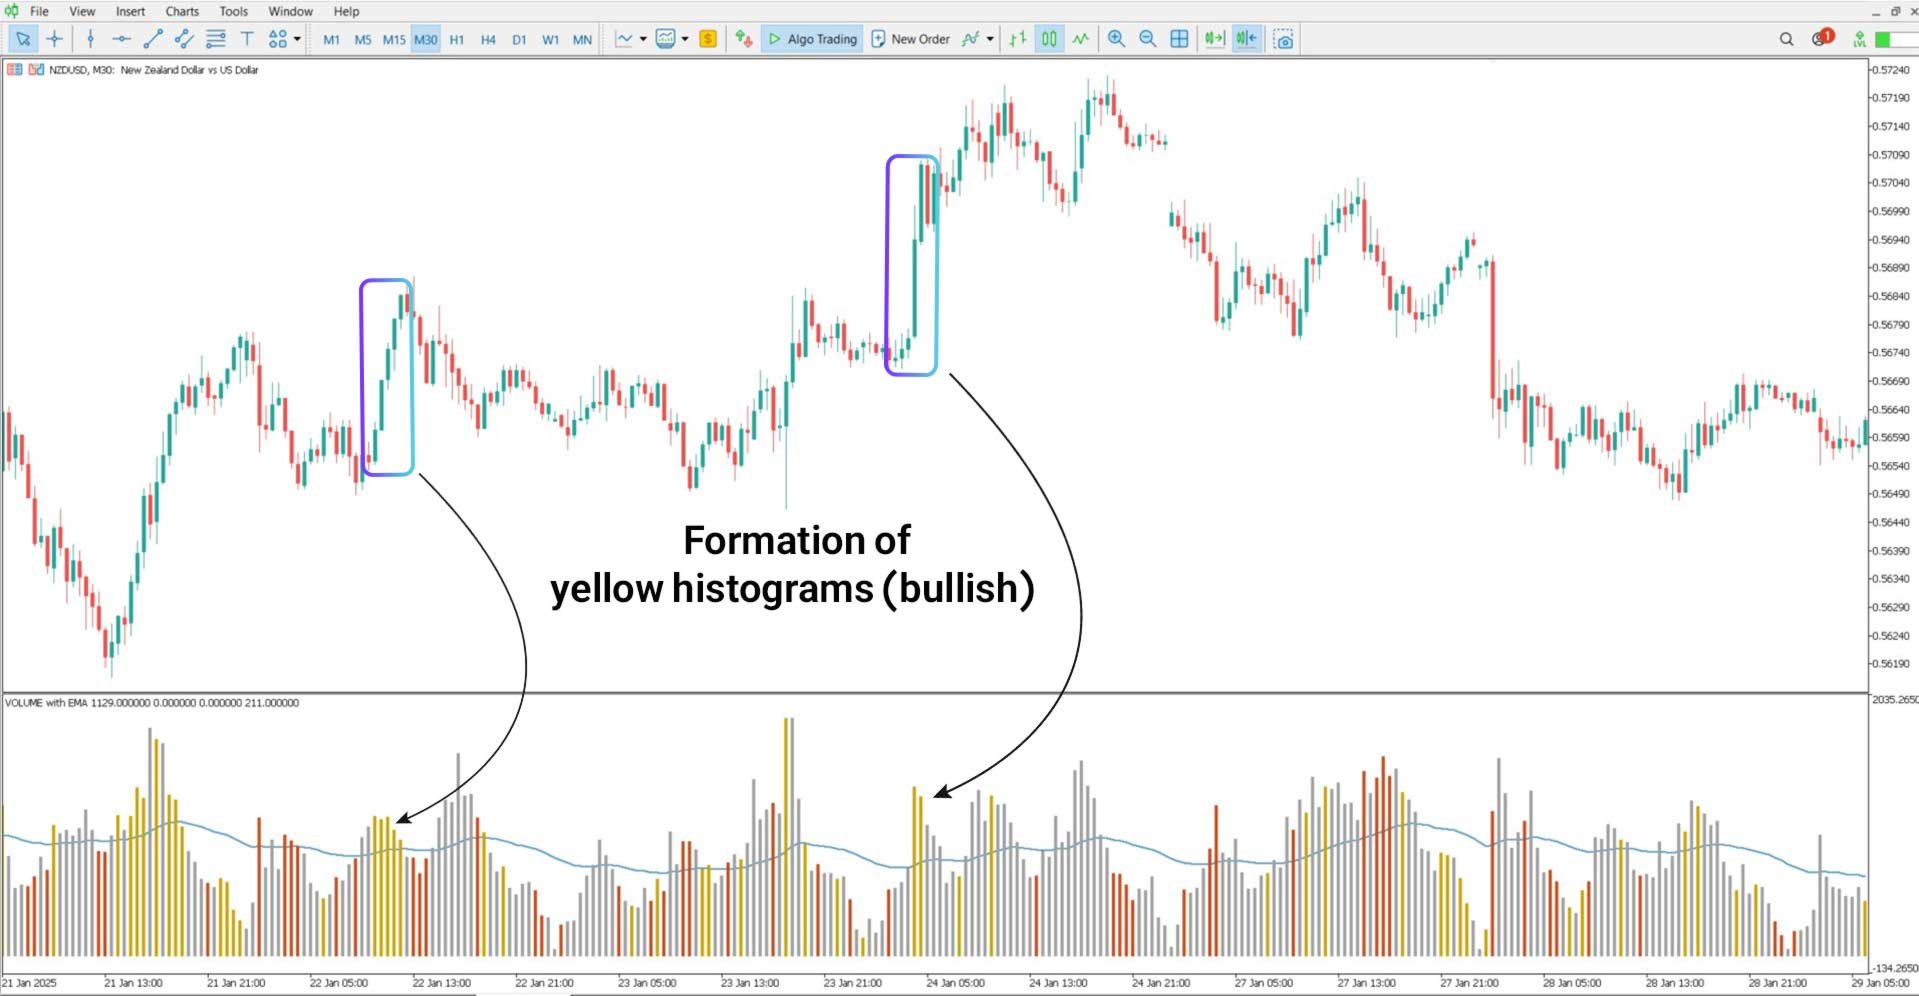
· Yellow bars appear when a bullish candle’s body exceeds 60% of its total height and closes higher than the previous bar.
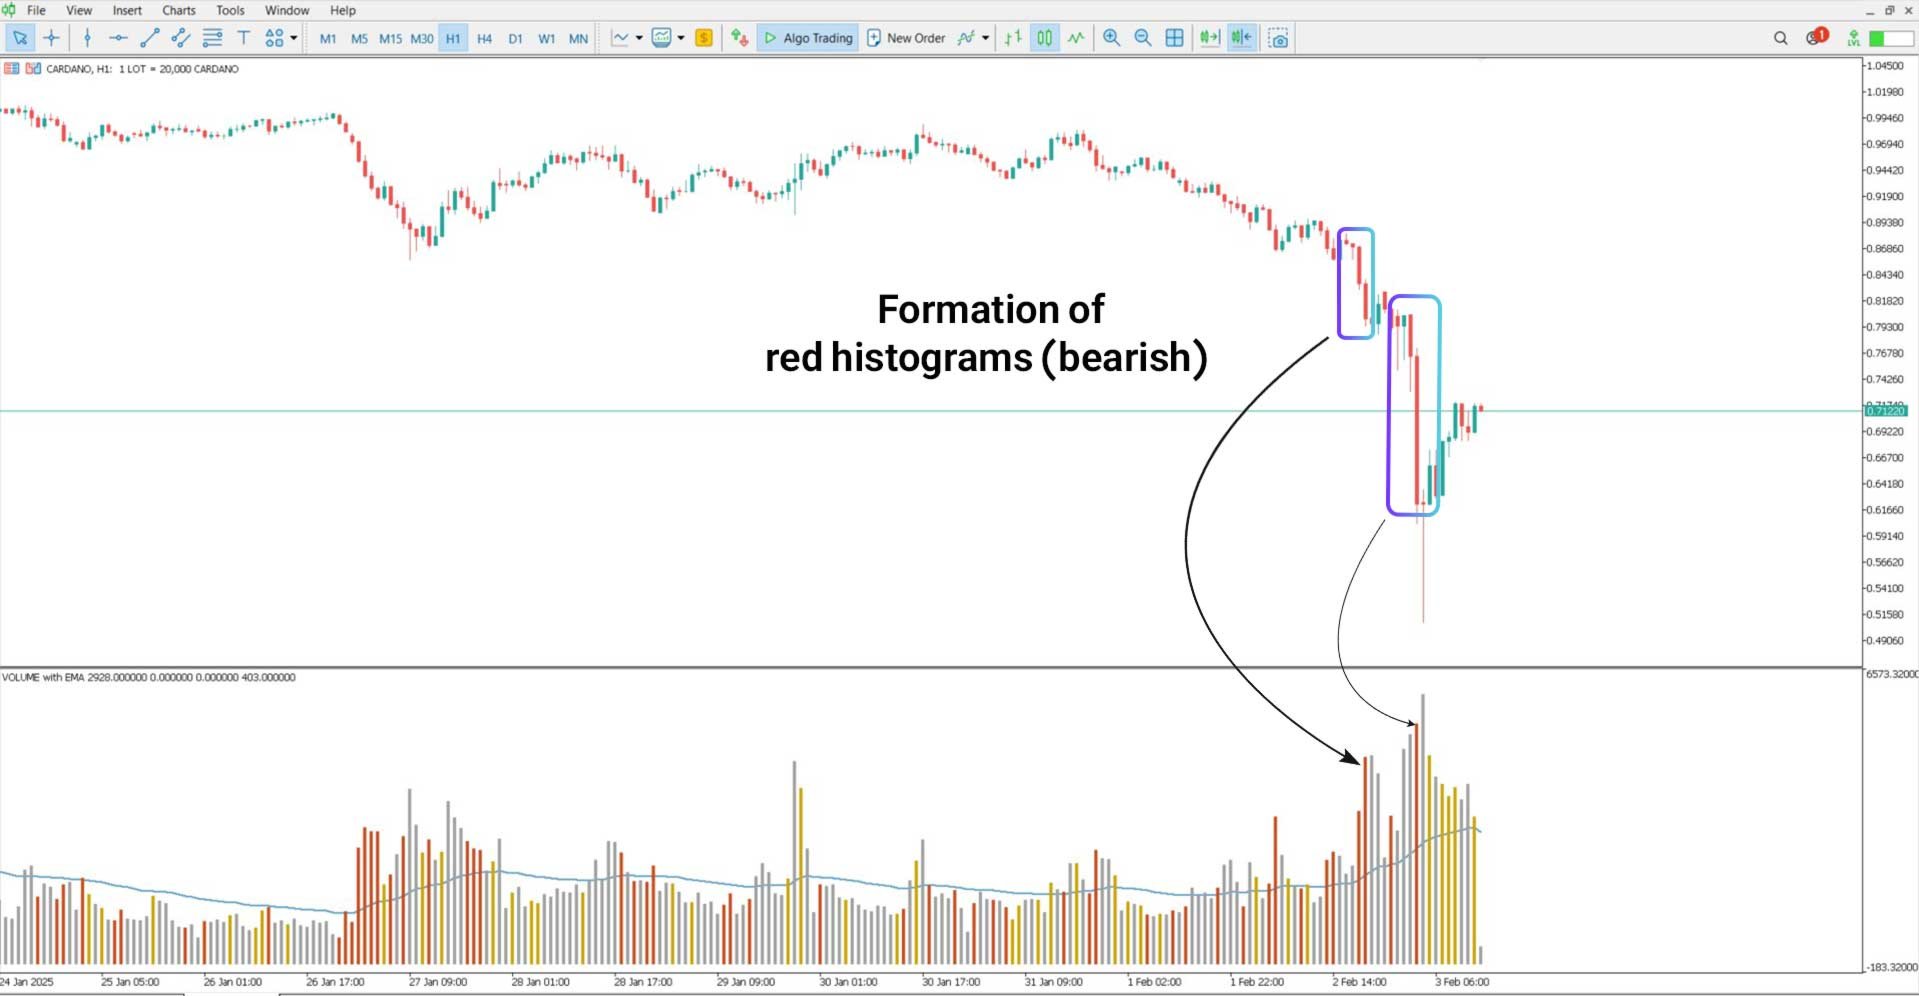
· Red bars represent bearish candles closing lower than the previous bar.
· Gray bars indicate low-momentum or neutral candles.
The histogram is plotted along with an Exponential Moving Average (EMA) line, which acts as a baseline to assess trend direction and volume momentum.
Bullish Trend
On the NZD/USD 30-minute chart, a cluster of yellow bars above the EMA line signifies rising bullish pressure. These yellow bars represent strong buyer activity, reinforcing a potential upward trend. Gray bars, in contrast, highlight periods of consolidation or indecision.
Bearish Trend
On the 1-hour Cardano (ADA) chart, large red histogram bars falling below the EMA line confirm a strong bearish trend. When these red bars increase in size and cross beneath the EMA, they reinforce continued selling pressure and trend momentum.
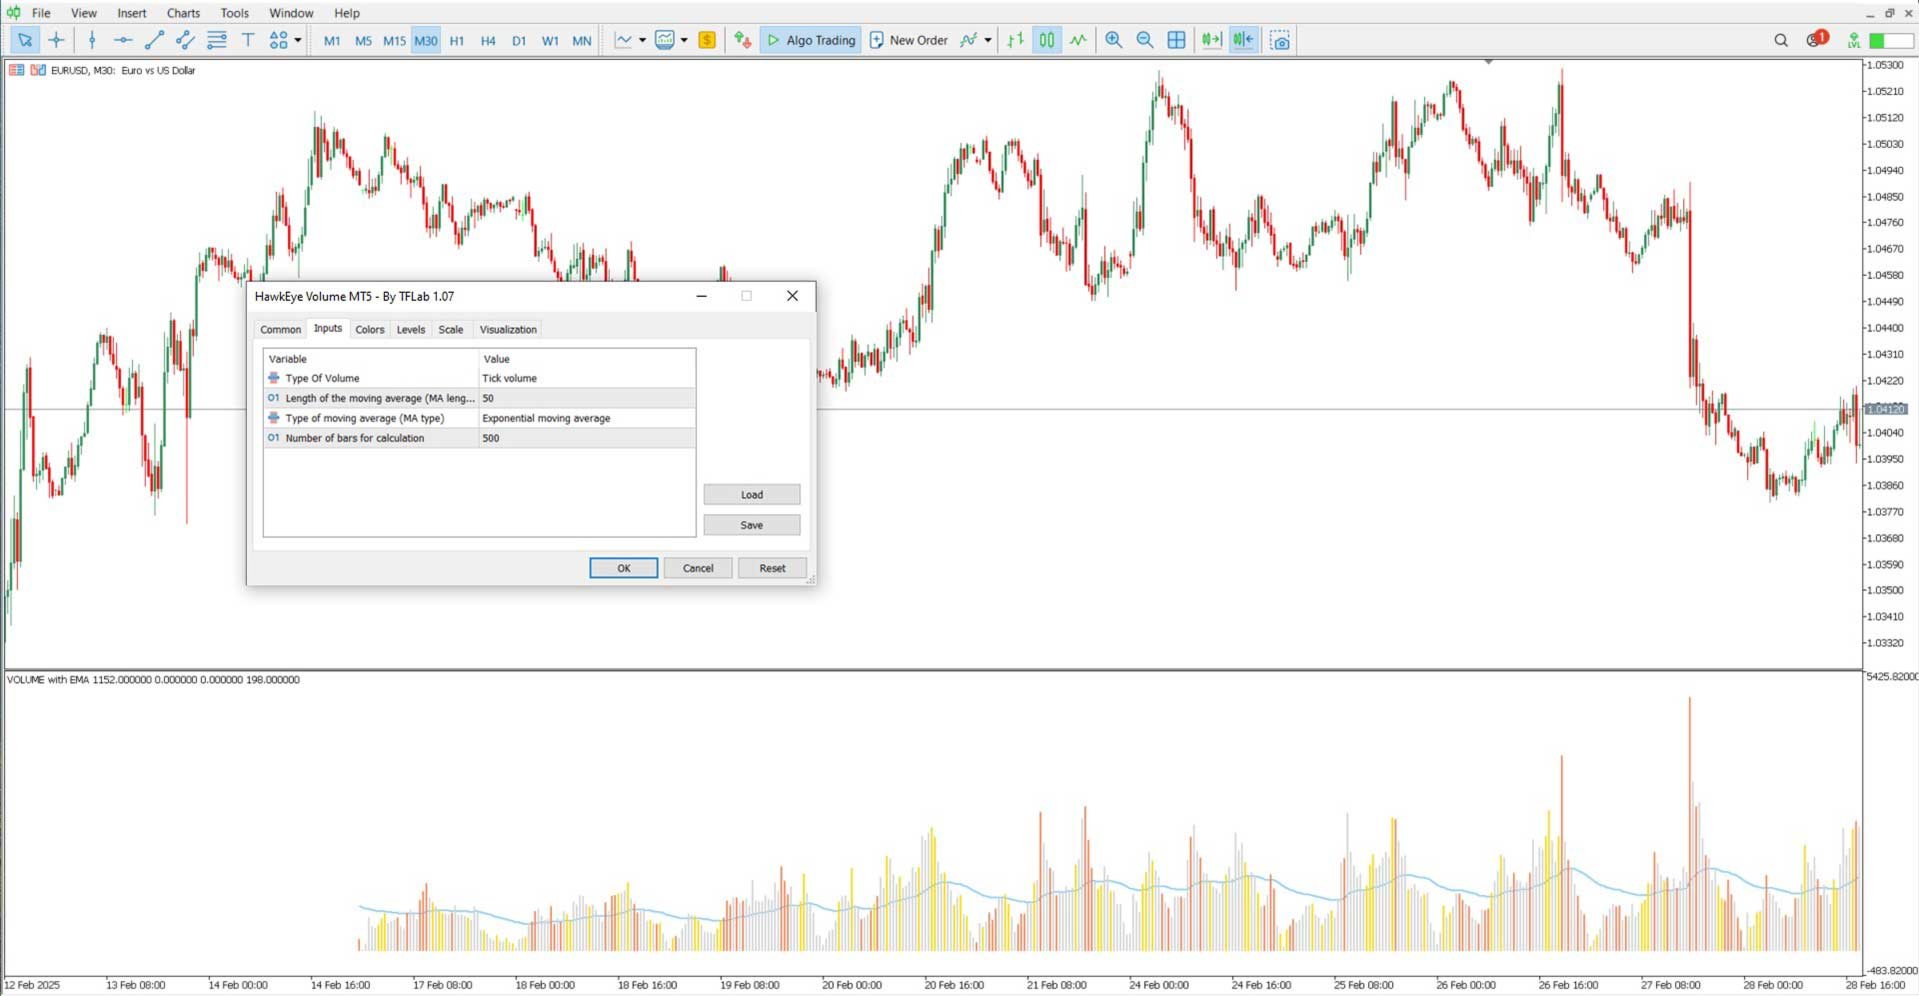
HawkEye Volume Indicator Settings
| Setting | Description |
| Type of Volume | Chooses between tick or real volume |
| Length of the Moving Average | Number of candles used for EMA calculation |
| Type of Moving Average | Defines the type of MA applied (e.g., EMA, SMA) |
| Number of Bars for Calculation | Total bars to be included in histogram analysis |
Conclusion
The HawkEye Volume Indicator for MT5 transforms standard volume analysis by introducing a visually intuitive histogram that reflects bullish and bearish market strength. It merges color-coded bars with a dynamic EMA baseline to deliver actionable insights on momentum and trend potential.
This indicator proves especially useful for intraday traders and scalpers looking to detect volume-based trend shifts, confirmations, or early reversal signs across any market instrument.