Enigmera MT5

3.67

ENIGMERA: Il nucleo del mercato
(Questo è un indicatore manuale e contiene funzioni che potrebbero non essere supportate dall’attuale ambiente di test di MetaTrader)

Introduzione
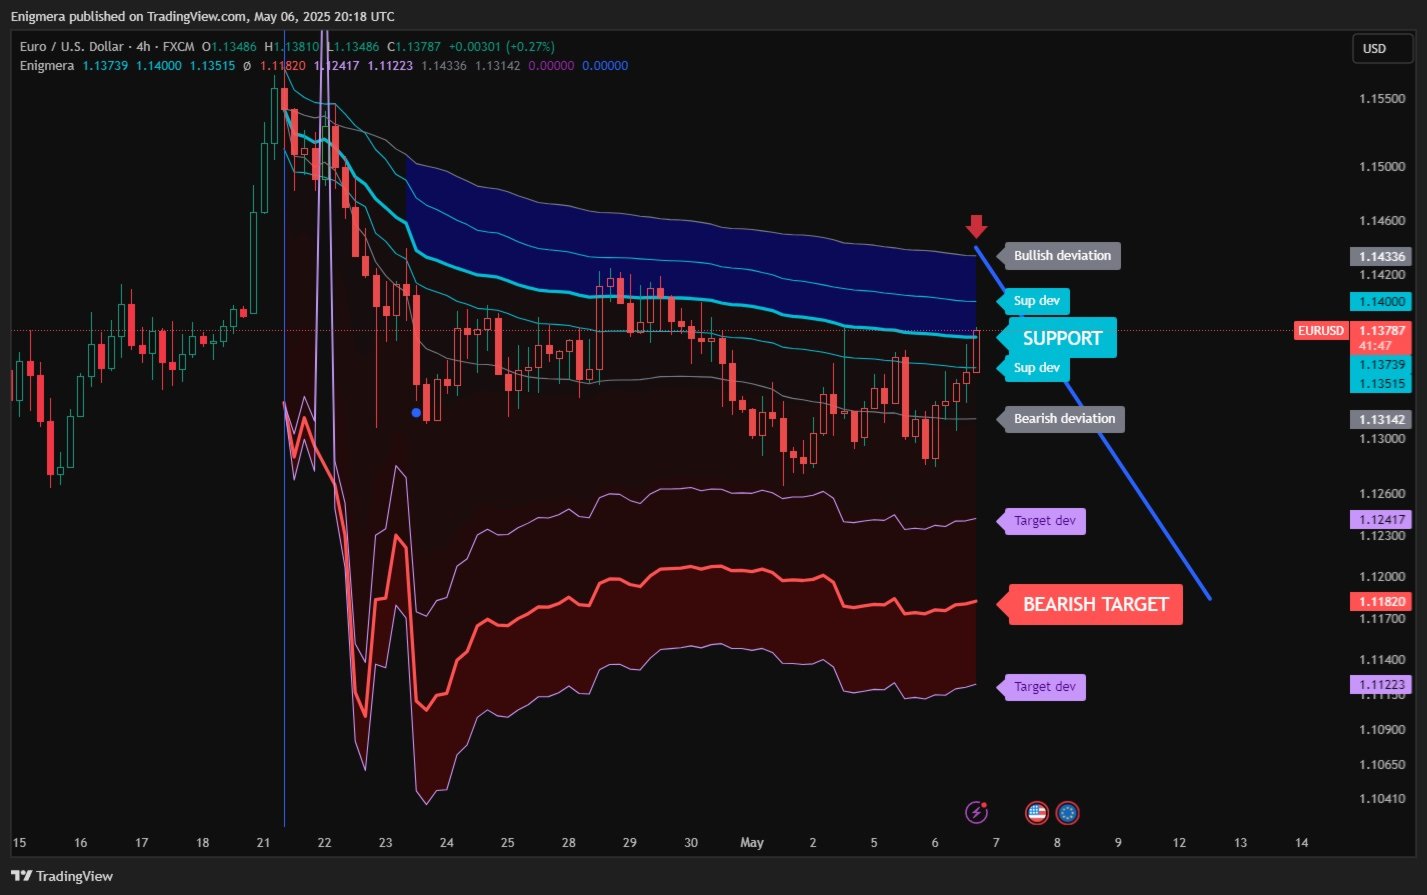
Questo indicatore e sistema di trading rappresentano un approccio unico ai mercati finanziari. ENIGMERA utilizza cicli frattali per calcolare con precisione i livelli di supporto e resistenza. Mostra la fase autentica di accumulazione e fornisce direzione e obiettivi. È un sistema che funziona sia in tendenza che in fase di correzione.

Come funziona
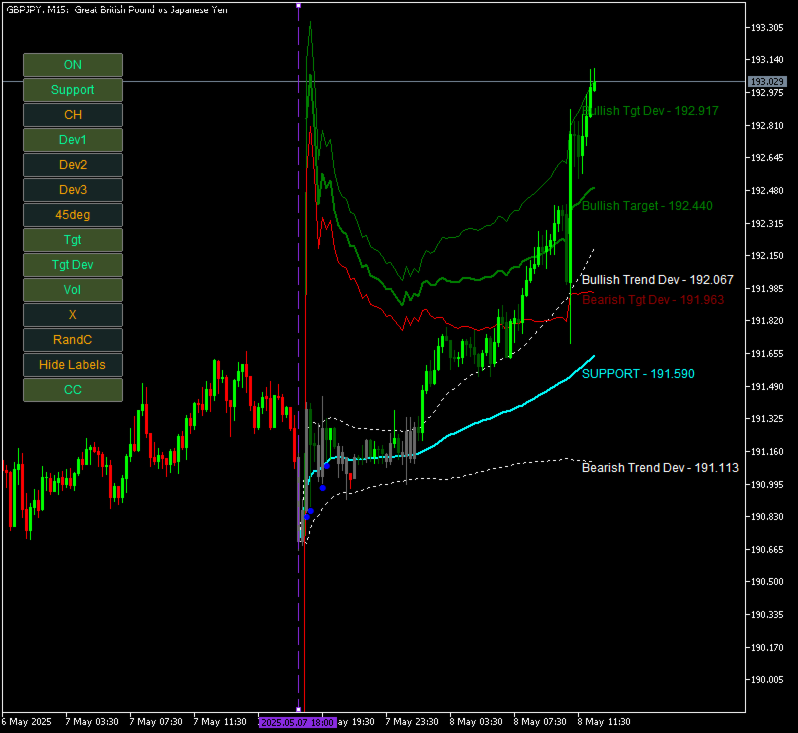
La maggior parte delle funzioni dell’indicatore è controllata da pulsanti situati sul lato sinistro del grafico, consentendo una risposta rapida alle diverse condizioni di mercato.

Pulsanti

ON/OFF – Mostra o nasconde l’intero indicatore.
Support – La linea principale di supporto del trend.
Ch – Attiva il canale di supporto, indicando il margine accettabile di deviazione.
Dev1 (Prima deviazione) – Indica il movimento del prezzo all’interno della deviazione di supporto, segnalando consolidamento o accumulo di forza.
Dev2 (Seconda deviazione) – Mostra il movimento del prezzo tra le deviazioni, segnalando la formazione e la direzione del trend.
Dev3 (Terza deviazione) – Indica una significativa accelerazione del trend e un’elevata volatilità.
45deg (45 gradi) – Mostra il ritmo e la stabilità del movimento rispetto alla linea a 45 gradi.
Tgt (Target) – La linea obiettivo del trend, che indica i livelli per la chiusura delle posizioni.
Tgt Dev – Il canale entro il quale può variare l’obiettivo di mercato.
Vol (Volume) – Mostra punti di volume sulle candele per indicare variazioni significative nei volumi di mercato.
X – Mostra una “X” quando il mercato raggiunge la linea obiettivo.
RandC (Colori casuali) – Cambia i colori delle linee e delle etichette dell’indicatore in modo casuale per una migliore visualizzazione.
Hide/Show Labels – Mostra o nasconde le etichette delle linee.
CC – Nuovo pulsante che, se premuto, colora di verde le candele sopra la linea di supporto, di rosso quelle sotto la linea e di grigio neutro quelle che la toccano. In questo modo, la condizione del mercato è chiaramente visibile.

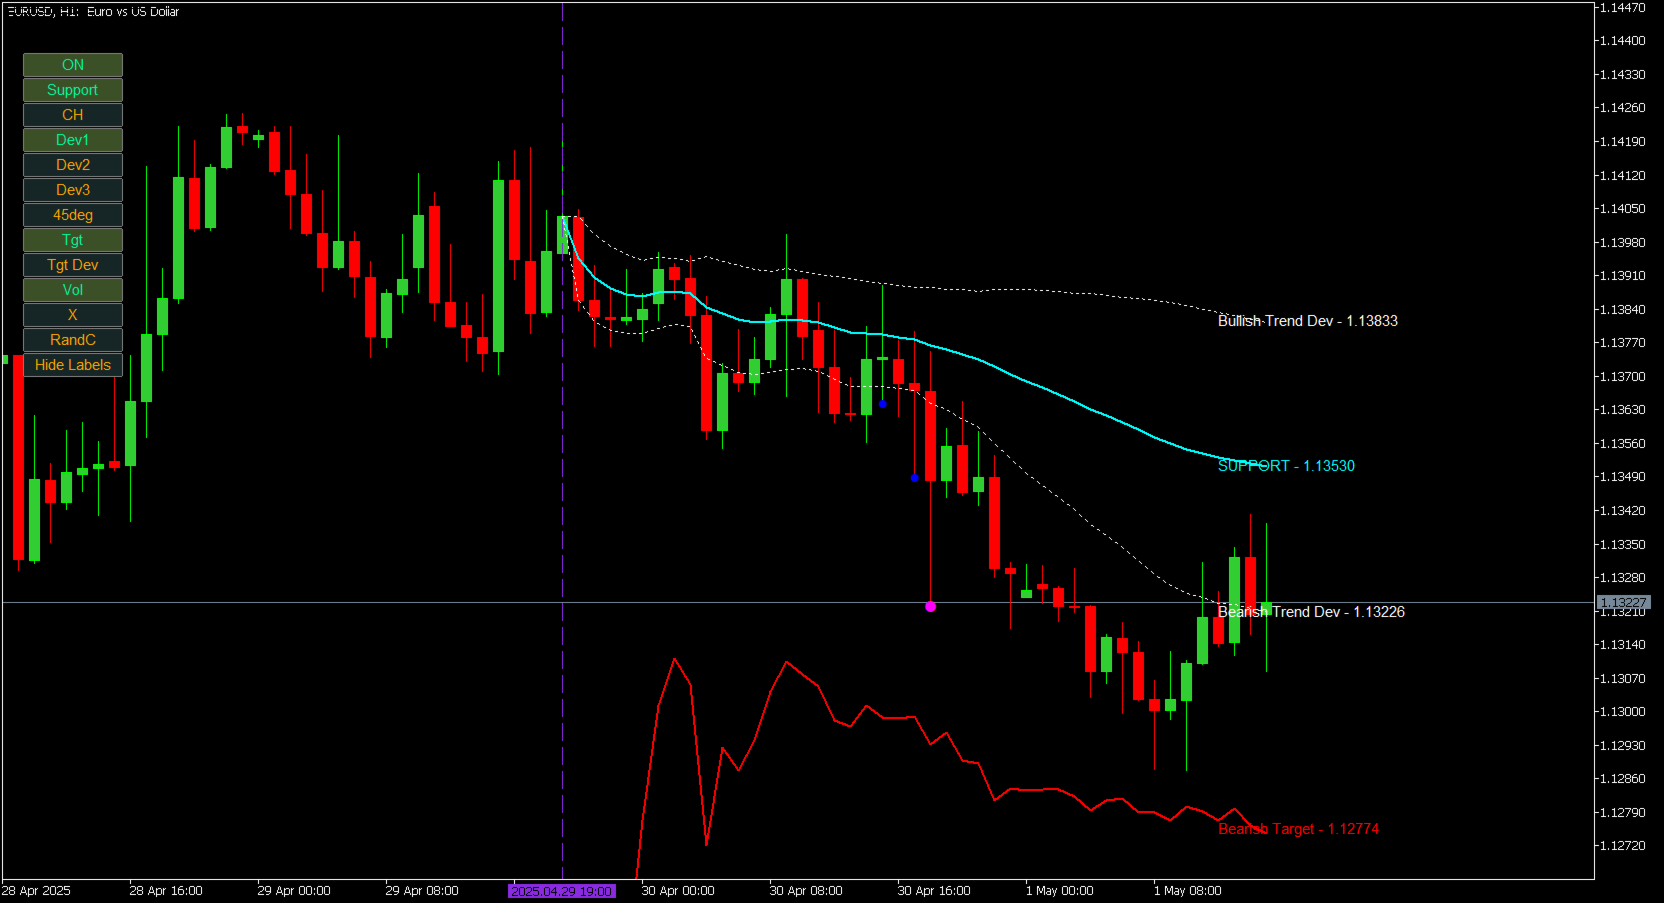
Il sistema fornisce una visione completa del presente, a differenza dei normali indicatori di mercato che si limitano a estrapolare i dati passati nel presente e nel futuro.
Se sei sul supporto, è un supporto reale; se sei sulla resistenza, è una resistenza reale. Una rottura del livello indica un cambiamento di trend.

ENIGMERA è progettato per analisti finanziari e consulenti che necessitano di informazioni affidabili da condividere con i clienti, nonché per investitori che richiedono la massima precisione e fiducia.

Si distingue per la sua precisione ottimale, permettendo ai trader di valutare le proprie scelte con chiarezza e sicurezza.

Combinando 20 anni di esperienza e conoscenza nel trading in un pacchetto completo, ENIGMERA è intuitivo ma dipende dall’utente. La sua efficacia si basa su una corretta configurazione per massimizzarne le prestazioni.

Raccomandazioni:

Coppie di valute: tutte le coppie, tutti i mercati
Timeframe: tutti i timeframe
Deposito minimo: nessuno
Tipo di conto: senza limitazioni
Broker: senza limitazioni

Questo sofisticato indicatore è ideale per strategie di day trading e scalping efficaci.
Ottimizza il tuo trading discrezionale con gli algoritmi avanzati di Enigmera, adatti a Forex, azioni, indici e criptovalute.
Progettato per MetaTrader 4, MetaTrader 5 e TradingView, Enigmera semplifica la gestione dello stop loss e del rischio.

Tutti gli strumenti di cui hai bisogno per diventare un trader di successo. Enigmera funziona su tutti i mercati e in tutti i timeframe, senza ridisegnarsi.

Prima di acquistare
Questo prodotto può essere testato direttamente nel MetaTrader Strategy Tester.
Ti consiglio vivamente di esplorarne il comportamento con i tuoi strumenti, timeframe e condizioni di mercato preferiti prima di prendere una decisione d’acquisto.

Hai domande o hai bisogno di chiarimenti?
Sentiti libero di inviarmi un messaggio privato su MQL5.
Sono disponibile per assisterti e fornirti indicazioni chiare affinché tu comprenda appieno ciò che il prodotto offre.

Scopri un mondo di saggezza nel trading. Sei pronto a portare le tue decisioni finanziarie al livello più alto?

Supporto completo, guida all’installazione e materiali bonus sono disponibili dopo l’acquisto.

Enigmera è disponibile per MT4.


Recensioni 3
Gabriel De Araujo Lobo
1329
Gabriel De Araujo Lobo 2025.06.18 15:48 
 

It's amazing how this works, excellent to add to strategies that use price action. Excellent attention given by the seller

Nath
161
Nath 2025.05.26 06:35 
 

This is the best indicator I have used to date. It is worth every dollar. Ivan promptly clarified all my 'humble' questions, supporting a very effective use of the indicator. He also provides a lot of supporting material. **Also available on Tradingview Ivan, thanks again, you genius!

Prodotti consigliati
Gartley Projections D
Oleksandr Medviediev
3 (2)
The indicator identifies the harmonic patterns (XABCD) according to developments of H.M.Gartley ( "Profits in the Stock Market" , 1935г). It projects D-point as a point in the perspective projection (specify ProjectionD_Mode = true in the settings). Does not redraw. When a bar of the working timeframe closes, if the identified pattern point has not moved during Patterns_Fractal_Bars bars, an arrow appears on the chart (in the direction of the expected price movement). From this moment on, the ar
MercariaPattern1-2-3 відстежує рух ціни, знаходить трьоххвильові структури 1-2-3 та підсвічує момент, коли сценарій підтверджується пробоєм ключового рівня. MercariaPattern1-2-3 tracks price movement, detects three-leg 1-2-3 structures and highlights the moment when the scenario is confirmed by a key level breakout. Індикатор збирає локальні свінги в компактну фігуру 0–1–2–3 , чекає підтвердженого пробою та будує стрілку входу з готовими рівнями SL/TP. The indicator combines local swings into a
Trade smarter, not harder: Empower your trading with Harmonacci Patterns This is arguably the most complete harmonic price formation auto-recognition indicator you can find for the MetaTrader Platform. It detects 19 different patterns, takes fibonacci projections as seriously as you do, displays the Potential Reversal Zone (PRZ) and finds suitable stop-loss and take-profit levels. [ Installation Guide | Update Guide | Troubleshooting | FAQ | All Products ] It detects 19 different harmonic pri
Matreshka
Dimitr Trifonov
5 (2)
Matreshka self-testing and self-optimizing indicator: 1. Is an interpretation of the Elliott Wave Analysis Theory. 2. Based on the principle of the indicator type ZigZag, and the waves are based on the principle of interpretation of the theory of DeMark. 3. Filters waves in length and height. 4. Draws up to six levels of ZigZag at the same time, tracking waves of different orders. 5. Marks Pulsed and Recoil Waves. 6. Draws arrows to open positions 7. Draws three channels. 8. Notes support and re
RBreaker
Zhong Long Wu
RBreaker Gold Indicators is a short-term intraday trading strategy for gold futures that combines trend following and intraday reversal approaches. It not only captures profits during trending markets but also enables timely profit-taking and counter-trend trading during market reversals. This strategy has been ranked among the top ten most profitable trading strategies by the American magazine   Futures Truth   for 15 consecutive years. It boasts a long lifecycle and remains widely used and st
This system is very useful for trading because it solves several classic problems: 1. Objectivity & Precision Benefit: It eliminates the trader's personal bias. Every trader might draw a trendline slightly differently, but this indicator uses a precise mathematical logic (Fractals) to find the pivot points. The resulting lines are objective and consistent every time. 2. ️ Dynamic Updates Benefit: Your chart is always current. As soon as a new pivot is confirmed, the new trendline is drawn au
Cumulative Volume Delta MAX MTF Pro v4.4 — Il vantaggio definitivo nel trading basato sui volumi Un solo indicatore per dominarli tutti: scopri cosa pensa DAVVERO il mercato Smetti di tirare a indovinare e inizia a capire cosa stanno facendo gli operatori istituzionali prima che il prezzo lo mostri. Il CVD MAX MTF Pro v4.4 rappresenta l'apice della tecnologia di analisi dei volumi, trasformando dati complessi in segnali chiari e operativi. Questa versione introduce la rilevazione chirurgica dell
ATrend
Zaha Feiz
4.82 (17)
"ATREND: Come funziona e come utilizzarlo" ### Come funziona L'indicatore "ATREND" per la piattaforma MT5 è progettato per fornire ai trader robusti segnali di acquisto e vendita utilizzando una combinazione di metodologie di analisi tecnica. Questo indicatore sfrutta principalmente l'Average True Range (ATR) per la misurazione della volatilità, insieme ad algoritmi di individuazione dei trend per identificare potenziali movimenti di mercato. Lascia un messaggio dopo l'acquisto e ricevi un rega
Overview Harmonic Patterns MT5 is a technical analysis indicator designed for the MetaTrader 5 platform. It identifies and displays harmonic price patterns, such as Butterfly, Cypher, Crab, Bat, Shark, and Gartley, in both bullish and bearish directions. The indicator calculates key price levels, including entry, stop loss, and three take-profit levels, to assist traders in analyzing market movements. Visual elements and customizable alerts enhance usability on the chart. Features Detects six ha
Introduction to Chart Pattern MT Chart Pattern MT is a chart pattern scanner to detect the triangle pattern, falling wedge pattern, rising wedge pattern, channel pattern and so on. Chart Pattern MT uses highly sophisticated chart pattern detection algorithm. However, we have designed it in the easy to use with intuitive user interface. Chart Pattern MT will show all the patterns in your chart in the most efficient format for your trading. You do not have to do tedious manual pattern detection an
WAPV Weis Wave Chart Forex
Eduardo Da Costa Custodio Santos
Il Weis Wave Chart Forex per MT5 è un indicatore di prezzo e volume. La lettura del prezzo e del volume è stata ampiamente diffusa tramite Richard Demille Wyckoff sulla base delle tre leggi da lui create: offerta e domanda, causa ed effetto e sforzo contro risultato. Già nel 1900 R.Wyckoff utilizzava la carta delle onde nelle sue analisi. Molti anni dopo, intorno al 1990, David Weis ha automatizzato il diagramma delle onde di R. Wyckoff e oggi vi portiamo l'evoluzione del diagramma delle onde di
Phantom Edge SMC
Nattapon Chuekamhod
Phantom Edge SMC — The Ultimate Smart Money Indicator for MT5 Tired of manually drawing structures while trading SMC or ICT concepts? Let Phantom Edge SMC do the heavy lifting for you. Key Features Internal & Swing Structure: Automatically detects BOS and CHoCH across two structural levels. Order Blocks (OB): Identifies Internal and Swing OBs with automated mitigation tracking. Equal Highs / Lows: Highlights EQH / EQL to pinpoint Liquidity pools. Fair Value Gaps (FVG): Displays FVGs with
The Expert Advisor and the video are attached in the Discussion tab . The robot applies only one order and strictly follows the signals to evaluate the indicator efficiency. Pan PrizMA CD Phase is an option based on the Pan PrizMA indicator. Details (in Russian). Averaging by a quadric-quartic polynomial increases the smoothness of lines, adds momentum and rhythm. Extrapolation by the sinusoid function near a constant allows adjusting the delay or lead of signals. The value of the phase - wave s
The Super Arrow Indicator provides non-repainting buy and sell signals with exceptional accuracy. Key Features No repainting – confirmed signals remain fixed Clear visual arrows: green for buy, red for sell Real-time alerts via pop-up, sound, and optional email Clean chart view with no unnecessary clutter Works on all markets: Forex, gold, oil, indices, crypto Adjustable Parameters TimeFrame Default:   "current time frame" Function:   Sets the time frame for indicator calculation Options:   Can
"Impulses and Corrections 5" is created to help traders navigate the market situation. The indicator shows multi-time frame upward and downward "Impulses" of price movements. These impulses are the basis for determining the "Base" , which is composed of zones of corrections of price movements, as well as "Potential" zones for possible scenarios of price movement. Up and down impulses are determined based on a modified formula of Bill Williams' "Fractals" indicator. The last impulse is always "U
Weis Wave Scouter
Jean Carlos Martins Roso
Scopri la potenza dell'analisi avanzata del volume con Weis Wave Scouter, un indicatore rivoluzionario per MetaTrader 5 che combina i principi comprovati del metodo Wyckoff e dell'analisi VSA (Volume Spread Analysis). Progettato per trader che cercano precisione e profondità nelle loro operazioni, questo indicatore offre una lettura tattica del mercato attraverso l'analisi delle onde di volume cumulativo, aiutando a individuare punti chiave di inversione e continuazione di tendenza. Weis Wave Sc
Elliott Wave MT5
Sathit Sukhirun
5 (1)
Teoria delle Onde di Elliott Automatizzata 1. Conteggio automatico e riduzione della soggettività Onde d'Impulso (1-2-3-4-5): Usa regole rigide per mostrare la struttura corretta. Onde Correttive (A-B-C): Aiuta a trovare opportunità di rientro nel trend. 2. Analisi Multi-Grado Analizza 3 livelli: Minor: Movimenti rapidi. Intermediate: Trend principale. Primary: Quadro generale. 3. Obiettivi di prezzo e Ingresso Proiezione di Fibonacci: Calcola i target futuri. Linee di Breakout: Mostra dove entr
Overview The Market Perspective Structure Indicator is a comprehensive MetaTrader indicator designed to provide traders with a detailed analysis of market structure across multiple timeframes. It identifies and visualizes key price action elements, including swing highs and lows, Break of Structure (BOS), Change of Character (CHOCH), internal structures, equal highs/lows, premium/discount levels, previous levels from higher timeframes, and trading session zones. With extensive customization opt
Professional Gold Trading Levels Indicator Features: - Daily & Weekly Pivot Points - Fibonacci Retracement Levels   - Round Number Levels - Customizable Colors & Fonts - Auto-Update Daily - Clean & Simple Interface Perfect for Gold (XAUUSD) traders Reliable Support/Resistance levels Lightweight & Fast Performance Easy to install and use Compatible with all MT5 accounts. No complex settings required! SimpleGoldLevels v1.0 - User Manual Professional Support & Resistance Levels
Gioteen Volatility Index (GVI) - your ultimate solution to overcoming market unpredictability and maximizing trading opportunities. This revolutionary indicator helps you in lowering your losing trades due to choppy market movements. The GVI is designed to measure market volatility, providing you with valuable insights to identify the most favorable trading prospects. Its intuitive interface consists of a dynamic red line representing the volatility index, accompanied by blue line that indicate
Introduction to X3 Chart Pattern Scanner X3 Cherart Pattern Scanner is the non-repainting and non-lagging indicator detecting X3 chart patterns including Harmonic pattern, Elliott Wave pattern, X3 patterns, and Japanese Candlestick patterns. Historical patterns match with signal patterns. Hence, you can readily develop the solid trading strategy in your chart. More importantly, this superb pattern scanner can detect the optimal pattern of its kind. In addition, you can switch on and off individu
The RSI Divergence + FVG Signal indicator combines Relative Strength Index (RSI) Divergence with Fair Value Gap (FVG) detection to generate high-probability buy and sell signals based on both momentum shifts and institutional imbalance zones. Core Features: RSI Divergence Detection : Identifies both regular and hidden bullish/bearish divergences between price and RSI. Divergences indicate potential trend reversals or continuation. FVG Zone Recognition : Detects Fair Value Gaps (imbalances caused
Elliott Wave Trend was designed for the scientific wave counting. This tool focuses to get rid of the vagueness of the classic Elliott Wave Counting using the guideline from the template and pattern approach. In doing so, firstly Elliott Wave Trend offers the template for your wave counting. Secondly, it offers Wave Structural Score to assist to identify accurate wave formation. It offers both impulse wave Structural Score and corrective wave Structure Score. Structural Score is the rating to sh
CosmiCLab SMC FIBO CosmiCLab SMC FIBO is a professional trading indicator designed for traders who use Smart Money Concepts (SMC), market structure analysis and Fibonacci retracement levels. The indicator automatically detects market swings and builds Fibonacci levels based on the latest impulse movement. It also identifies market structure changes such as BOS (Break of Structure) and CHOCH (Change of Character), helping traders understand the current market direction. CosmiCLab SMC FIBO also pr
Key level wedge MT5
Presley Annais Tatenda Meck
The   Key level wedge MT5   indicator automatically draws rising wedge pattern and falling wedge pattern for you on the chart. This pattern is really good when used as a confirmation entry at key support & resistance, supply & demand and reversal zones. Advantages  The   Key level wedge MT5   block DOES NOT RE-PAINT, giving you confidence when a signal appears and also helps when looking back.  The   Key level wedge MT5   includes an on/off button on the chart to easily keep the charts clean
The "MR Volume Profile Rectangles 5" indicator is a charting tool that displays trading volume at different price levels rather than time intervals. A key concept in volume profile is the point of control (POC) —the price level with the highest volume traded during the session or time range. While tools like VWAP or OBV provide volume trends, the "MR Volume Profile Rectangles 5" indicator offers granular detail about where the most market activity occurs at specific price levels. This makes it a
Innanzitutto, vale la pena sottolineare che questo Strumento di Trading è un Indicatore Non-Ridipingente, Non-Ridisegnante e Non-Laggante, il che lo rende ideale per il trading professionale. Corso online, manuale utente e demo. L'Indicatore Smart Price Action Concepts è uno strumento molto potente sia per i nuovi che per i trader esperti. Racchiude più di 20 utili indicatori in uno solo, combinando idee di trading avanzate come l'Analisi del Trader del Circolo Interno e le Strategie di Tradin
Nirvana trend
Aiireza Arjmandi Nezhad
5 (1)
Nirvana Trend — Indicatore di trend e framework di rischio basato su ATR Nota: Questo strumento fornisce esclusivamente informazioni analitiche e non garantisce, promette né suggerisce profitti, redditi o risultati specifici (incluso il superamento di valutazioni/challenge). La decisione d’uso e la responsabilità restano all’utente. Introduzione Nirvana Trend è un indicatore di analisi tecnica progettato per standardizzare il processo decisionale e migliorare la disciplina operativa. Grazie a s
Owl Smart Levels MT5
Sergey Ermolov
4.03 (32)
Versione MT4  |  FAQ L' indicatore Owl Smart Levels è un sistema di trading completo all'interno dell'unico indicatore che include strumenti di analisi di mercato popolari come i frattali avanzati di Bill Williams , Valable ZigZag che costruisce la corretta struttura a onde del mercato, e i livelli di Fibonacci che segnano i livelli esatti di entrata nel mercato e luoghi per prendere profitti. Descrizione dettagliata della strategia Istruzioni per lavorare con l'indicatore Consulente-assistente
STRICTLY FOR BOOM INDEX ONLY!!!!! Here I bring the Maximum Trend Arrows OT1.0 MT5 indicator. This indicator is made up of a combination of different trend indicators for entries and exits, for entries an orange arrow will paint on the chart below the current market and a red flag for closing of trades and it produces buy arrows only. When the orange arrow appears, it will appear along with it's sound to notify you. The 1H timeframe is recommended, don't use it anywhere else than on the 1H timefr
Gli utenti di questo prodotto hanno anche acquistato
AriX
Temirlan Kdyrkhan
1 (4)
AriX Indicator for MT5 A powerful trend-following and signal-evaluation tool AriX is a custom MT5 indicator that combines Moving Averages and ATR-based risk/reward logic to generate clear buy/sell signals. It visualizes dynamic SL/TP levels, evaluates past trade outcomes, and displays win/loss statistics in a clean on-chart panel. Key features include: Buy/Sell signals based on MA crossovers ATR-based SL/TP1/TP2/TP3 levels with visual lines and labels Signal outcome tracking with real-time stat
Azimuth Pro
Ottaviano De Cicco
5 (4)
LAUNCH PROMO Azimuth Pro price is initially set at 299$ for the first 100 buyers. Final price will be 499$ . THE DIFFERENCE BETWEEN RETAIL AND INSTITUTIONAL ENTRIES ISN'T THE INDICATOR — IT'S THE LOCATION. Most traders enter at arbitrary price levels, chasing momentum or reacting to lagging signals. Institutions wait for price to reach structured levels where supply and demand actually shift. Azimuth Pro maps these levels automatically: swing-anchored VWAP, multi-timeframe structure lines, an
ARIPoint
Temirlan Kdyrkhan
ARIPoint is a powerful trading companion designed to generate high-probability entry signals with dynamic TP/SL/DP levels based on volatility. Built-in performance tracking shows win/loss stats, PP1/PP2 hits, and success rates all updated live. Key Features: Buy/Sell signals with adaptive volatility bands Real-time TP/SL/DP levels based on ATR Built-in MA Filter with optional ATR/StdDev volatility Performance stats panel (Success, Profit/Loss, PP1/PP2) Alerts via popup, sound, push, or email Cu
CGE Trading Suite
Carl Gustav Johan Ekstrom
5 (1)
CGE Trading Suite delivers the analytical edge typically reserved for professional trading desks. The platform integrates a full suite of analytical tools into one seamless workflow: dynamic grid mapping, liquidity behavior analysis, ECM, trend lines, MIDAS, trade cycles, and directional channel projections. Together, these provide a unified view of market structure and momentum. Directional clarity is further enhanced by the capital flow index, which measures currency basket strength to identif
L'indicatore " Dynamic Scalper System MT5 " è progettato per il metodo di scalping, ovvero per il trading all'interno di onde di trend. Testato sulle principali coppie di valute e sull'oro, è compatibile con altri strumenti di trading. Fornisce segnali per l'apertura di posizioni a breve termine lungo il trend, con ulteriore supporto al movimento dei prezzi. Il principio dell'indicatore. Le frecce grandi determinano la direzione del trend. Un algoritmo per generare segnali per lo scalping sott
OmniSync Projection
Antonio-alin Teculescu
Chronos Fractal Engine is an innovative price projection indicator for MetaTrader 5, designed to transform your technical analysis by intelligently identifying and projecting historical price patterns. Built upon an advanced correlation algorithm and the fractal principles of the market, this powerful tool visualizes potential future price movements, giving you a unique edge in your trading decisions. What is Chronos Fractal Engine? At its core, the Chronos Fractal Engine employs a sophisticat
Pointer Trend Switch — precision trend reversal indicator Pointer Trend Switch is a high-precision arrow indicator designed to detect key moments of trend reversal based on asymmetric price behavior within a selected range of bars. It identifies localized price impulses by analyzing how far price deviates from the opening level, helping traders find accurate entry points before a trend visibly shifts. This indicator is ideal for scalping, intraday strategies, and swing trading, and performs equa
ARIScalping
Temirlan Kdyrkhan
ARIScalp is a powerful trading companion designed to generate high-probability entry signals with dynamic TP/SL/DP levels based on volatility. Built-in performance tracking shows win/loss stats, PP1/PP2 hits, and success rates all updated live. Key Features: Buy/Sell signals with adaptive volatility bands Real-time TP/SL/DP levels based on ATR Built-in MA Filter with optional ATR/StdDev volatility Performance stats panel (Success, Profit/Loss, PP1/PP2) Alerts via popup, sound, push, or email Cus
The Institutional Secret Method  represents a paradigm shift in market analysis, moving away from lagging indicators and into the realm of Topological Finance . It is engineered to decode the hidden geometry of price movement by calculating the most efficient path—the Geodesic —between current price action and institutional liquidity targets. The system views the market as a physical landscape where price is naturally drawn toward massive pools of liquidity (Stops). It uses two primary calculati
L’indicatore evidenzia le zone in cui viene dichiarato interesse sul mercato , per poi mostrare la zona di accumulo degli ordini . Funziona come un book degli ordini su larga scala . Questo è l’indicatore per i grandi capitali . Le sue prestazioni sono eccezionali. Qualsiasi interesse ci sia nel mercato, lo vedrai chiaramente . (Questa è una versione completamente riscritta e automatizzata – non è più necessaria un’analisi manuale.) La velocità di transazione è un indicatore concettualmente nuo
TrendMaestro5
Stefano Frisetti
Attenzione alle truffe, questo indicatore e' distribuito esclusivamente su MQL5.com nota: questo indicatore e' per METATRADER5, se vuoi la versione per  METATRADER4 questo e' il link:   https://www.mql5.com/it/market/product/108106 TRENDMAESTRO ver 2.5 TRENDMAESTRO   riconosce un nuovo TREND sul nascere, non sbaglia mai. La sicurezza di identificare un nuovo TREND non ha prezzo. DESCRIZIONE TRENDMAESTRO identifica un nuovo TREND sul nascere, questo indicatore prende in esame la volatilita' i
Weis Wave with Alert MT5
Trade The Volume Waves Single Member P.C.
4.94 (17)
Rental/Lifetime Package Options and Privileges  Rent Monthly Six Months   Yearly/Lifetime Weis Wave with Speed with Alert+Speed Index x x x Manual  x x x Quick Set up Video x x x Blog x x x Lifetime Updates x x x Setup and Training Material x x Discord Access Channel "The SI traders"          x Rectangle Break Alert Tool      x How to trade with it:    http://www.tradethevolumewaves.com   ** If you purchase please contact me to setup your  : Training Room and  complete manual access.  Wei
Rtc ML Ai Predictor
Muhammad Faisal Sagala
Rtc ML Ai | Predictor CORE MACHINE LEARNING ENGINE Adaptive ML Market Predictor – Multi-Bar Trend & Candle Forecast What This Indicator Does This indicator is a  real-time market prediction engine  designed to analyze price behavior and estimate  future market tendencies . Unlike conventional indicators, this system  does not rely on static parameters or historical curve-fitting , but adapts its internal state dynamically during live market operation. Instead of using static rules, the indic
Jita Indicator Pro MT5 | All Timeframes Professional Trend Agreement System – Premium Edition ($500) What Is Jita Indicator Pro? Jita Indicator Pro is a structured trend-confirmation system designed for serious traders who value precision, alignment, and controlled signal behavior. It combines: Advanced band-based trend direction logic ATR-driven structural trigger engine Dual-confirmation agreement system Locked history update design This indicator prints signals only when multiple conditions
Recommended TimeFrame >= H1. 100% Non Repainted at any moment.  Use it carefully, only with Trend Direction. Trading Usage: 2 Variants: as Range System or as BreakOut System (Both Only With Trend Direction)::: (Always use StopLoss for minimise Risk); [1] as Range System: (Recommended) in UP TREND:  - BUY in Blue Line , then if price goes down by 50 points (on H1) open Second BUY.   Close in any Profit you wish: TrailingStop(45 points) or Close when Price touches upper Gold Line. in DOWN TREND
Max Ribbon Mt5
Stefano Frisetti
ATTENZIONE: Questo indicatore è distribuito ESCLUSIVAMENTE su MQL5.com Versione MT4:   https://www.mql5.com/it/market/product/160363 Versione MT5:   https://www.mql5.com/it/market/product/160410 ================================================================================ MAX RIBBON ver 1.00 L'indicatore che ti mostra il TREND in modo chiaro e inequivocabile! ================================================================================ DESCRIZIONE MAX RIBBON è un indicatore di trend
AlgoEAs Trend Dashboard V1 Indicator for MT5 Introduction: This is a Dashboard Indicator based on 7 built in Multi Timeframe indicators. This strategy gives Buy/Sell Ideas based on 9 trend states. Easy to view gas guage to view current trend. Has as optional Alerts to enable with 9 messages. Run on M15 chart, with M15, H1, and H4 indicator time frames. Great tool! Features: Non-Repainting Dashboard For Desktop MT5 Only, Works On Any Mt5 Pair Great for Intraday and Swing Trading Easy view gas
IVISTscalp5
Vadym Zhukovskyi
5 (6)
What's new about iVISTscalp5 forecast indicator (Version 10)? iVISTscalp5 is a unique nonlinear forecasting for a week ahead system for any financial instrument which executes fast scalping using time levels. iVISTscalp5 is a tool for easy study and understanding of financial market. 1) iVISTscalp5 forecast indicator has been completely rewritten into another programming language (C++), which has accelerated data loading and processing. As a result, a different graphical display of forecasts
+++++++++++++++++++++++++++++++++++++++++++++++++++++++++++++++++++++++++++++++++++++++++++++++++ +++ Link to EURUSD Only Free Version -->  https://www.mql5.com/en/market/product/156904?source=Unknown +++++++++++++++++++++++++++++++++++++++++++++++++++++++++++++++++++++++++++++++++++++++++++++++++ Hallo Trader, This is a traditional GANN & FIBONACCI strategy based on detection of an impulsive move in the opposite direction. This is called a Breakout. At the moment of Breakout, the indicator draw
Big Player Range
Thalles Nascimento De Carvalho
5 (3)
BigPlayerRange – Il miglior indicatore per MT5 BigPlayerRange è considerato il miglior indicatore per Mini Indice e Mini Dollaro su MetaTrader 5. Questo strumento essenziale evidenzia le zone strategiche di azione dei grandi player, offrendo un’analisi tecnica istituzionale di altissima precisione. Come usare BigPlayerRange: Questo indicatore mostra zone di acquisto (linea verde) e di vendita (linea rossa). Quando il prezzo chiude fuori da queste aree, è probabile un movimento di tendenz
Ottieni l’indicatore AUX GRATUITO, il supporto EA e la guida completa, visita per favore – https://www.mql5.com/en/blogs/post/763955 Individua la tendenza. Leggi il pattern. Cronometra l'ingresso. 3 passaggi in meno di 30 secondi! Opera senza sforzo — nessuna analisi richiesta, il tuo assistente intelligente è pronto a semplificare il tuo flusso di lavoro Basta sovraccarico di grafici. Opera con fiducia utilizzando il rilevamento intelligente del bias. Compatibile con tutte le valute, criptova
From The Sons comes the Alpha. Our intention is to bridge institutional with retail analysis just to ensure level ground at affordable rates for us all.  The Mathematical Inevitability of Alpha: ATHENA x PROMETHEUS = Predator Pulse AI (Alpha)  In the global theater of finance, the "retail trader" is often just liquidity for the giants. To survive, you don't need a better indicator; you need a fundamental shift in how you perceive reality. The ATHENA x PROMETHEUS system is not a tool—it is a mat
Strumento per market maker. Meravith: Analizzerà tutti i timeframe e mostrerà il trend attualmente in corso. Evidenzierà le zone di liquidità (equilibrio dei volumi) dove i volumi rialzisti e ribassisti sono uguali. Mostrerà tutti i livelli di liquidità dei diversi timeframe direttamente sul grafico. Genererà e presenterà un’analisi di mercato testuale a scopo di riferimento. Calcolerà obiettivi, livelli di supporto e punti di stop-loss in base al trend attuale. Calcolerà il rapporto rischio/ren
Frontier Pivots
Nestor Jose Mendez Boza
FRONTIER PIVOTS - Geometric Levels Indicator This indicator plots support and resistance levels/ranges on the chart using mathematical calculations. It helps traders identify potential price reaction zones based on geometric patterns. Main Features: Automatically calculates and displays key price levels Plots both support and resistance lines Uses daily price data for level calculation Clean visual presentation with different colors for different level types No repainting - levels remain static
Hunter Spike
Jaime Humberto Gomez Arias
Hunter Spike This indicator consists of two regression channels calibrated with the current movement of the synthetic index algorithm, for any Deriv or Weltrade broker. Each channel has a signal, a target that alerts us when the price touches them, indicating buys on booms or gains and sells on crashes or pains. -configuration for booms or gains: Channel zone 1 (30) Channel zone 2 (0) -configuration for crashes or pains: Channel zone 1 (100) Channel zone 2 (70) Zones freely configurable by
Pantera Indicator
Temirlan Kdyrkhan
5 (1)
A tool for on-chart strategy backtesting and performance analysis. A utility for developing, debugging, and testing custom trading ideas and indicator functions. An indicator designed to quickly test trading concepts and visualize the effectiveness of different input parameters. An all-in-one sandbox for testing everything from simple crossovers to complex, multi-condition trading systems.
VTrende Pro
Andrii Diachenko
5 (1)
VTrende Pro - MTF indicator for trend trading with a display panel for MT5 *** Videos can be translated into any language using subtitles (video language - Russian) Although the signals of the VTrende Pro indicator can be used as signals of a full-fledged trading system, it is recommended to use them in conjunction with the Bill Williams TS. VTrende Pro is an extended version of the VTrende indicator. Difference between Pro version and VTrende: - Time zones - Signal V - signal 1-2 waves -    S
FXLAND Smart Reversal Indicator (MT5) FXLAND Smart Reversal Indicator is a professional technical analysis tool designed to help traders identify potential price reversal zones and key market turning points with clarity and precision. The best reversal indicator and price return by choosing only one ceiling or floor in each time frame A masterpiece of combining mathematics and Gann, fractal matrix, Fibonacci, movement angle and time. Completely intelligent Key Features Detects potenti
WanaScalper
Isaac Wanasolo
1 (1)
A scalping indicator based on mathematical patterns, which on average gives signals with relatively small SL, and also occasionally helps to catch big moves in the markets (more information in the video) This indicator has three main types of notifications: The first type warns of a possible/upcoming signal on the next bar The second type indicates the presence of a ready signal to enter the market/open a position The third type is for SL and TP levels - you will be notified every time price re
Historical Similarity Matcher Indicator (HI.SI.MA) Try it free today — demo version now available!   https://www.mql5.com/en/market/product/167114 Overview The Historical Similarity Matcher is a technical analysis indicator for MetaTrader 5. It scans historical price data to find segments that show statistical similarity to a user-selected reference period on the chart.
Altri dall’autore
RSI Divergence Pulse è un indicatore RSI completo che combina rilevazione di divergenze, analisi multi-timeframe e strumenti visivi in un'unica applicazione leggera. Identifica automaticamente divergenze Regolari e Nascoste, mostra un pannello RSI Multi-Timeframe in tempo reale, riempie le zone OB/OS per il riconoscimento visivo, disegna linee di divergenza sia sul grafico dei prezzi che nella sott finestra RSI, posiziona frecce Buy/Sell e fornisce avvisi in tempo reale. Features Color-Coded RS
Meravith
Ivan Stefanov
5 (3)
Strumento per market maker. Meravith: Analizzerà tutti i timeframe e mostrerà il trend attualmente in corso. Evidenzierà le zone di liquidità (equilibrio dei volumi) dove i volumi rialzisti e ribassisti sono uguali. Mostrerà tutti i livelli di liquidità dei diversi timeframe direttamente sul grafico. Genererà e presenterà un’analisi di mercato testuale a scopo di riferimento. Calcolerà obiettivi, livelli di supporto e punti di stop-loss in base al trend attuale. Calcolerà il rapporto rischio/ren
MACD divergency
Ivan Stefanov
4.5 (6)
Questo indicatore identifica con precisione le divergenze rialziste e ribassiste tra i movimenti di prezzo e l’istogramma MACD, utilizzando medie mobili esponenziali (EMA) con periodi di 5 (veloce) e 34 (lenta) e una linea di segnale con periodo 5. L’indicatore mette in evidenza i punti in cui il momentum si indebolisce, segnalando possibili inversioni di trend. Regole per la corretta identificazione delle divergenze La divergenza rialzista è valida quando il prezzo forma massimi crescenti e l’i
FREE
L’indicatore evidenzia le zone in cui viene dichiarato interesse sul mercato , per poi mostrare la zona di accumulo degli ordini . Funziona come un book degli ordini su larga scala . Questo è l’indicatore per i grandi capitali . Le sue prestazioni sono eccezionali. Qualsiasi interesse ci sia nel mercato, lo vedrai chiaramente . (Questa è una versione completamente riscritta e automatizzata – non è più necessaria un’analisi manuale.) La velocità di transazione è un indicatore concettualmente nuo
MERAVITH SCANNER è un indicatore professionale per i mercati finanziari su MetaTrader 5, che integra più strumenti di analisi in un unico sistema. Esegue tutti i calcoli automaticamente utilizzando una metodologia proprietaria basata sul prezzo medio ponderato per il volume (VWAP), eliminando completamente l’interpretazione soggettiva. L’indicatore funziona su tutte le classi di asset (Forex, Azioni, Indici, Commodities, Criptovalute) e su tutti i timeframe, da M1 a Mensile. Il principio fondame
Horizont
Ivan Stefanov
Horizont è un sistema di trading che fornisce una configurazione completa di operazione: punto di ingresso, target 1, target 2 e stop loss, tutti calcolati automaticamente. Il sistema identifica automaticamente i massimi e i minimi del mercato e li collega per definire il trend attuale. Lei seleziona quale trend tradare e Horizont genera i relativi livelli di ingresso, target e stop. Il sistema include una gestione automatica del rischio. Controlla il saldo del conto, calcola il rischio e sugge
Questo indicatore è uno strumento interattivo di etichettatura delle Onde di Elliott per MetaTrader 4 e 5. Consente all’utente di posizionare manualmente le etichette delle onde direttamente sul grafico, selezionando la dimensione dell’etichetta, il colore e il tipo di onda (correzioni ABC, impulsi a 5 onde o strutture WXY) da un menu sul grafico. Con un solo clic sul grafico, l’indicatore posiziona in modo sequenziale le etichette delle onde appropriate nel prezzo e nel tempo scelti, aiutando i
FREE
Meravith AUTO
Ivan Stefanov
5 (1)
Meravith Auto è una versione automatizzata del sistema di trading Meravith. L'indicatore è composto da una linea di tendenza che cambia colore. Quando è rialzista è verde, quando è ribassista è rossa. Questa è la linea di supporto del trend. Una linea di liquidità, dove il volume rialzista è uguale al volume ribassista. Una linea di deviazione rialzista tripla. Una linea di deviazione ribassista tripla. Punti viola e blu che indicano un volume elevato. Il punto viola indica un volume maggiore di
Oscillatore di momentum avanzato che regola automaticamente il suo periodo in base alla volatilità del mercato per segnali di ipercomprato e ipervenduto più accurati. Come Funziona: L'indicatore utilizza un calcolo del periodo adattivo che si riduce durante l'alta volatilità e si allunga durante la bassa volatilità. Questa regolazione dinamica fornisce segnali più rapidi quando il mercato è in trend e riduce i falsi segnali durante le fasi di lateralità. Il valore RSI viene calcolato sulla base
FREE
Meravith Auto è una versione automatizzata del sistema di trading Meravith. L'indicatore è composto da una linea di tendenza che cambia colore. Quando è rialzista è verde, quando è ribassista è rossa. Questa è la linea di supporto del trend. Una linea di liquidità, dove il volume rialzista è uguale al volume ribassista. Una linea di deviazione rialzista tripla. Una linea di deviazione ribassista tripla. Punti viola e blu che indicano un volume elevato. Il punto viola indica un volume maggiore di
Questo indicatore è uno strumento interattivo di etichettatura delle Onde di Elliott per MetaTrader 4 e 5. Consente all’utente di posizionare manualmente le etichette delle onde direttamente sul grafico, selezionando la dimensione dell’etichetta, il colore e il tipo di onda (correzioni ABC, impulsi a 5 onde o strutture WXY) da un menu sul grafico. Con un solo clic sul grafico, l’indicatore posiziona in modo sequenziale le etichette delle onde appropriate nel prezzo e nel tempo scelti, aiutando i
FREE
Imbalance Pro
Ivan Stefanov
5 (4)
L'indicatore misura lo squilibrio tra tori e orsi in un periodo scelto e mostra una linea retta tra i due punti. Se i tori hanno più volume degli orsi, la linea diventa verde.  Se gli orsi hanno più volume, la linea diventa rossa. La linea mostra anche la differenza percentuale di volume. L'indicatore mostra gli stessi dati in una finestra separata. È possibile vedere anche il volume diviso. L'indicatore ha due modalità. A tale scopo, in alto a sinistra è presente un pulsante che,  - se n
Strumento per market maker. Meravith: Analizzerà tutti i timeframe e mostrerà il trend attualmente in corso. Evidenzierà le zone di liquidità (equilibrio dei volumi) dove i volumi rialzisti e ribassisti sono uguali. Mostrerà tutti i livelli di liquidità dei diversi timeframe direttamente sul grafico. Genererà e presenterà un’analisi di mercato testuale a scopo di riferimento. Calcolerà obiettivi, livelli di supporto e punti di stop-loss in base al trend attuale. Calcolerà il rapporto rischio/ren
Uno dei pochi indicatori che calcola i livelli esclusivamente in base al prezzo. L’indicatore non è influenzato dai timeframe, dai trend o dai cicli di mercato. Uno degli indicatori più logici mai creati. L’indicatore FIFTY è ora disponibile in una versione automatica, che elimina la necessità di tracciare manualmente i livelli. Questa versione disegna automaticamente sul grafico i livelli giornalieri, settimanali, mensili e annuali, garantendo precisione e risparmio di tempo. Inoltre, sono pres
Naturu
Ivan Stefanov
5 (1)
“Naturu” è un indicatore manuale che utilizza la simmetria della natura come algoritmo. Conquista il mercato con una strategia semplice e saggezza nascosta! Quando carichi l’indicatore, vedrai due linee: Top e Bottom. Clicca una volta su una linea per attivarla. Per spostarla, basta cliccare sulla candela dove vuoi posizionarla. Definisci un punto alto e un punto basso, e l’indicatore calcola automaticamente: Una zona magenta che mostra dove gli interessi di tori e orsi sono più vicini, ossia l
Sense
Ivan Stefanov
5 (2)
SENSE è un sistema automatizzato che combina metodi GANN selezionati con calcoli frattali. Il sistema ci dice dove aprire e chiudere le operazioni. Non è più necessario perdere tempo in calcoli complessi: SENSE fa tutto per voi. Basta installare l'indicatore. Principi di base: Il mercato è rialzista quando il prezzo è al di sopra delle linee bianche. Comprate sopra le linee bianche, fermatevi sotto Le linee verdi sono obiettivi al rialzo Il mercato è ribassista quando il prezzo è al di sott
Separated Volume
Ivan Stefanov
5 (1)
Questo indicatore separa efficacemente il volume dei tick nel mercato forex in categorie rialziste e ribassiste. Inoltre, fornisce la funzionalità di calcolare e visualizzare la somma dei volumi dei tick rialzisti e ribassisti per qualsiasi periodo selezionato a scelta. È possibile regolare facilmente il periodo spostando le due linee blu sul grafico, consentendo un'analisi dei volumi personalizzabile e precisa, adatta alle proprie esigenze di trading. Se lo trovate utile, le vostre recensio
FREE
Two Snakes
Ivan Stefanov
5 (1)
2 SNAKES è un sistema di scalping di prima classe. Poiché gli inserimenti sono piuttosto precisi, è probabile che diventiate dipendenti da questo sistema molto rapidamente.  Avete 2 serpenti. Quando vedete una candela al di sopra o al di sotto di esse che non le tocca, questo è il vostro segnale di scalping. Se si utilizza un time frame più ampio, lo scalping può diventare trend following. Le serpentine sono calcolate con precisione in relazione allo stato attuale del mercato. NON SONO me
Enigmera
Ivan Stefanov
5 (8)
ENIGMERA: Il cuore del mercato Importante: La demo di MQL5.com funziona nel Strategy Tester e potrebbe non riflettere completamente le funzionalità di Enigmera. Consulta la descrizione, gli screenshot e il video per maggiori dettagli. Non esitare a inviarmi un messaggio se hai domande! Il codice dell'indicatore è stato completamente riscritto. La versione 3.0 aggiunge nuove funzionalità e corregge i bug accumulati dall'inizio dell'indicatore. Introduzione Questo indicatore e sistema di trading
Levelss
Ivan Stefanov
5 (1)
L'indicatore LEVELSS mostra: - Zona rialzista e ribassista giornaliera. È visibile tutti i giorni dalle 00:00 alle 23:59.  - La zona rialzista e ribassista settimanale. È visibile da lunedì 0:00 a venerdì 23:59 ogni settimana. - Canale appositamente calcolato da un timeframe specifico che viene visualizzato su tutti gli altri timeframe. Per impostazione predefinita, si tratta del timeframe a 4 ore, che può essere modificato in qualsiasi altro timeframe si desideri operare. Viene calcolato senz
GANN Master
Ivan Stefanov
5 (1)
Gli obiettivi precisi di GANN sono calcolati secondo i suoi metodi collaudati e presentati chiaramente davanti a te. Questo strumento è progettato per rendere il trading più fluido e intuitivo. Spostando la linea bianca verso l'alto o quella verde verso il basso, capirai subito perché le tecniche di GANN rimangono influenti nel mondo del trading. Le strategie di GANN si concentrano sulla previsione dei movimenti di mercato con grande precisione, e questo strumento porta quel potere a portata di
Stefanov
Ivan Stefanov
The indicator displays support and resistance zones defined logically using the MACD. The entire concept is explained in the video, with specific examples shown. The indicator works on any instruments and timeframes. It does not repaint. After placing it on the chart, please go through all the timeframes sequentially, from monthly to 1-minute, so that all lines load correctly. After that, you can start using it. The concept is unique and has not been seen in other systems or indicators.
Fifty Pro
Ivan Stefanov
5 (1)
L'indicatore FIFTY è ora disponibile in una versione automatizzata, eliminando la necessità di tracciare manualmente i livelli. Questa versione disegna automaticamente i livelli giornalieri, settimanali, mensili e annuali sul grafico, garantendo precisione e risparmiando tempo. Inoltre, sono presenti pulsanti per attivare o disattivare la visibilità di questi livelli, offrendo una personalizzazione completa. Per chi lo preferisce, la versione gratuita dell'indicatore rimane disponibile e complet
Naturu MT4
Ivan Stefanov
“Naturu” è un indicatore manuale che utilizza la simmetria della natura come algoritmo. Conquista il mercato con una strategia semplice e saggezza nascosta! Quando carichi l’indicatore, vedrai due linee: Top e Bottom. Clicca una volta su una linea per attivarla. Per spostarla, basta cliccare sulla candela dove vuoi posizionarla. Definisci un punto alto e un punto basso, e l’indicatore calcola automaticamente: Una zona magenta che mostra dove gli interessi di tori e orsi sono più vicini, ossia l’
MACD Divergence Pulse — Scanner intelligente di divergenze con istogramma a 4 colori, avvisi e dashboard. DESCRIZIONE BREVE Indicatore MACD professionale con rilevamento automatico di divergenze regolari e nascoste, istogramma dinamico a 4 colori, frecce Buy/Sell, etichette segnali, dashboard in tempo reale e avvisi multicanale. Funziona su qualsiasi simbolo e timeframe. DESCRIZIONE COMPLETA
RSI Divergence Pulse — Smart Divergence Scanner with MTF Panel, Zone Fill, Alerts & Dashboard SHORT DESCRIPTION Professional RSI indicator with automatic Regular & Hidden divergence detection, color-coded RSI line, Multi-Timeframe panel, OB/OS zone fills, Buy/Sell arrows, signal labels, real-time dashboard, and multi-channel alerts. Works on any symbol and timeframe. FULL DESCRIPTION
Livelli leggendari di William Gann in un indicatore MT5 completamente automatizzato. GANN Master individua le zone chiave in cui il prezzo è più probabile che si inverta o continui il trend, basandosi sui dati Daily, Weekly e Monthly. Funzionalità principali Pulsanti a clic singolo per il periodo: clicca Daily, Weekly o Monthly per tracciare istantaneamente le zone relative al giorno, alla settimana o al mese correnti Modalità Automatica e Manuale • Automatica: GANN Master calcola tutti i livell
SPEKULATOR è un sistema di trading manuale e un indicatore che ti aiuta a identificare le zone di supporto chiave e la direzione del mercato. Padroneggia il mercato con una strategia semplice e una saggezza nascosta. Selezioni un qualsiasi TOP e BOTTOM nel grafico, e l'indicatore disegna: Una zona di supporto per il tuo trend. Per una tendenza rialzista, appare una zona verde; per una tendenza ribassista, una zona rossa. La sensibilità della zona di supporto può essere regolata nelle impostazion
MACD Divergence Pulse — Scanner intelligente di divergenze con istogramma a 4 colori, avvisi e dashboard. DESCRIZIONE BREVE  Indicatore MACD professionale con rilevamento automatico di divergenze regolari e nascoste, istogramma dinamico a 4 colori, frecce Buy/Sell, etichette segnali, dashboard in tempo reale e avvisi multicanale. Funziona su qualsiasi simbolo e timeframe. DESCRIZIONE COMPLETA
Filtro:
Gabriel De Araujo Lobo
1329
Gabriel De Araujo Lobo 2025.06.18 15:48 
 

It's amazing how this works, excellent to add to strategies that use price action. Excellent attention given by the seller

Vasyl Daki
508
Vasyl Daki 2025.06.16 18:55 
 

I bought this indicator mostly because of the reviews because I couldn't test it with the demo version to the full extent. After the purchase, I started checking the system's operation on history. During the check, I found that the indicator gives weak results. My first observation concerns the fact that after the trend has changed and I notice it and of course I set the indicator to the top point of the beginning of the downward trend at the next price touch of the main support line and the formation of a pattern for concluding a deal to sell in 50% of cases the market turns around and goes against the pattern or makes a deep correction that confuses the indicator and it can create a false pattern that creates new losses, the same applies to patterns to buy. When working with this indicator, there is no sense of control over the market. That is, there is some interval where the indicator works very well, but then there comes an interval where the indicator shows bad results. I still couldn't understand what its advantage is and how you can make money with it. In my opinion, its price is 40 dollars. If the author thinks otherwise he can write a program for a profitable robot based on this indicator, I would be happy to test this robot.

Ivan Stefanov
6556
Risposta dello sviluppatore Ivan Stefanov 2025.06.18 12:38
Dear Mr. Daki, I deeply regret your dissatisfaction; however, the facts of our interactions clearly indicate a different situation. Immediately after your purchase, I proactively provided extensive support, offering multiple channels (email, Telegram) to clarify any questions. Despite several attempts to help you, you consistently refused to provide any concrete examples or screenshots of your claimed issues, making it impossible to assist you effectively. When I offered a full refund, you supplied inconsistent payment details with multiple conflicting identities—first a Bulgarian name, then an Arabic one, and later cryptocurrency addresses in romanian language—raising legitimate concerns about the authenticity of your claims. Enigmera is a proven system, highly rated and validated by numerous satisfied traders. Each customer requesting a trial receives full access to test thoroughly before buying. Your allegation that testing was impossible is false and contradicts clear evidence. Moreover, records show that you never downloaded a demo from the location of your purchase (Norway), which raises further doubts about your claims to have tested the system thoroughly. Given your pattern of threats and suspicious behavior, I have escalated this issue to mql5.com for further investigation. Transparency and integrity are fundamental to my practice. Any interested parties may request full documentation of our communication to verify the truthfulness of my statements. Regards, Ivan Stefanov Enigmera Support
Nath
161
Nath 2025.05.26 06:35 
 

This is the best indicator I have used to date. It is worth every dollar. Ivan promptly clarified all my 'humble' questions, supporting a very effective use of the indicator. He also provides a lot of supporting material. **Also available on Tradingview Ivan, thanks again, you genius!

Rispondi alla recensione