Enigmera MT5

3.67

ENIGMERA: Piyasanın özü
(Bu, manuel bir indikatördür ve bazı özellikler mevcut MetaTrader test ortamı tarafından desteklenmeyebilir)

Giriş
Bu indikatör ve ticaret sistemi, finansal piyasalara benzersiz bir yaklaşım sunar. ENIGMERA, destek ve direnç seviyelerini hassas bir şekilde hesaplamak için fraktal döngüler kullanır. Gerçek bir birikim (akümülasyon) aşamasını gösterir ve yön ile hedefleri belirtir. Hem trend hem de düzeltme dönemlerinde çalışan bir sistemdir.

Nasıl çalışır
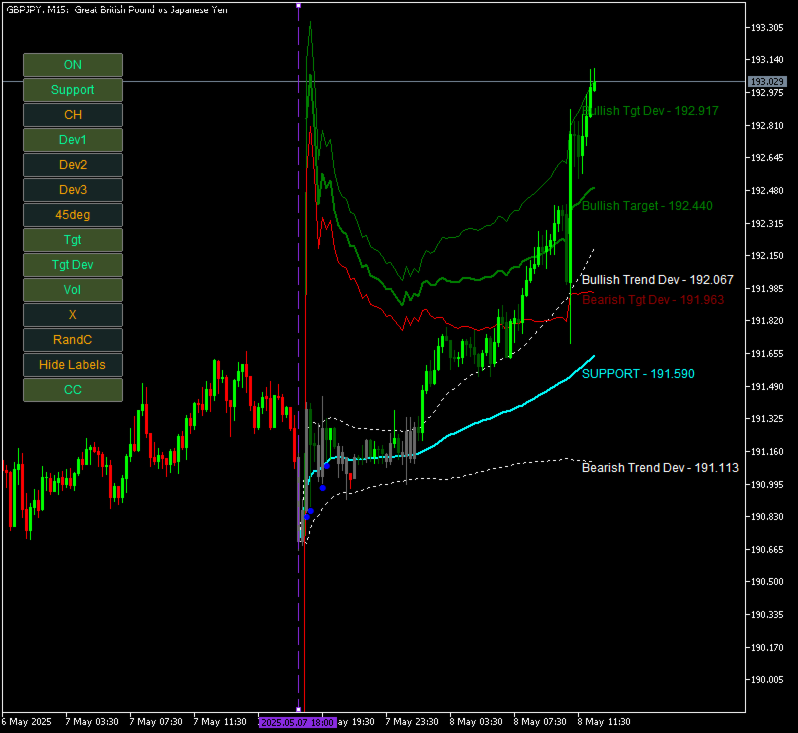
İndikatörün çoğu işlevi, grafiğin sol tarafındaki düğmeler aracılığıyla kontrol edilir. Bu sayede farklı piyasa koşullarına hızlı şekilde uyum sağlanabilir.

Düğmeler

ON/OFF – Tüm indikatörü gösterir veya gizler.
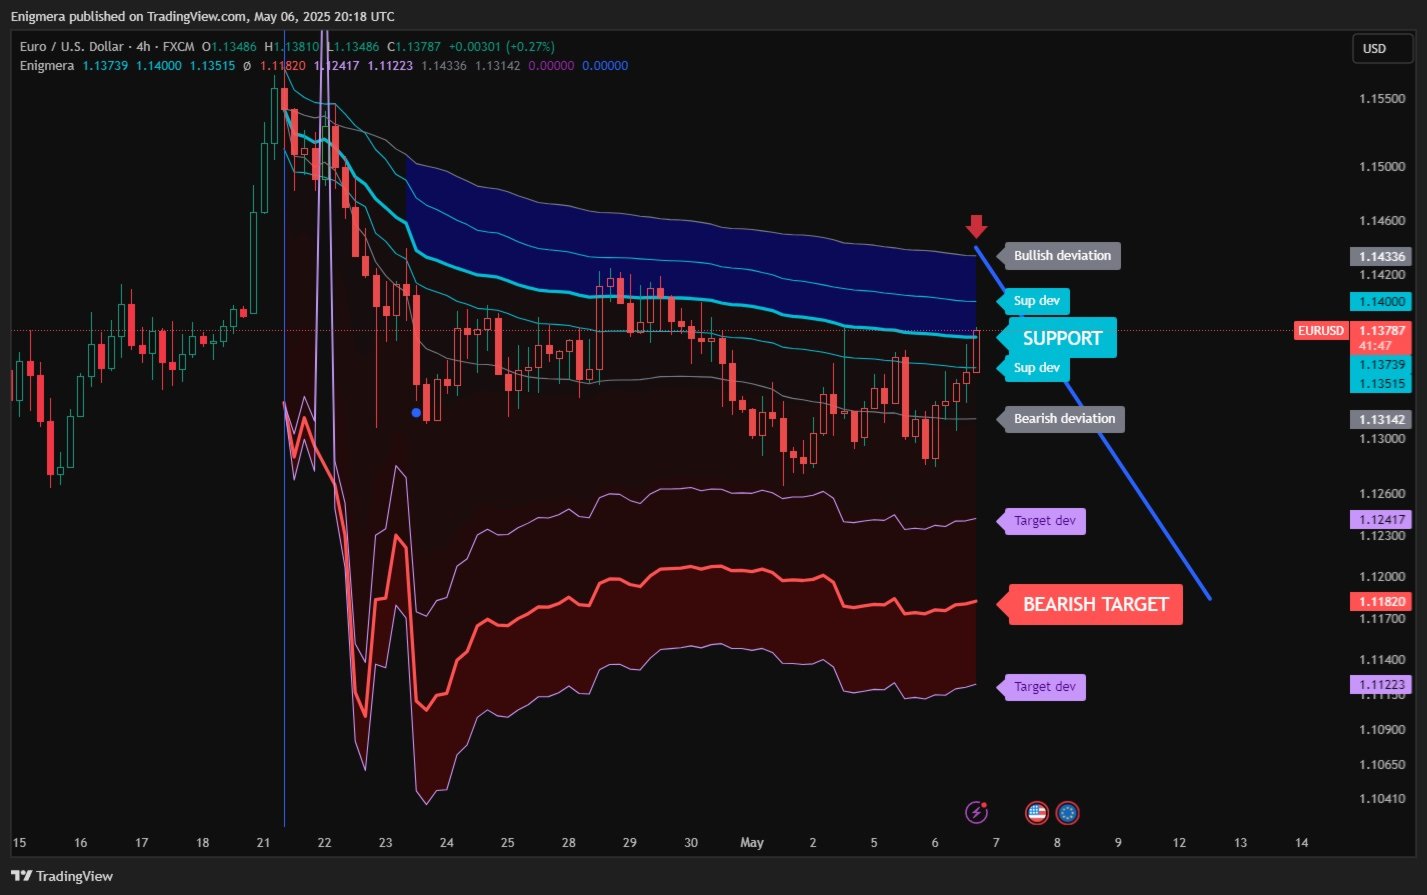
Support – Trendin ana destek çizgisi.
Ch – Destek kanalını etkinleştirir ve kabul edilebilir sapma aralığını gösterir.
Dev1 (Birinci sapma) – Fiyatın destek alanı içindeki hareketini gösterir; piyasanın güç topladığını veya konsolide olduğunu işaret eder.
Dev2 (İkinci sapma) – Fiyatın sapmalar arasındaki hareketini gösterir; trend oluşumu ve yönü hakkında bilgi verir.
Dev3 (Üçüncü sapma) – Trendin hızlandığını ve volatilitenin arttığını gösterir.
45deg (45 derece) – Piyasanın hızını ve 45 derecelik çizgiye göre hareket istikrarını gösterir.
Tgt (Hedef) – Trendin hedef çizgisi; pozisyon kapatılacak seviyeleri belirtir.
Tgt Dev – Piyasa hedefinin değişebileceği kanal.
Vol (Hacim) – Mumlar üzerinde hacim noktalarını gösterir; piyasa hacmindeki önemli değişiklikleri işaret eder.
X – Piyasa hedef çizgisine ulaştığında “X” işaretini gösterir.
RandC (Rastgele renkler) – Çizgilerin ve etiketlerin renklerini rastgele değiştirir; görsel farkındalığı artırır.
Hide/Show Labels – Çizgi etiketlerini gösterir veya gizler.
CC – Yeni bir düğmedir; etkinleştirildiğinde destek çizgisinin üzerindeki mumlar yeşil, altındakiler kırmızı, çizgiye dokunanlar ise nötr gri renkte görünür. Böylece piyasa durumu görsel olarak açıkça izlenebilir.

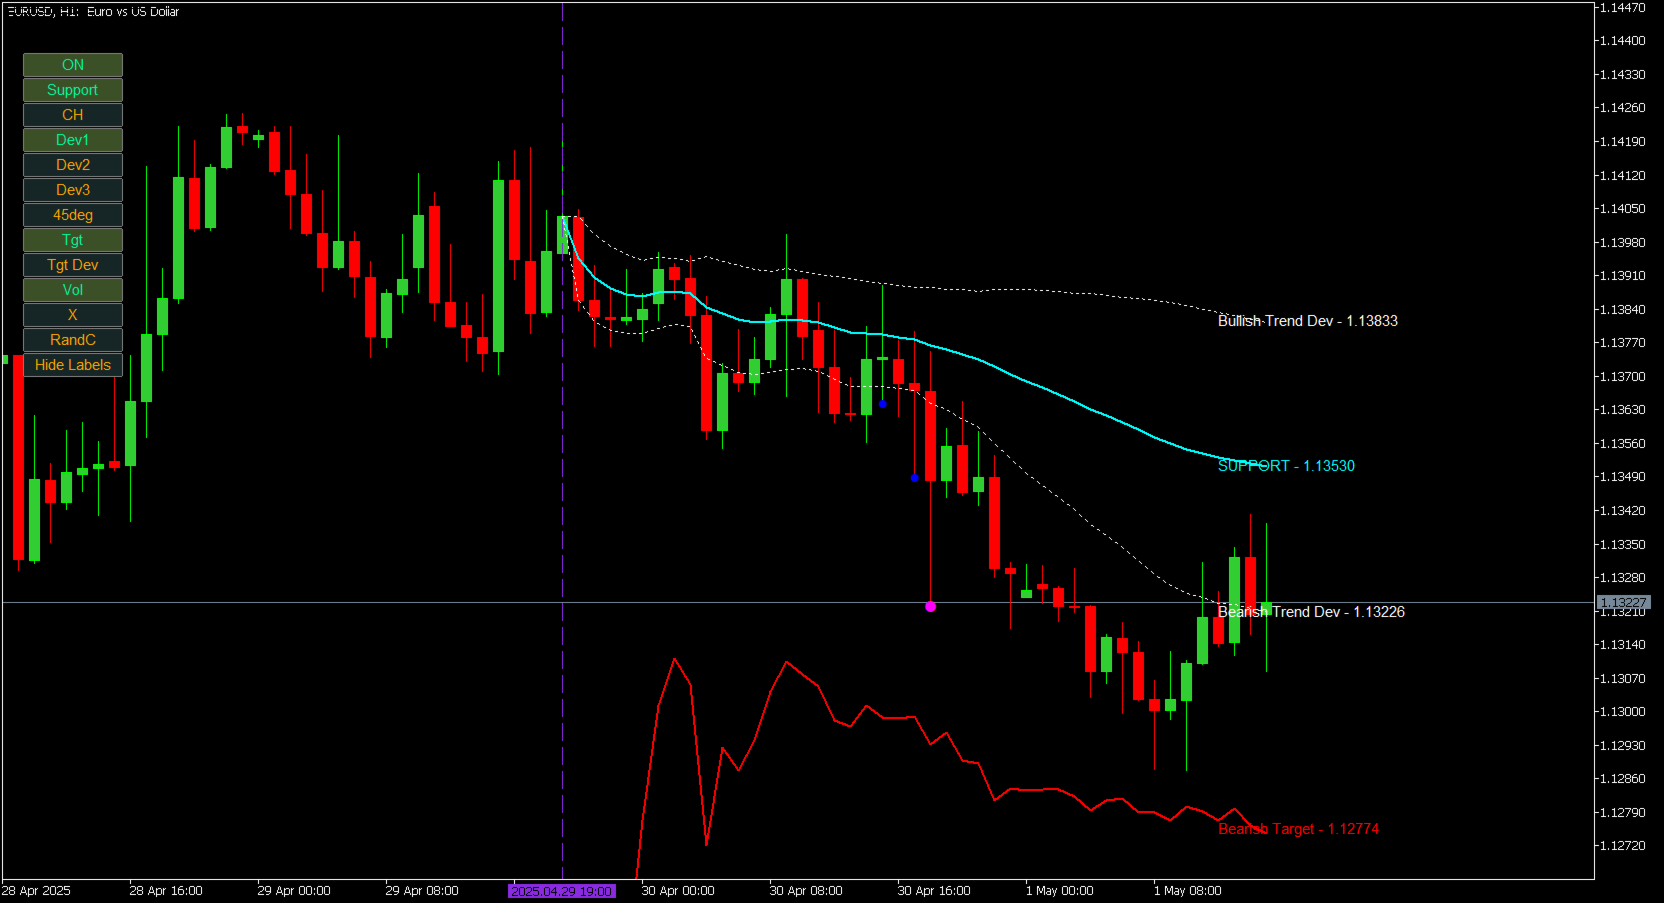
Bu sistem, piyasanın mevcut durumunu tam olarak gösterir. Geçmiş verileri sadece bugüne ve geleceğe yansıtan klasik indikatörlerden farklıdır.
Destek üzerindeyseniz, bu gerçek bir destektir; direnç üzerindeyseniz, bu gerçek bir dirençtir. Bir seviyenin kırılması trend değişimini gösterir.

ENIGMERA, müşterilerine güvenilir analizler sunmak isteyen finansal analistler ve danışmanlar ile maksimum hassasiyet ve güven arayan yatırımcılar için tasarlanmıştır.

Yüksek doğruluğu sayesinde, trader’ların net ve güvenli kararlar vermesine yardımcı olur.

20 yıllık ticaret deneyimi ve bilgi birikimini tek bir pakette birleştiren ENIGMERA, sezgisel bir yapıya sahiptir ancak doğru kullanıcı ayarlarına bağlı olarak en yüksek performansı gösterir.

Öneriler:

Parite: Tüm pariteler, tüm piyasalar
Zaman dilimi: Tüm zaman dilimleri
Minimum depozito: Gerekli değildir
Hesap türü: Sınırsız
Broker: Sınırsız

Bu gelişmiş indikatör, etkili günlük (day trading) ve scalping stratejileri için idealdir. Enigmera’nın gelişmiş algoritmaları ile Forex, hisse senetleri, endeksler ve kripto piyasalarında işlemlerinizi optimize edin. MetaTrader 4, MetaTrader 5 ve TradingView için tasarlanmıştır ve stop-loss ile risk yönetimini kolaylaştırır.

Başarılı bir trader olmanız için gereken tüm araçlar burada. Enigmera tüm piyasalarda ve tüm zaman dilimlerinde çalışır — yeniden çizim (repaint) yapmaz.

Satın almadan önce
Bu ürün doğrudan MetaTrader Strateji Test Cihazı’nda test edilebilir.
Satın alma kararı vermeden önce, tercih ettiğiniz araçlar, zaman dilimleri ve piyasa koşullarıyla nasıl davrandığını test etmenizi şiddetle tavsiye ederim.

Sorularınız mı var veya açıklamaya mı ihtiyacınız var?
MQL5 üzerinden bana özel mesaj gönderebilirsiniz.
Ürünü tamamen anlamanızı sağlamak için size açık ve detaylı rehberlik sunmaktan memnuniyet duyarım.

Ticaret bilgeliğinin dünyasını keşfedin. Finansal kararlarınızı en üst seviyeye çıkarmaya hazır mısınız?

Satın alma sonrası tam destek, kurulum rehberi ve bonus materyaller sunulmaktadır.

Enigmera MT4 için mevcuttur.


Değerlendirmeler 3
Gabriel De Araujo Lobo
1329
Gabriel De Araujo Lobo 2025.06.18 15:48 
 

It's amazing how this works, excellent to add to strategies that use price action. Excellent attention given by the seller

Nath
161
Nath 2025.05.26 06:35 
 

This is the best indicator I have used to date. It is worth every dollar. Ivan promptly clarified all my 'humble' questions, supporting a very effective use of the indicator. He also provides a lot of supporting material. **Also available on Tradingview Ivan, thanks again, you genius!

Önerilen ürünler
Gartley Projections D
Oleksandr Medviediev
3 (2)
The indicator identifies the harmonic patterns (XABCD) according to developments of H.M.Gartley ( "Profits in the Stock Market" , 1935г). It projects D-point as a point in the perspective projection (specify ProjectionD_Mode = true in the settings). Does not redraw. When a bar of the working timeframe closes, if the identified pattern point has not moved during Patterns_Fractal_Bars bars, an arrow appears on the chart (in the direction of the expected price movement). From this moment on, the ar
MercariaPattern1-2-3 відстежує рух ціни, знаходить трьоххвильові структури 1-2-3 та підсвічує момент, коли сценарій підтверджується пробоєм ключового рівня. MercariaPattern1-2-3 tracks price movement, detects three-leg 1-2-3 structures and highlights the moment when the scenario is confirmed by a key level breakout. Індикатор збирає локальні свінги в компактну фігуру 0–1–2–3 , чекає підтвердженого пробою та будує стрілку входу з готовими рівнями SL/TP. The indicator combines local swings into a
Trade smarter, not harder: Empower your trading with Harmonacci Patterns This is arguably the most complete harmonic price formation auto-recognition indicator you can find for the MetaTrader Platform. It detects 19 different patterns, takes fibonacci projections as seriously as you do, displays the Potential Reversal Zone (PRZ) and finds suitable stop-loss and take-profit levels. [ Installation Guide | Update Guide | Troubleshooting | FAQ | All Products ] It detects 19 different harmonic pri
Matreshka
Dimitr Trifonov
5 (2)
Matreshka self-testing and self-optimizing indicator: 1. Is an interpretation of the Elliott Wave Analysis Theory. 2. Based on the principle of the indicator type ZigZag, and the waves are based on the principle of interpretation of the theory of DeMark. 3. Filters waves in length and height. 4. Draws up to six levels of ZigZag at the same time, tracking waves of different orders. 5. Marks Pulsed and Recoil Waves. 6. Draws arrows to open positions 7. Draws three channels. 8. Notes support and re
RBreaker
Zhong Long Wu
RBreaker Gold Indicators is a short-term intraday trading strategy for gold futures that combines trend following and intraday reversal approaches. It not only captures profits during trending markets but also enables timely profit-taking and counter-trend trading during market reversals. This strategy has been ranked among the top ten most profitable trading strategies by the American magazine   Futures Truth   for 15 consecutive years. It boasts a long lifecycle and remains widely used and st
This system is very useful for trading because it solves several classic problems: 1. Objectivity & Precision Benefit: It eliminates the trader's personal bias. Every trader might draw a trendline slightly differently, but this indicator uses a precise mathematical logic (Fractals) to find the pivot points. The resulting lines are objective and consistent every time. 2. ️ Dynamic Updates Benefit: Your chart is always current. As soon as a new pivot is confirmed, the new trendline is drawn au
Cumulative Volume Delta MAX MTF Pro v4.4 — Hacim Tabanlı İşlemlerde Nihai Avantaj Tümüne Hükmedecek Tek Gösterge: Piyasanın GERÇEKTE ne düşündüğünü görün Tahmin yürütmeyi bırakın ve fiyat hareketlenmeden önce kurumsal oyuncuların ne yaptığını bilmeye başlayın. CVD MAX MTF Pro v4.4, karmaşık verileri net ve uygulanabilir sinyallere dönüştüren hacim analizi teknolojisinin zirvesini temsil eder. Bu versiyon, fiyat hareketlerini yönlendiren gizli güçleri her zamankinden daha hassas bir şekilde ortay
ATrend
Zaha Feiz
4.82 (17)
ATREND: Nasıl Çalışır ve Nasıl Kullanılır ### Nasıl Çalışır "**ATREND**" göstergesi, MT5 platformu için tasarlanmış olup, traderlara sağlam alım ve satım sinyalleri sağlamak amacıyla teknik analiz metodolojilerinin bir kombinasyonunu kullanır. Bu gösterge, öncelikle volatilite ölçümü için Ortalama Gerçek Aralık (ATR) kullanır ve potansiyel piyasa hareketlerini belirlemek için trend tespit algoritmalarıyla birleştirir. Satın aldıktan sonra bir mesaj bırakın ve özel bir bonus hediyesi kazanın. ##
Overview Harmonic Patterns MT5 is a technical analysis indicator designed for the MetaTrader 5 platform. It identifies and displays harmonic price patterns, such as Butterfly, Cypher, Crab, Bat, Shark, and Gartley, in both bullish and bearish directions. The indicator calculates key price levels, including entry, stop loss, and three take-profit levels, to assist traders in analyzing market movements. Visual elements and customizable alerts enhance usability on the chart. Features Detects six ha
Introduction to Chart Pattern MT Chart Pattern MT is a chart pattern scanner to detect the triangle pattern, falling wedge pattern, rising wedge pattern, channel pattern and so on. Chart Pattern MT uses highly sophisticated chart pattern detection algorithm. However, we have designed it in the easy to use with intuitive user interface. Chart Pattern MT will show all the patterns in your chart in the most efficient format for your trading. You do not have to do tedious manual pattern detection an
WAPV Weis Wave Chart Forex
Eduardo Da Costa Custodio Santos
MT5 için Weis Wave Chart Forex bir Fiyat ve Hacim göstergesidir. Fiyat ve Hacim okuması, Richard Demille Wyckoff tarafından oluşturulan üç yasaya dayalı olarak geniş çapta dağıtıldı: Arz ve Talep, Neden ve Etki ve Çabaya Karşı Sonuç. 1900'de R.Wyckoff, analizlerinde dalga grafiğini zaten kullanmıştı. Yıllar sonra, 1990 civarında, David Weis Otomatikleştirilmiş R. Wyckoff'un dalga grafiği ve bugün size David Weis'in dalga grafiğinin evrimini sunuyoruz. Varlıkta üretilen dalga ile ilgili Hacim mik
Phantom Edge SMC
Nattapon Chuekamhod
Phantom Edge SMC — The Ultimate Smart Money Indicator for MT5 Tired of manually drawing structures while trading SMC or ICT concepts? Let Phantom Edge SMC do the heavy lifting for you. Key Features Internal & Swing Structure: Automatically detects BOS and CHoCH across two structural levels. Order Blocks (OB): Identifies Internal and Swing OBs with automated mitigation tracking. Equal Highs / Lows: Highlights EQH / EQL to pinpoint Liquidity pools. Fair Value Gaps (FVG): Displays FVGs with
The Expert Advisor and the video are attached in the Discussion tab . The robot applies only one order and strictly follows the signals to evaluate the indicator efficiency. Pan PrizMA CD Phase is an option based on the Pan PrizMA indicator. Details (in Russian). Averaging by a quadric-quartic polynomial increases the smoothness of lines, adds momentum and rhythm. Extrapolation by the sinusoid function near a constant allows adjusting the delay or lead of signals. The value of the phase - wave s
The Super Arrow Indicator provides non-repainting buy and sell signals with exceptional accuracy. Key Features No repainting – confirmed signals remain fixed Clear visual arrows: green for buy, red for sell Real-time alerts via pop-up, sound, and optional email Clean chart view with no unnecessary clutter Works on all markets: Forex, gold, oil, indices, crypto Adjustable Parameters TimeFrame Default:   "current time frame" Function:   Sets the time frame for indicator calculation Options:   Can
"Impulses and Corrections 5" is created to help traders navigate the market situation. The indicator shows multi-time frame upward and downward "Impulses" of price movements. These impulses are the basis for determining the "Base" , which is composed of zones of corrections of price movements, as well as "Potential" zones for possible scenarios of price movement. Up and down impulses are determined based on a modified formula of Bill Williams' "Fractals" indicator. The last impulse is always "U
Weis Wave Scouter
Jean Carlos Martins Roso
MetaTrader 5 için geliştirilen Weis Wave Scouter ile gelişmiş hacim analizinin gücünü keşfedin! Bu devrim niteliğindeki gösterge, Wyckoff yönteminin ve Hacim Yayılımı Analizinin (VSA) kanıtlanmış ilkelerini birleştiriyor. Operasyonlarında doğruluk ve derinlik arayan yatırımcılar için tasarlanmıştır ve kümülatif hacim dalgası analizi yoluyla piyasanın taktiksel bir okumasını sunar. Weis Wave Scouter, Classic, NightVision ve OceanBreeze gibi özelleştirilebilir renk temaları ile renkli histogramlar
Elliott Wave MT5
Sathit Sukhirun
5 (1)
Otomatik Elliott Dalga Teorisi 1. Otomatik Dalga Sayımı ve Objektiflik İtki Dalgaları (1-2-3-4-5): Teorik olarak doğru yapıyı göstermek için katı kurallar kullanır. Düzeltme Dalgaları (A-B-C): Trend yönünde işlem fırsatları bulmak için geri çekilmeleri yakalar. 2. Çok Dereceli Analiz (Multi-Degree) 3 seviyeyi aynı anda analiz eder: Minor (Kısa): Hızlı hareketler için. Intermediate (Orta): Ana trend için. Primary (Uzun): Büyük resim için. 3. Hedef Fiyat ve Giriş Fibonacci Projeksiyonu: Bir sonrak
Overview The Market Perspective Structure Indicator is a comprehensive MetaTrader indicator designed to provide traders with a detailed analysis of market structure across multiple timeframes. It identifies and visualizes key price action elements, including swing highs and lows, Break of Structure (BOS), Change of Character (CHOCH), internal structures, equal highs/lows, premium/discount levels, previous levels from higher timeframes, and trading session zones. With extensive customization opt
Professional Gold Trading Levels Indicator Features: - Daily & Weekly Pivot Points - Fibonacci Retracement Levels   - Round Number Levels - Customizable Colors & Fonts - Auto-Update Daily - Clean & Simple Interface Perfect for Gold (XAUUSD) traders Reliable Support/Resistance levels Lightweight & Fast Performance Easy to install and use Compatible with all MT5 accounts. No complex settings required! SimpleGoldLevels v1.0 - User Manual Professional Support & Resistance Levels
Gioteen Volatility Index (GVI) - your ultimate solution to overcoming market unpredictability and maximizing trading opportunities. This revolutionary indicator helps you in lowering your losing trades due to choppy market movements. The GVI is designed to measure market volatility, providing you with valuable insights to identify the most favorable trading prospects. Its intuitive interface consists of a dynamic red line representing the volatility index, accompanied by blue line that indicate
Introduction to X3 Chart Pattern Scanner X3 Cherart Pattern Scanner is the non-repainting and non-lagging indicator detecting X3 chart patterns including Harmonic pattern, Elliott Wave pattern, X3 patterns, and Japanese Candlestick patterns. Historical patterns match with signal patterns. Hence, you can readily develop the solid trading strategy in your chart. More importantly, this superb pattern scanner can detect the optimal pattern of its kind. In addition, you can switch on and off individu
The RSI Divergence + FVG Signal indicator combines Relative Strength Index (RSI) Divergence with Fair Value Gap (FVG) detection to generate high-probability buy and sell signals based on both momentum shifts and institutional imbalance zones. Core Features: RSI Divergence Detection : Identifies both regular and hidden bullish/bearish divergences between price and RSI. Divergences indicate potential trend reversals or continuation. FVG Zone Recognition : Detects Fair Value Gaps (imbalances caused
Elliott Wave Trend was designed for the scientific wave counting. This tool focuses to get rid of the vagueness of the classic Elliott Wave Counting using the guideline from the template and pattern approach. In doing so, firstly Elliott Wave Trend offers the template for your wave counting. Secondly, it offers Wave Structural Score to assist to identify accurate wave formation. It offers both impulse wave Structural Score and corrective wave Structure Score. Structural Score is the rating to sh
CosmiCLab SMC FIBO CosmiCLab SMC FIBO is a professional trading indicator designed for traders who use Smart Money Concepts (SMC), market structure analysis and Fibonacci retracement levels. The indicator automatically detects market swings and builds Fibonacci levels based on the latest impulse movement. It also identifies market structure changes such as BOS (Break of Structure) and CHOCH (Change of Character), helping traders understand the current market direction. CosmiCLab SMC FIBO also pr
Key level wedge MT5
Presley Annais Tatenda Meck
The   Key level wedge MT5   indicator automatically draws rising wedge pattern and falling wedge pattern for you on the chart. This pattern is really good when used as a confirmation entry at key support & resistance, supply & demand and reversal zones. Advantages  The   Key level wedge MT5   block DOES NOT RE-PAINT, giving you confidence when a signal appears and also helps when looking back.  The   Key level wedge MT5   includes an on/off button on the chart to easily keep the charts clean
The "MR Volume Profile Rectangles 5" indicator is a charting tool that displays trading volume at different price levels rather than time intervals. A key concept in volume profile is the point of control (POC) —the price level with the highest volume traded during the session or time range. While tools like VWAP or OBV provide volume trends, the "MR Volume Profile Rectangles 5" indicator offers granular detail about where the most market activity occurs at specific price levels. This makes it a
Öncelikle, bu Ticaret Aracının Non-Repainting, Non-Redrawing ve Non-Lagging Gösterge olduğunu vurgulamakta fayda var, bu da onu profesyonel ticaret için ideal hale getiriyor. Çevrimiçi kurs, kullanıcı kılavuzu ve demo. Akıllı Fiyat Hareketi Kavramları Göstergesi, hem yeni hem de deneyimli tüccarlar için çok güçlü bir araçtır. İleri ticaret fikirlerini, Inner Circle Trader Analizi ve Smart Money Concepts Ticaret Stratejileri gibi 20'den fazla kullanışlı göstergeyi bir araya getirerek bir araya
Nirvana trend
Aiireza Arjmandi Nezhad
5 (1)
Nirvana Trend — ATR tabanlı risk çerçevesine sahip trend göstergesi Not: Bu araç yalnızca analitik bilgi sağlar; kâr, gelir veya belirli bir sonucu (değerlendirmeler/sınamalar dâhil) garanti etmez, vaat etmez veya ima etmez. Kullanım kararı ve sorumluluğu tamamen kullanıcıya aittir. Tanıtım Nirvana Trend, karar alma sürecini standartlaştırmak ve işlem disiplinini güçlendirmek için tasarlanmış bir teknik analiz göstergesidir. Filtrelenmiş sinyaller, çoklu zaman dilimi teyidi, ATR’ye dayalı öneri
Owl Smart Levels MT5
Sergey Ermolov
4.03 (32)
MT4 versiyonu  |  FAQ Owl Smart Levels Indicator , Bill Williams'ın gelişmiş fraktalları , piyasanın doğru dalga yapısını oluşturan Valable ZigZag ve kesin giriş seviyelerini gösteren Fibonacci seviyeleri gibi popüler piyasa analiz araçlarını içeren tek gösterge içinde eksiksiz bir ticaret sistemidir. pazara ve kar elde edilecek yerlere. Stratejinin ayrıntılı açıklaması Gösterge ile çalışma talimatı Baykuş Yardımcısı ticaretinde Danışman Yardımcısı Kullanıcıların özel sohbeti -> Satın aldıktan
STRICTLY FOR BOOM INDEX ONLY!!!!! Here I bring the Maximum Trend Arrows OT1.0 MT5 indicator. This indicator is made up of a combination of different trend indicators for entries and exits, for entries an orange arrow will paint on the chart below the current market and a red flag for closing of trades and it produces buy arrows only. When the orange arrow appears, it will appear along with it's sound to notify you. The 1H timeframe is recommended, don't use it anywhere else than on the 1H timefr
Bu ürünün alıcıları ayrıca şunları da satın alıyor
Azimuth Pro
Ottaviano De Cicco
5 (4)
LAUNCH PROMO Azimuth Pro price is initially set at 299$ for the first 100 buyers. Final price will be 499$ . THE DIFFERENCE BETWEEN RETAIL AND INSTITUTIONAL ENTRIES ISN'T THE INDICATOR — IT'S THE LOCATION. Most traders enter at arbitrary price levels, chasing momentum or reacting to lagging signals. Institutions wait for price to reach structured levels where supply and demand actually shift. Azimuth Pro maps these levels automatically: swing-anchored VWAP, multi-timeframe structure lines, an
AriX
Temirlan Kdyrkhan
1 (4)
AriX Indicator for MT5 A powerful trend-following and signal-evaluation tool AriX is a custom MT5 indicator that combines Moving Averages and ATR-based risk/reward logic to generate clear buy/sell signals. It visualizes dynamic SL/TP levels, evaluates past trade outcomes, and displays win/loss statistics in a clean on-chart panel. Key features include: Buy/Sell signals based on MA crossovers ATR-based SL/TP1/TP2/TP3 levels with visual lines and labels Signal outcome tracking with real-time stat
OmniSync Projection
Antonio-alin Teculescu
5 (1)
Chronos Fractal Engine is an innovative price projection indicator for MetaTrader 5, designed to transform your technical analysis by intelligently identifying and projecting historical price patterns. Built upon an advanced correlation algorithm and the fractal principles of the market, this powerful tool visualizes potential future price movements, giving you a unique edge in your trading decisions. What is Chronos Fractal Engine? At its core, the Chronos Fractal Engine employs a sophisticat
ARIPoint
Temirlan Kdyrkhan
ARIPoint is a powerful trading companion designed to generate high-probability entry signals with dynamic TP/SL/DP levels based on volatility. Built-in performance tracking shows win/loss stats, PP1/PP2 hits, and success rates all updated live. Key Features: Buy/Sell signals with adaptive volatility bands Real-time TP/SL/DP levels based on ATR Built-in MA Filter with optional ATR/StdDev volatility Performance stats panel (Success, Profit/Loss, PP1/PP2) Alerts via popup, sound, push, or email Cu
" Dynamic Scalper System MT5 " göstergesi, trend dalgaları içinde işlem yapmak için scalping yöntemi için tasarlanmıştır. Başlıca döviz çiftleri ve altın üzerinde test edilmiştir, diğer işlem araçlarıyla uyumluluğu mümkündür. Ek fiyat hareketi desteğiyle trend boyunca pozisyonların kısa vadeli açılması için sinyaller sağlar. Göstergenin prensibi. Büyük oklar trend yönünü belirler. Küçük oklar şeklinde scalping için sinyaller üreten bir algoritma trend dalgaları içinde çalışır. Kırmızı oklar yü
GEM Signal Pro - Profesyonel Trading Göstergesi Hassas girişler. Sıfır repaint. Her seferinde tek bir karar. GEM Signal Pro, MetaTrader 4 ve MetaTrader 5 için geliştirilmiş profesyonel seviyede bir trend-following göstergesidir. Çoğu perakende göstergede görülen gürültü, gecikme ve boş vaatler olmadan temiz ve uygulanabilir sinyaller talep eden traderlar için tasarlanmıştır. Her sinyal, tescilli çok katmanlı bir doğrulama motoru üzerinden değerlendirilir. GEM Signal Pro’yu farklı yapan nedir Çoğ
CGE Trading Suite
Carl Gustav Johan Ekstrom
5 (1)
CGE Trading Suite delivers the analytical edge typically reserved for professional trading desks. The platform integrates a full suite of analytical tools into one seamless workflow: dynamic grid mapping, liquidity behavior analysis, ECM, trend lines, MIDAS, trade cycles, and directional channel projections. Together, these provide a unified view of market structure and momentum. Directional clarity is further enhanced by the capital flow index, which measures currency basket strength to identif
Pointer Trend Switch — precision trend reversal indicator Pointer Trend Switch is a high-precision arrow indicator designed to detect key moments of trend reversal based on asymmetric price behavior within a selected range of bars. It identifies localized price impulses by analyzing how far price deviates from the opening level, helping traders find accurate entry points before a trend visibly shifts. This indicator is ideal for scalping, intraday strategies, and swing trading, and performs equa
ARIScalping
Temirlan Kdyrkhan
ARIScalp is a powerful trading companion designed to generate high-probability entry signals with dynamic TP/SL/DP levels based on volatility. Built-in performance tracking shows win/loss stats, PP1/PP2 hits, and success rates all updated live. Key Features: Buy/Sell signals with adaptive volatility bands Real-time TP/SL/DP levels based on ATR Built-in MA Filter with optional ATR/StdDev volatility Performance stats panel (Success, Profit/Loss, PP1/PP2) Alerts via popup, sound, push, or email Cus
Göstergemiz, piyasada ilgi gösterilen bölgeleri vurgular ve ardından emir birikim bölgelerini gösterir. Büyük ölçekli bir emir defteri (order book) gibi çalışır. Bu, büyük sermaye için geliştirilmiş bir göstergedir. Performansı olağanüstüdür. Piyasada ne tür bir ilgi olursa olsun, onu görürsünüz . (Bu, tamamen yeniden yazılmış ve otomatikleştirilmiş bir versiyondur – artık manuel analiz gerekmez.) İşlem Hızı (Transaction Speed) , piyasada büyük emirlerin nerede ve ne zaman biriktiğini gösteren v
TrendMaestro5
Stefano Frisetti
note: this indicator is for METATRADER4, if you want the version for METATRADER5 this is the link:  https://www.mql5.com/it/market/product/108106 TRENDMAESTRO ver 2.5 TRENDMAESTRO recognizes a new TREND from the start, he never makes mistakes. The certainty of identifying a new TREND is priceless. DESCRIPTION TRENDMAESTRO identifies a new TREND in the bud, this indicator examines the volatility, volumes and momentum to identify the moment in which there is an explosion of one or more of these da
Weis Wave with Alert MT5
Trade The Volume Waves Single Member P.C.
4.94 (17)
Rental/Lifetime Package Options and Privileges  Rent Monthly Six Months   Yearly/Lifetime Weis Wave with Speed with Alert+Speed Index x x x Manual  x x x Quick Set up Video x x x Blog x x x Lifetime Updates x x x Setup and Training Material x x Discord Access Channel "The SI traders"          x Rectangle Break Alert Tool      x How to trade with it:    http://www.tradethevolumewaves.com   ** If you purchase please contact me to setup your  : Training Room and  complete manual access.  Wei
Rtc ML Ai Predictor
Muhammad Faisal Sagala
Rtc ML Ai | Predictor CORE MACHINE LEARNING ENGINE Adaptive ML Market Predictor – Multi-Bar Trend & Candle Forecast What This Indicator Does This indicator is a  real-time market prediction engine  designed to analyze price behavior and estimate  future market tendencies . Unlike conventional indicators, this system  does not rely on static parameters or historical curve-fitting , but adapts its internal state dynamically during live market operation. Instead of using static rules, the indic
Jita Indicator Pro MT5 | All Timeframes Professional Trend Agreement System – Premium Edition ($500) What Is Jita Indicator Pro? Jita Indicator Pro is a structured trend-confirmation system designed for serious traders who value precision, alignment, and controlled signal behavior. It combines: Advanced band-based trend direction logic ATR-driven structural trigger engine Dual-confirmation agreement system Locked history update design This indicator prints signals only when multiple conditions
WARNING: This indicator is distributed EXCLUSIVELY on MQL5.com MT4 version:   https://www.mql5.com/it/market/product/160363 MT5 version:   https://www.mql5.com/it/market/product/160410 ============================================================================================= MAX RIBBON ver 1.00 The indicator that shows you the TREND clearly and unambiguously! ============================================================================================= DESCRIPTION MAX RIBBON is an advanced tre
AlgoEAs Trend Dashboard V1 Indicator for MT5 Introduction: This is a Dashboard Indicator based on 7 built in Multi Timeframe indicators. This strategy gives Buy/Sell Ideas based on 9 trend states. Easy to view gas guage to view current trend. Has as optional Alerts to enable with 9 messages. Run on M15 chart, with M15, H1, and H4 indicator time frames. Great tool! Features: Non-Repainting Dashboard For Desktop MT5 Only, Works On Any Mt5 Pair Great for Intraday and Swing Trading Easy view gas
IVISTscalp5
Vadym Zhukovskyi
5 (6)
What's new about iVISTscalp5 forecast indicator (Version 10)? iVISTscalp5 is a unique nonlinear forecasting for a week ahead system for any financial instrument which executes fast scalping using time levels. iVISTscalp5 is a tool for easy study and understanding of financial market. 1) iVISTscalp5 forecast indicator has been completely rewritten into another programming language (C++), which has accelerated data loading and processing. As a result, a different graphical display of forecasts
+++++++++++++++++++++++++++++++++++++++++++++++++++++++++++++++++++++++++++++++++++++++++++++++++ +++ Link to EURUSD Only Free Version -->  https://www.mql5.com/en/market/product/156904?source=Unknown +++++++++++++++++++++++++++++++++++++++++++++++++++++++++++++++++++++++++++++++++++++++++++++++++ Hallo Trader, This is a traditional GANN & FIBONACCI strategy based on detection of an impulsive move in the opposite direction. This is called a Breakout. At the moment of Breakout, the indicator draw
Big Player Range
Thalles Nascimento De Carvalho
5 (3)
BigPlayerRange – MT5 için En İyi Gösterge BigPlayerRange , MetaTrader 5 üzerinde Mini Endeks ve Mini Dolar için en iyi gösterge olarak kabul edilir. Bu güçlü araç, büyük oyuncuların stratejik faaliyet alanlarını vurgulayarak kurumsal teknik analizde yüksek hassasiyet sunar. BigPlayerRange Nasıl Kullanılır: Gösterge, alış bölgelerini (yeşil çizgi) ve satış bölgelerini (kırmızı çizgi) gösterir. Fiyat bu alanların dışına kapandığında trend oluşma olasılığı yüksektir. Yeşil çizginin üzerinde
ÜCRETSİZ AUX Göstergesini, EA desteğini ve tam kılavuzu alın, lütfen ziyaret edin – https://www.mql5.com/en/blogs/post/763955 Trend'i Belirle. Deseni Oku. Girişi Zamanla. 30 Saniyede 3 Adım! Kolayca işlem yapın — analiz gerektirmez, Akıllı yardımcınız iş akışınızı basitleştirmeye hazır Artık grafik yüklemesi yok. Akıllı yönelim tespiti ile güvenle işlem yapın. Tüm para birimleri, kripto, hisse senetleri, metaller, endeksler ve herhangi bir zaman dilimi ile uyumludur. Sadece tıklayın ve yürütün
Göstergе, herhangi bir noktadan hacmi analiz eder ve bu hacim için piyasanın tükeniş seviyelerini hesaplar. Meravith’in ana çizgileri: Boğa hacim tükeniş çizgisi – hedef olarak kullanılır. Ayı hacim tükeniş çizgisi – hedef olarak kullanılır. Trend çizgisi – piyasa trendini gösterir. Piyasanın boğa mı ayı mı olduğuna bağlı olarak rengi değişir ve trend desteği görevi görür. Nasıl kullanılır: Mor dikey çizgiye çift tıklayın ve istediğiniz konuma taşıyın. Her şeyi analiz edebilirsiniz – trendleri v
Frontier Pivots
Nestor Jose Mendez Boza
FRONTIER PIVOTS - Geometric Levels Indicator This indicator plots support and resistance levels/ranges on the chart using mathematical calculations. It helps traders identify potential price reaction zones based on geometric patterns. Main Features: Automatically calculates and displays key price levels Plots both support and resistance lines Uses daily price data for level calculation Clean visual presentation with different colors for different level types No repainting - levels remain static
Hunter Spike
Jaime Humberto Gomez Arias
Hunter Spike This indicator consists of two regression channels calibrated with the current movement of the synthetic index algorithm, for any Deriv or Weltrade broker. Each channel has a signal, a target that alerts us when the price touches them, indicating buys on booms or gains and sells on crashes or pains. -configuration for booms or gains: Channel zone 1 (30) Channel zone 2 (0) -configuration for crashes or pains: Channel zone 1 (100) Channel zone 2 (70) Zones freely configurable by
VTrende Pro
Andrii Diachenko
5 (1)
VTrende Pro - MTF indicator for trend trading with a display panel for MT5 *** Videos can be translated into any language using subtitles (video language - Russian) Although the signals of the VTrende Pro indicator can be used as signals of a full-fledged trading system, it is recommended to use them in conjunction with the Bill Williams TS. VTrende Pro is an extended version of the VTrende indicator. Difference between Pro version and VTrende: - Time zones - Signal V - signal 1-2 waves -    S
Recommended TimeFrame >= H1. 100% Non Repainted at any moment.  Use it carefully, only with Trend Direction. Trading Usage: 2 Variants: as Range System or as BreakOut System (Both Only With Trend Direction)::: (Always use StopLoss for minimise Risk); [1] as Range System: (Recommended) in UP TREND:  - BUY in Blue Line , then if price goes down by 50 points (on H1) open Second BUY.   Close in any Profit you wish: TrailingStop(45 points) or Close when Price touches upper Gold Line. in DOWN TREND
FXLAND Smart Reversal Indicator (MT5) FXLAND Smart Reversal Indicator is a professional technical analysis tool designed to help traders identify potential price reversal zones and key market turning points with clarity and precision. The best reversal indicator and price return by choosing only one ceiling or floor in each time frame A masterpiece of combining mathematics and Gann, fractal matrix, Fibonacci, movement angle and time. Completely intelligent Key Features Detects potenti
Pantera Indicator
Temirlan Kdyrkhan
5 (1)
A tool for on-chart strategy backtesting and performance analysis. A utility for developing, debugging, and testing custom trading ideas and indicator functions. An indicator designed to quickly test trading concepts and visualize the effectiveness of different input parameters. An all-in-one sandbox for testing everything from simple crossovers to complex, multi-condition trading systems.
WanaScalper
Isaac Wanasolo
1 (1)
A scalping indicator based on mathematical patterns, which on average gives signals with relatively small SL, and also occasionally helps to catch big moves in the markets (more information in the video) This indicator has three main types of notifications: The first type warns of a possible/upcoming signal on the next bar The second type indicates the presence of a ready signal to enter the market/open a position The third type is for SL and TP levels - you will be notified every time price re
Historical Similarity Matcher Indicator (HI.SI.MA) Try it free today — demo version now available!   https://www.mql5.com/en/market/product/167114 Overview The Historical Similarity Matcher is a technical analysis indicator for MetaTrader 5. It scans historical price data to find segments that show statistical similarity to a user-selected reference period on the chart.
How to use Pair Trading Station Pair Trading Station is recommended for H1 time frame and you can use it for any currency pairs. To generate buy and sell signal, follow few steps below to apply Pair Trading Station to your MetaTrader terminal. When you load Pair Trading Station on your chart, Pair Trading station will assess available historical data in your MetaTrader platforms for each currency pair. On your chart, the amount of historical data available will be displayed for each currency pai
Yazarın diğer ürünleri
RSI Divergence Pulse, diverjans algılama, çoklu zaman dilimi analizi ve görsel araçları tek bir hafif uygulamada birleştiren kapsamlı bir RSI göstergesidir. Otomatik olarak Düzenli ve Gizli diverjansları tanımlar, canlı Çoklu Zaman Dilimi RSI paneli gösterir, OB/OS bölgelerini görsel tanıma için doldurur, fiyat grafiğinde ve RSI alt penceresinde diverjans çizgileri çizer, Al/Sat okları yerleştirir ve gerçek zamanlı uyarılar sağlar. Özellikler Color-Coded RSI Line RSI çizgisi mevcut bölgesine gö
MERAVITH SCANNER, MetaTrader 5 için profesyonel bir finansal piyasa göstergesidir ve birden fazla analiz aracını tek bir entegre sistemde birleştirir. Tüm hesaplamaları, özel hacim ağırlıklı ortalama fiyat (VWAP) metodolojisini kullanarak otomatik olarak gerçekleştirir ve subjektif yorumları tamamen ortadan kaldırır. Bu gösterge, tüm varlık sınıflarında (Forex, Hisseler, Endeksler, Emtialar, Kripto Paralar) ve M1’den Aylık’a kadar tüm zaman dilimlerinde çalışır. Temel prensip, fiyatın hacmi taki
Meravith
Ivan Stefanov
5 (3)
Market maker aracı. Meravith şunları yapar: Tüm zaman dilimlerini analiz eder ve geçerli trendi gösterir. Alış ve satış hacimlerinin eşit olduğu likidite bölgelerini (hacim dengesi) vurgular. Farklı zaman dilimlerinden tüm likidite seviyelerini doğrudan grafiğinizde gösterir. Referansınız için metin tabanlı piyasa analizi üretir ve sunar. Mevcut trende göre hedefler, destek seviyeleri ve stop-loss noktalarını hesaplar. İşlemleriniz için risk/ödül oranını hesaplar. Hesap bakiyenize göre pozisyon
MACD divergency
Ivan Stefanov
4.5 (6)
Bu gösterge, fiyat hareketleri ile MACD histogramı arasındaki yükseliş ve düşüş uyumsuzluklarını (divergence) doğru bir şekilde tespit eder. Kullanılan üssel hareketli ortalamalar (EMA) periyotları 5 (hızlı) ve 34 (yavaş), sinyal hattı periyodu ise 5’tir. Gösterge, momentumin zayıfladığı noktaları vurgulayarak muhtemel trend dönüşlerine işaret eder. Doğru uyumsuzluk tespiti kuralları Yükseliş uyumsuzluğu, fiyat daha düşük dipler oluştururken MACD histogramı sıfır çizgisinin üzerinde aynı anda da
FREE
Göstergemiz, piyasada ilgi gösterilen bölgeleri vurgular ve ardından emir birikim bölgelerini gösterir. Büyük ölçekli bir emir defteri (order book) gibi çalışır. Bu, büyük sermaye için geliştirilmiş bir göstergedir. Performansı olağanüstüdür. Piyasada ne tür bir ilgi olursa olsun, onu görürsünüz . (Bu, tamamen yeniden yazılmış ve otomatikleştirilmiş bir versiyondur – artık manuel analiz gerekmez.) İşlem Hızı (Transaction Speed) , piyasada büyük emirlerin nerede ve ne zaman biriktiğini gösteren v
Bu gösterge, MetaTrader 4 ve 5 için etkileşimli bir Elliott Dalga etiketleme aracıdır. Kullanıcının, grafik üzerindeki menüden etiket boyutunu, rengini ve dalga türünü (ABC düzeltmeleri, 5 dalgalı impulslar veya WXY yapıları) seçerek dalga etiketlerini manuel olarak grafiğe yerleştirmesine olanak tanır. Grafikte tek bir tıklamayla, gösterge seçilen fiyat ve zaman noktasına uygun dalga etiketlerini sırasıyla yerleştirir ve yatırımcıların Elliott Dalga yapılarını görsel olarak haritalandırmasına v
FREE
Meravith AUTO
Ivan Stefanov
5 (1)
Meravith Auto, Meravith ticaret sisteminin otomatik bir versiyonudur. Gösterge, rengini değiştiren bir trend çizgisinden oluşur. Yükseliş trendindeyken yeşil, düşüş trendindeyken kırmızıdır. Bu, trendin destek çizgisidir. Boğa hacminin ayı hacmine eşit olduğu bir likidite çizgisi. Üçlü boğa sapma çizgisi. Üçlü ayı sapma çizgisi. Yüksek hacmi gösteren mor ve mavi noktalar. Mor nokta, ortalama hacmin iki sapma üstünde hacmi gösterirken, mavi nokta iki sapmayı gösterir. Nasıl kullanılır? Trend çizg
Horizont
Ivan Stefanov
Horizont, giriş noktası, Hedef 1, Hedef 2 ve Stop Loss dahil olmak üzere eksiksiz bir işlem kurulumu sağlayan bir ticaret sistemidir ve tüm seviyeler otomatik olarak hesaplanır. Sistem, piyasanın zirve ve diplerini otomatik olarak tespit eder ve bunları mevcut trendi tanımlamak için birleştirir. Hangi trend üzerinde işlem yapmak istediğinizi seçersiniz ve Horizont buna uygun giriş, hedef ve stop seviyelerini oluşturur. Sistem, otomatik risk yönetimi içerir. Hesap bakiyenizi kontrol eder, riski
Gelişmiş momentum osilatörü, daha doğru aşırı alım ve aşırı satım sinyalleri için periyodunu piyasa oynaklığına göre otomatik olarak ayarlar. Çalışma Prensibi: Gösterge, yüksek oynaklıkta kısalan ve düşük oynaklıkta uzayan uyarlanabilir bir periyot hesaplaması kullanır. Bu dinamik ayar, piyasa trend halindeyken daha hızlı sinyaller sağlar ve yatay piyasa koşullarında yanlış sinyalleri azaltır. RSI değeri, bu değişken periyoda göre hesaplanır, bu da onu mevcut piyasa koşullarına daha duyarlı hale
FREE
Meravith Auto, Meravith ticaret sisteminin otomatik bir versiyonudur. Gösterge, rengini değiştiren bir trend çizgisinden oluşur. Yükseliş trendindeyken yeşil, düşüş trendindeyken kırmızıdır. Bu, trendin destek çizgisidir. Boğa hacminin ayı hacmine eşit olduğu bir likidite çizgisi. Üçlü boğa sapma çizgisi. Üçlü ayı sapma çizgisi. Yüksek hacmi gösteren mor ve mavi noktalar. Mor nokta, ortalama hacmin iki sapma üstünde hacmi gösterirken, mavi nokta iki sapmayı gösterir. Nasıl kullanılır? Trend çizg
Bu gösterge, MetaTrader 4 ve 5 için etkileşimli bir Elliott Dalga etiketleme aracıdır. Kullanıcının, grafik üzerindeki menüden etiket boyutunu, rengini ve dalga türünü (ABC düzeltmeleri, 5 dalgalı impulslar veya WXY yapıları) seçerek dalga etiketlerini manuel olarak grafiğe yerleştirmesine olanak tanır. Grafikte tek bir tıklamayla, gösterge seçilen fiyat ve zaman noktasına uygun dalga etiketlerini sırasıyla yerleştirir ve yatırımcıların Elliott Dalga yapılarını görsel olarak haritalandırmasına v
FREE
Imbalance Pro
Ivan Stefanov
5 (4)
Gösterge, seçilen bir dönem boyunca boğalar ve ayılar arasındaki dengesizliği ölçer ve iki nokta arasında düz bir çizgi gösterir. Boğalar ayılardan daha fazla hacme sahipse, çizgi yeşile döner.  Ayılar daha fazla hacme sahipse kırmızı olur. Çizgi ayrıca hacimdeki yüzde farkını da gösterir. Gösterge aynı verileri ayrı bir pencerede gösterir. Bölünmüş hacmi de görebilirsiniz. Göstergenin iki modu vardır. Bu amaçla, sol üstte bir düğme vardır,  - basılı değilse, piyasadaki rastgele bir nokta
Göstergе, herhangi bir noktadan hacmi analiz eder ve bu hacim için piyasanın tükeniş seviyelerini hesaplar. Meravith’in ana çizgileri: Boğa hacim tükeniş çizgisi – hedef olarak kullanılır. Ayı hacim tükeniş çizgisi – hedef olarak kullanılır. Trend çizgisi – piyasa trendini gösterir. Piyasanın boğa mı ayı mı olduğuna bağlı olarak rengi değişir ve trend desteği görevi görür. Nasıl kullanılır: Mor dikey çizgiye çift tıklayın ve istediğiniz konuma taşıyın. Her şeyi analiz edebilirsiniz – trendleri v
Fiyatlara dayalı seviyeleri hesaplayan nadir göstergelerden biridir. Bu gösterge zaman dilimlerinden, trendlerden veya piyasa döngülerinden etkilenmez. Şimdiye kadar oluşturulmuş en mantıklı göstergelerden biridir. FIFTY göstergesi artık otomatik bir versiyonla sunuluyor; bu da seviyeleri manuel olarak çizme ihtiyacını ortadan kaldırıyor. Bu versiyon, grafik üzerine günlük, haftalık, aylık ve yıllık seviyeleri otomatik olarak çizer; böylece hem doğruluk sağlanır hem de zaman kazandırır. Ayrıca,
Naturu
Ivan Stefanov
5 (1)
“Naturu”, doğanın simetrisini algoritması olarak kullanan bir manuel indikatördür. Basit bir strateji ve gizli bilgelikle piyasayı fethedin! İndikatörü yüklediğinizde iki çizgi görürsünüz: Üst (Top) ve Alt (Bottom). Bir çizgiye tıklayarak aktifleştirin. Taşımak için, yerleştirmek istediğiniz mumun üzerine tıklayın. Bir tepe noktası ve bir dip noktası belirlersiniz, indikatör otomatik olarak hesaplar: Boğalar ve ayıların çıkarlarının en yakınlaştığı, destek veya direnç rolü oynaması en muhtemel b
Sense
Ivan Stefanov
5 (2)
SENSE, seçilen GANN yöntemlerini fraktal hesaplamalarla birleştiren otomatik bir sistemdir. Sistem bize işlemlerin nerede açılacağını ve kapatılacağını söyler. Artık karmaşık hesaplamalarla zaman kaybetmenize gerek yok - SENSE sizin için her şeyi yapar. Sadece göstergeyi yükleyin. Temel ilkeler: Fiyat beyaz çizgilerin üzerinde olduğunda piyasa yükselişe geçer Beyaz çizgilerin üzerinde satın alın, altında durun Yeşil çizgiler yukarı yönlü hedeflerdir Fiyat beyaz çizgilerin altında olduğunda
Two Snakes
Ivan Stefanov
5 (1)
2 SNAKES birinci sınıf bir scalping sistemidir. Girişler oldukça hassas olduğundan, bu sisteme çok hızlı bir şekilde bağımlı hale gelmeniz muhtemeldir.  2 yılanınız var. Üstlerinde veya altlarında onlara dokunmayan bir mum gördüğünüzde - bu sizin scalping sinyalinizdir. Daha büyük bir zaman çerçevesi kullanırsanız, scalping takip eden trend haline gelebilir. Yılanlar, piyasanın mevcut durumuna göre tam olarak hesaplanır. Hareketli ortalamalar DEĞİLDİR.  Pozisyonunuzu ne kadar süre tutacağ
Separated Volume
Ivan Stefanov
5 (1)
Bu gösterge, forex piyasasındaki tik hacmini etkin bir şekilde yükseliş ve düşüş kategorilerine ayırır. Ek olarak, seçtiğiniz herhangi bir dönem için yükseliş ve düşüş kene hacimlerinin toplamını hesaplama ve görüntüleme işlevselliği sağlar. Grafikteki iki mavi çizgiyi hareket ettirerek dönemi kolayca ayarlayabilir, ticaret ihtiyaçlarınıza göre özelleştirilebilir ve hassas hacim analizine izin verebilirsiniz. Eğer faydalı bulursanız yorumlarınız takdir edilecektir! Mutlu ticaretler!
FREE
Enigmera
Ivan Stefanov
5 (8)
ENIGMERA: Pazarın Kalbi Önemli: MQL5.com demosu Strategy Tester'da çalışır ve Enigmera'nın tüm işlevlerini tam olarak yansıtmayabilir. Daha fazla bilgi için açıklamayı, ekran görüntülerini ve videoyu kontrol edin. Herhangi bir sorunuz varsa, bana mesaj göndermekten çekinmeyin! Göstergenin kodu tamamen yeniden yazılmıştır. 3.0 sürümü, yeni işlevler ekler ve göstergenin başlangıcından bu yana biriken hataları giderir. Giriş Bu gösterge ve ticaret sistemi, finansal piyasalara dikkat çekici bir ya
Levelss
Ivan Stefanov
5 (1)
LEVELSS göstergesi gösterir: - Günlük yükseliş ve düşüş bölgesi. Her gün 00:00 ile 23:59 arasında görülebilir.  - Haftalık yükseliş ve düşüş bölgesi. Her hafta Pazartesi 0:00'dan Cuma 23:59'a kadar görülebilir. - Diğer tüm zaman dilimlerinde görüntülenen belirli bir zaman diliminden özel olarak hesaplanan kanal. Varsayılan olarak, bu, işlem yapmak istediğiniz diğer zaman dilimine değiştirebileceğiniz 4 saatlik zaman dilimidir. Kesintisiz olarak hesaplanır. Ekranın sol üst köşesinde, bölgeleri
GANN Master
Ivan Stefanov
5 (1)
GANN’ın kesin hedefleri, yıllarca test edilmiş yöntemlerine dayanarak hesaplanır ve karşınızda sunulur. Bu araç, ticareti daha kolay ve sezgisel hale getirmek için tasarlanmıştır. Beyaz çizgiyi yukarı veya yeşil çizgiyi aşağı doğru hareket ettirdiğinizde, GANN'ın tekniklerinin ticaret dünyasında neden hala etkili olduğunu hemen anlayacaksınız. GANN’ın stratejileri, piyasa hareketlerini yüksek bir doğrulukla tahmin etmeye odaklanır ve bu araç bu gücü parmaklarınızın ucuna getirir. İster deneyimli
Stefanov
Ivan Stefanov
The indicator displays support and resistance zones defined logically using the MACD. The entire concept is explained in the video, with specific examples shown. The indicator works on any instruments and timeframes. It does not repaint. After placing it on the chart, please go through all the timeframes sequentially, from monthly to 1-minute, so that all lines load correctly. After that, you can start using it. The concept is unique and has not been seen in other systems or indicators.
Fifty Pro
Ivan Stefanov
5 (1)
FIFTY göstergesi artık manuel seviye çizme ihtiyacını ortadan kaldıran otomatik bir versiyonla sunulmaktadır. Bu versiyon, günlük, haftalık, aylık ve yıllık seviyeleri otomatik olarak grafiğe çizer, böylece doğruluk sağlanır ve zaman tasarrufu yapılır. Ayrıca, bu seviyelerin görünürlüğünü açıp kapatmak için düğmeler mevcuttur, bu da tamamen özelleştirilebilir bir kullanım sunar. Manuel kullanımı tercih edenler için, göstergeyi ücretsiz versiyonu hâlâ mevcut olup tam işlevselliğe sahiptir. Böylec
“Naturu”, doğanın simetrisini algoritması olarak kullanan bir manuel indikatördür. Basit bir strateji ve gizli bilgelikle piyasayı fethedin! İndikatörü yüklediğinizde iki çizgi görürsünüz: Üst (Top) ve Alt (Bottom). Bir çizgiye tıklayarak aktifleştirin. Taşımak için, yerleştirmek istediğiniz mumun üzerine tıklayın. Bir tepe noktası ve bir dip noktası belirlersiniz, indikatör otomatik olarak hesaplar: Boğalar ve ayıların çıkarlarının en yakınlaştığı, destek veya direnç rolü oynaması en muhtemel b
MACD Divergence Pulse — 4 renkli histogram, uyarılar ve gösterge paneli ile akıllı diverjans tarayıcısı. KISA AÇIKLAMA Otomatik normal & gizli diverjans algılama, 4 renkli dinamik histogram, Al/Sat okları, sinyal etiketleri, gerçek zamanlı panel ve çok kanallı uyarılar içeren profesyonel MACD indikatörü. Her sembol ve zaman diliminde çalışır. TAM AÇIKLAMA MACD Divergence Puls
RSI Divergence Pulse — Smart Divergence Scanner with MTF Panel, Zone Fill, Alerts & Dashboard SHORT DESCRIPTION Professional RSI indicator with automatic Regular & Hidden divergence detection, color-coded RSI line, Multi-Timeframe panel, OB/OS zone fills, Buy/Sell arrows, signal labels, real-time dashboard, and multi-channel alerts. Works on any symbol and timeframe. FULL DESCRIPTION
Efsanevi William Gann seviyelerini tam otomatik MT5 indikatöründe. GANN Master, günlük, haftalık ve aylık verilere dayanarak fiyatın en muhtemel dönüş veya trend devamı bölgelerini tespit eder. Temel Özellikler Tek tıkla zaman periyodu: “Daily”, “Weekly” veya “Monthly” düğmesine tıklayarak bugünün, bu haftanın veya bu ayın zonlarını anında çizin Otomatik ve Manuel Modlar Otomatik : GANN Master tüm seviyeleri sizin için hesaplar—manuel girdi gerekmez Manuel : “Top” ve “Bottom” çizgilerini sürükle
SPEKULATOR, önemli destek bölgelerini ve piyasa yönünü belirlemenize yardımcı olan manuel bir ticaret sistemi ve göstergesidir. Basit bir strateji ve gizli bilgiyle piyasayı ustaca yönetin. Grafikte herhangi bir zirve (TOP) ve dip (BOTTOM) seçiyorsunuz, ardından gösterge şunları çizer: Trendinize göre bir destek bölgesi. Yükseliş trendi için yeşil bir bölge, düşüş trendi için kırmızı bir bölge görünür. Destek bölgesinin hassasiyeti, göstergenin ayarlarında ayarlanabilir. Bu bölge, seçtiğiniz tre
MACD Divergence Pulse — 4 renkli histogram, uyarılar ve gösterge paneli ile akıllı diverjans tarayıcısı. KISA AÇIKLAMA  Otomatik normal & gizli diverjans algılama, 4 renkli dinamik histogram, Al/Sat okları, sinyal etiketleri, gerçek zamanlı panel ve çok kanallı uyarılar içeren profesyonel MACD indikatörü. Her sembol ve zaman diliminde çalışır. TAM AÇIKLAMA MACD Divergence Pul
Filtrele:
Gabriel De Araujo Lobo
1329
Gabriel De Araujo Lobo 2025.06.18 15:48 
 

It's amazing how this works, excellent to add to strategies that use price action. Excellent attention given by the seller

Vasyl Daki
575
Vasyl Daki 2025.06.16 18:55 
 

I bought this indicator mostly because of the reviews because I couldn't test it with the demo version to the full extent. After the purchase, I started checking the system's operation on history. During the check, I found that the indicator gives weak results. My first observation concerns the fact that after the trend has changed and I notice it and of course I set the indicator to the top point of the beginning of the downward trend at the next price touch of the main support line and the formation of a pattern for concluding a deal to sell in 50% of cases the market turns around and goes against the pattern or makes a deep correction that confuses the indicator and it can create a false pattern that creates new losses, the same applies to patterns to buy. When working with this indicator, there is no sense of control over the market. That is, there is some interval where the indicator works very well, but then there comes an interval where the indicator shows bad results. I still couldn't understand what its advantage is and how you can make money with it. In my opinion, its price is 40 dollars. If the author thinks otherwise he can write a program for a profitable robot based on this indicator, I would be happy to test this robot.

Ivan Stefanov
6600
Geliştiriciden yanıt Ivan Stefanov 2025.06.18 12:38
Dear Mr. Daki, I deeply regret your dissatisfaction; however, the facts of our interactions clearly indicate a different situation. Immediately after your purchase, I proactively provided extensive support, offering multiple channels (email, Telegram) to clarify any questions. Despite several attempts to help you, you consistently refused to provide any concrete examples or screenshots of your claimed issues, making it impossible to assist you effectively. When I offered a full refund, you supplied inconsistent payment details with multiple conflicting identities—first a Bulgarian name, then an Arabic one, and later cryptocurrency addresses in romanian language—raising legitimate concerns about the authenticity of your claims. Enigmera is a proven system, highly rated and validated by numerous satisfied traders. Each customer requesting a trial receives full access to test thoroughly before buying. Your allegation that testing was impossible is false and contradicts clear evidence. Moreover, records show that you never downloaded a demo from the location of your purchase (Norway), which raises further doubts about your claims to have tested the system thoroughly. Given your pattern of threats and suspicious behavior, I have escalated this issue to mql5.com for further investigation. Transparency and integrity are fundamental to my practice. Any interested parties may request full documentation of our communication to verify the truthfulness of my statements. Regards, Ivan Stefanov Enigmera Support
Nath
161
Nath 2025.05.26 06:35 
 

This is the best indicator I have used to date. It is worth every dollar. Ivan promptly clarified all my 'humble' questions, supporting a very effective use of the indicator. He also provides a lot of supporting material. **Also available on Tradingview Ivan, thanks again, you genius!

Değerlendirmeye yanıt