Enigmera MT5

3.67

ENIGMERA: 시장의 핵심
(이 지표는 수동형 인디케이터이며, 현재 MetaTrader 테스트 환경에서 일부 기능이 지원되지 않을 수 있습니다)

소개
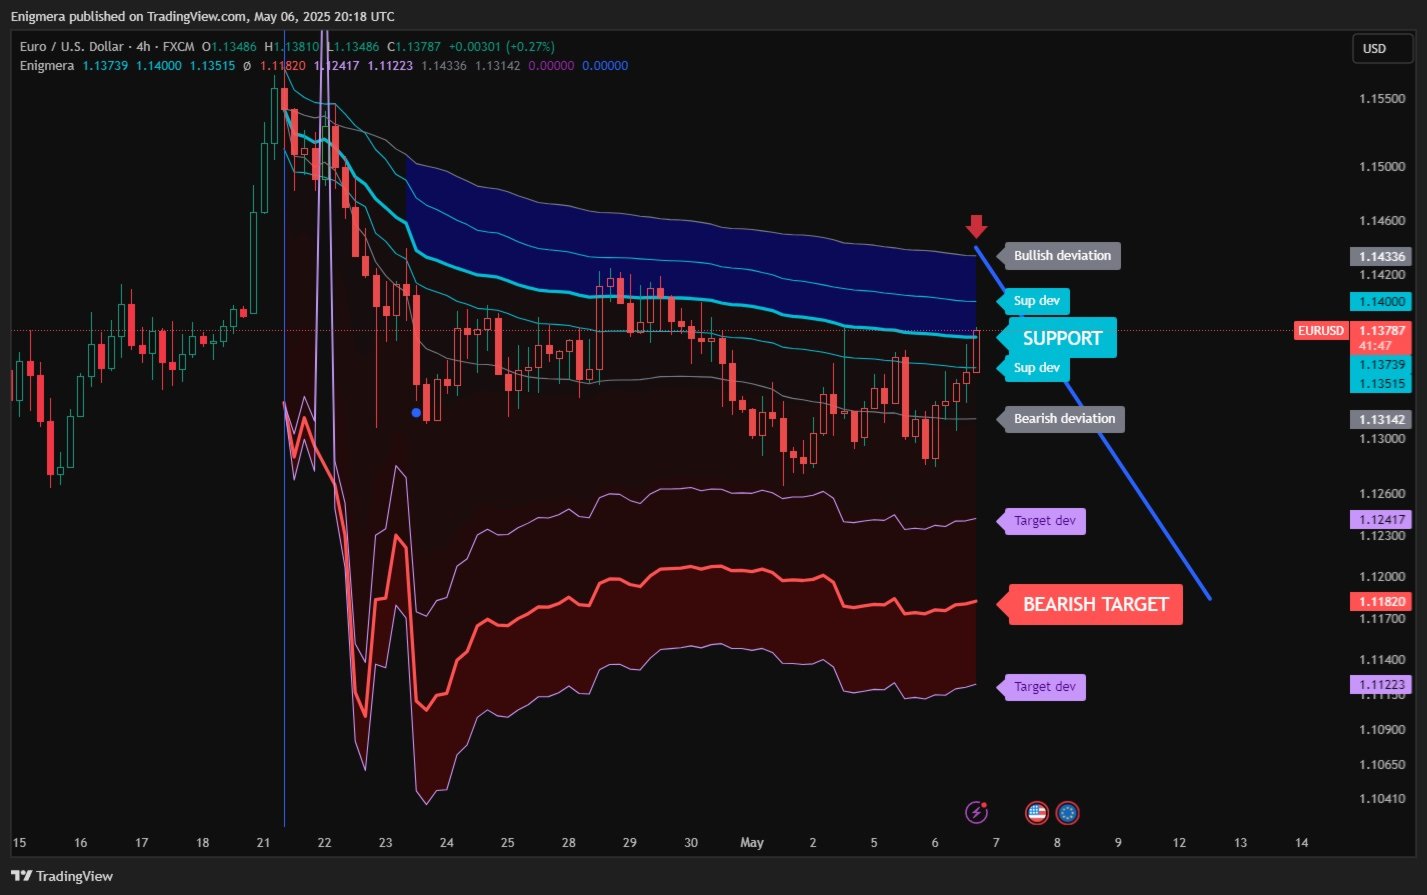
이 인디케이터와 트레이딩 시스템은 금융시장을 다루는 독창적인 접근 방식을 제시합니다. ENIGMERA는 프랙탈 사이클을 이용하여 지지선과 저항선을 정밀하게 계산합니다. 실제 매집 구간을 표시하며, 시장의 방향성과 목표를 제시합니다. 추세장이든 조정장이든 관계없이 작동하는 시스템입니다.

작동 방식
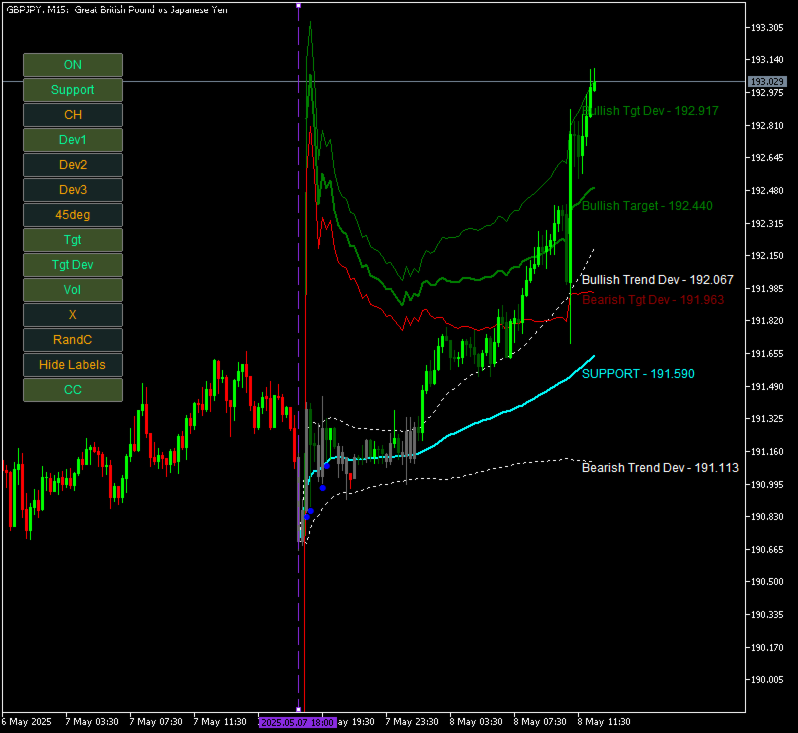
대부분의 기능은 차트 왼쪽에 있는 버튼을 통해 제어되며, 다양한 시장 상황에 빠르게 대응할 수 있습니다.

버튼 설명

ON/OFF – 전체 인디케이터를 표시하거나 숨깁니다.
Support – 주요 추세 지지선입니다.
Ch – 지지 채널을 활성화하여 허용 가능한 편차 범위를 표시합니다.
Dev1 (1차 편차) – 지지선 내 가격 움직임을 표시하며, 시장의 조정 또는 에너지 축적을 시사합니다.
Dev2 (2차 편차) – 편차 사이의 가격 움직임을 나타내며, 추세의 형성과 방향을 알려줍니다.
Dev3 (3차 편차) – 추세의 가속과 높은 변동성을 의미합니다.
45deg (45도) – 45도선과 비교하여 시장의 속도와 안정성을 보여줍니다.
Tgt (Target) – 추세의 목표선으로, 포지션 청산 수준을 나타냅니다.
Tgt Dev – 시장 목표가 변동할 수 있는 채널입니다.
Vol (Volume) – 캔들 위에 거래량 점을 표시하여 시장 거래량의 중요한 변화를 보여줍니다.
X – 시장이 목표선에 도달하면 “X”를 표시합니다.
RandC (랜덤 색상) – 인디케이터의 선과 라벨 색상을 무작위로 변경하여 시각적 구분을 돕습니다.
Hide/Show Labels – 라벨의 표시 또는 숨김을 전환합니다.
CC – 새로 추가된 버튼으로, 지지선 위의 캔들은 초록색, 지지선 아래의 캔들은 빨간색, 지지선에 닿은 캔들은 회색으로 표시됩니다. 이를 통해 시장 상태를 한눈에 파악할 수 있습니다.

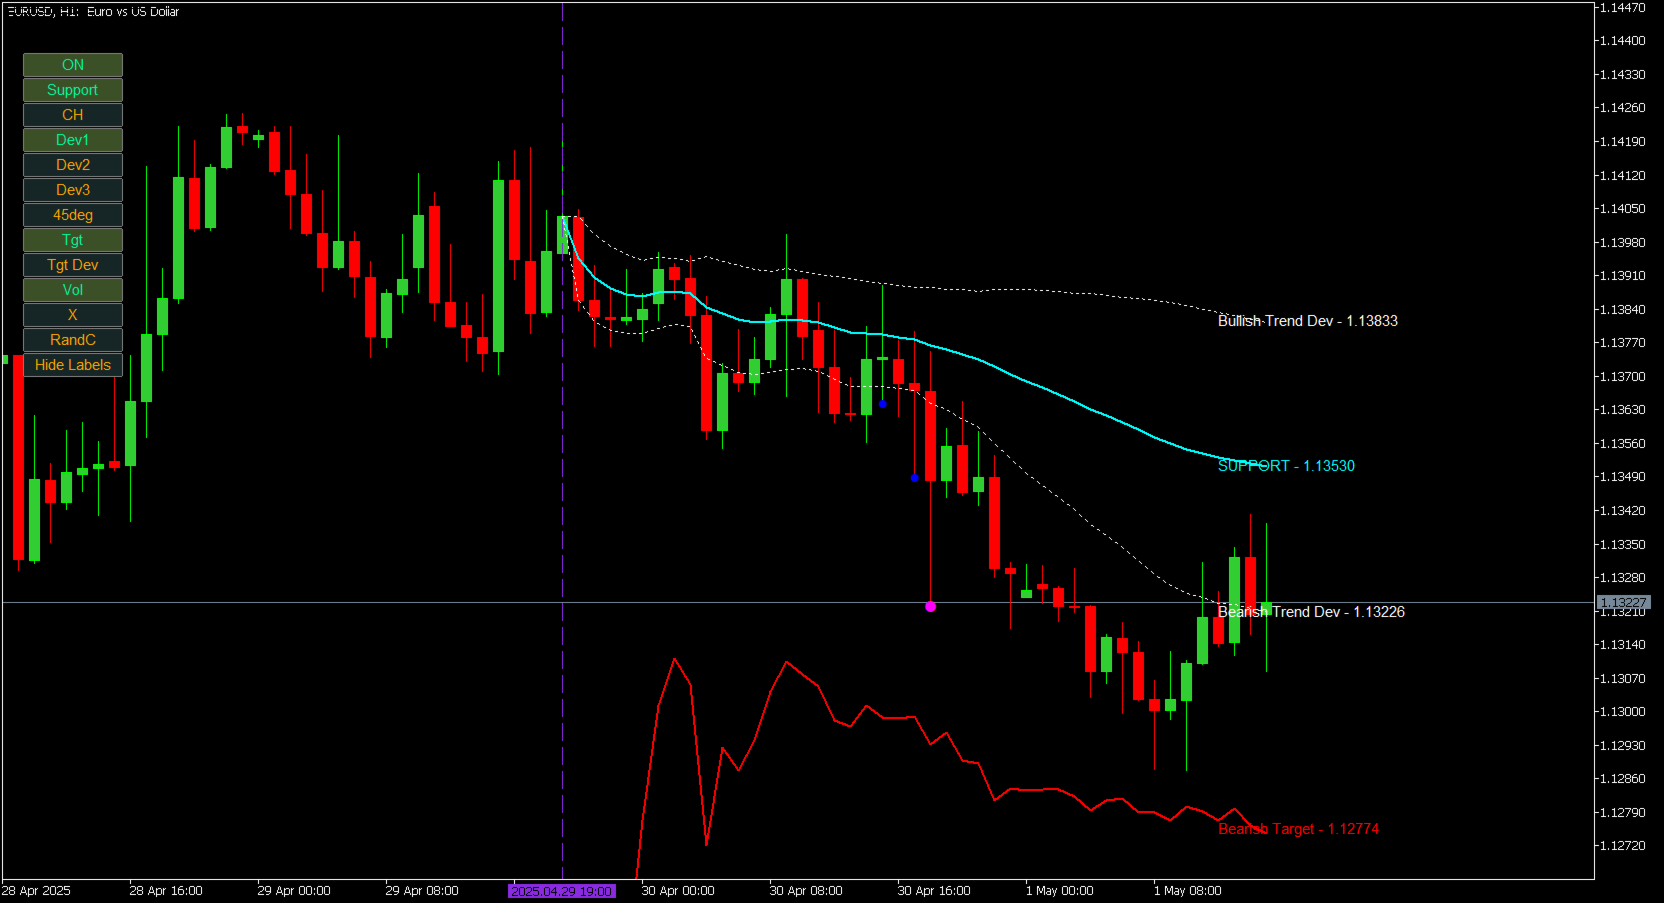
이 시스템은 시장의 ‘현재’를 완벽하게 보여줍니다. 과거 데이터를 현재와 미래로 단순히 확장하는 일반적인 인디케이터와는 다릅니다. 지지선에 있다면 그것은 진짜 지지선이며, 저항선에 있다면 그것은 진짜 저항선입니다. 특정 수준이 돌파되면 추세 전환을 의미합니다.

ENIGMERA는 고객에게 신뢰할 수 있는 시장 분석을 제공해야 하는 금융 분석가 및 컨설턴트, 그리고 최고의 정밀성과 확신을 추구하는 투자자를 위해 설계되었습니다.

탁월한 정밀도를 자랑하며, 트레이더가 명확하고 자신감 있게 판단을 내릴 수 있도록 돕습니다.

20년 이상의 트레이딩 경험과 지식을 하나의 완성된 패키지로 결합한 ENIGMERA는 직관적이면서도 사용자 설정에 의존하는 도구입니다. 그 성능은 사용자가 올바르게 설정하고 활용할 때 최대한 발휘됩니다.

권장 사항:

통화쌍: 모든 통화쌍, 모든 시장
시간 프레임: 모든 시간 프레임
최소 예치금: 제한 없음
계좌 유형: 제한 없음
브로커: 제한 없음

이 고급 인디케이터는 데이 트레이딩 및 스캘핑 전략에 이상적입니다.
Enigmera의 고급 알고리즘을 통해 재량 트레이딩을 최적화하십시오.
Forex, 주식, 지수, 암호화폐 시장 모두에 적합합니다.
MetaTrader 4, MetaTrader 5, 그리고 TradingView용으로 설계되었으며, 손절매 및 리스크 관리를 단순화합니다.

성공적인 트레이더가 되기 위해 필요한 모든 도구가 여기에 있습니다.
Enigmera는 모든 시장, 모든 시간 프레임에서 작동하며, 리페인트되지 않습니다.

구매 전
이 제품은 MetaTrader 전략 테스터에서 직접 테스트할 수 있습니다.
구매를 결정하기 전에 선호하는 종목, 시간 프레임, 시장 조건에서의 동작을 반드시 확인하시기 바랍니다.

질문이나 도움이 필요하신가요?
MQL5에서 개인 메시지로 문의해 주세요.
제품의 기능을 완전히 이해하실 수 있도록 명확한 가이드와 지원을 제공합니다.

트레이딩 지혜의 세계를 열어보세요.
당신의 금융 의사결정을 최고 수준으로 끌어올릴 준비가 되셨나요?

구매 후 전체 지원, 설치 가이드 및 보너스 자료가 제공됩니다.

Enigmera는 MT4용으로 제공됩니다.


리뷰 3
Gabriel De Araujo Lobo
1329
Gabriel De Araujo Lobo 2025.06.18 15:48 
 

It's amazing how this works, excellent to add to strategies that use price action. Excellent attention given by the seller

Nath
161
Nath 2025.05.26 06:35 
 

This is the best indicator I have used to date. It is worth every dollar. Ivan promptly clarified all my 'humble' questions, supporting a very effective use of the indicator. He also provides a lot of supporting material. **Also available on Tradingview Ivan, thanks again, you genius!

추천 제품
Gartley Projections D
Oleksandr Medviediev
3 (2)
The indicator identifies the harmonic patterns (XABCD) according to developments of H.M.Gartley ( "Profits in the Stock Market" , 1935г). It projects D-point as a point in the perspective projection (specify ProjectionD_Mode = true in the settings). Does not redraw. When a bar of the working timeframe closes, if the identified pattern point has not moved during Patterns_Fractal_Bars bars, an arrow appears on the chart (in the direction of the expected price movement). From this moment on, the ar
MercariaPattern1-2-3 відстежує рух ціни, знаходить трьоххвильові структури 1-2-3 та підсвічує момент, коли сценарій підтверджується пробоєм ключового рівня. MercariaPattern1-2-3 tracks price movement, detects three-leg 1-2-3 structures and highlights the moment when the scenario is confirmed by a key level breakout. Індикатор збирає локальні свінги в компактну фігуру 0–1–2–3 , чекає підтвердженого пробою та будує стрілку входу з готовими рівнями SL/TP. The indicator combines local swings into a
Trade smarter, not harder: Empower your trading with Harmonacci Patterns This is arguably the most complete harmonic price formation auto-recognition indicator you can find for the MetaTrader Platform. It detects 19 different patterns, takes fibonacci projections as seriously as you do, displays the Potential Reversal Zone (PRZ) and finds suitable stop-loss and take-profit levels. [ Installation Guide | Update Guide | Troubleshooting | FAQ | All Products ] It detects 19 different harmonic pri
Matreshka
Dimitr Trifonov
5 (2)
Matreshka self-testing and self-optimizing indicator: 1. Is an interpretation of the Elliott Wave Analysis Theory. 2. Based on the principle of the indicator type ZigZag, and the waves are based on the principle of interpretation of the theory of DeMark. 3. Filters waves in length and height. 4. Draws up to six levels of ZigZag at the same time, tracking waves of different orders. 5. Marks Pulsed and Recoil Waves. 6. Draws arrows to open positions 7. Draws three channels. 8. Notes support and re
RBreaker
Zhong Long Wu
RBreaker Gold Indicators는 금 선물을 위한 단기 데이 트레이딩 전략으로, 추세 추종과 데이 내 반전의 두 가지 거래 방식을 결합합니다. 추세 장에서 수익을 포착할 수 있을 뿐만 아니라, 시장이 반전될 때 적시에 이익을 확정하고 추세에 맞춰 반대 포지션을 잡을 수 있습니다. 이 전략은 미국 잡지 Futures Truth에서 15년 연속으로 가장 수익성 높은 트레이딩 전략 상위 10위 안에 선정되었습니다. 긴 라이프사이클을 자랑하며, 현재까지 국내외에서 널리 사용되고 연구되고 있습니다. 본 지표는 2026년 금 선물의 움직임을 반영하여 14일 ATR 지표를 기반으로 돌파 계수 A, 관찰 계수 B, 반전 계수 R을 보다 합리적인 값으로 정의했습니다. 매우 훌륭한 지표이며, 안정적인 연간 수익성을 달성했습니다. 강력히 추천합니다~ 위 지표는 변동성이 높은 상품에 적합하며, 매개변수는 금 선물, 주가 지수 선물 등에 적합합니다. 다른 상품이 필요한 경우 돌파 계수 A
This system is very useful for trading because it solves several classic problems: 1. Objectivity & Precision Benefit: It eliminates the trader's personal bias. Every trader might draw a trendline slightly differently, but this indicator uses a precise mathematical logic (Fractals) to find the pivot points. The resulting lines are objective and consistent every time. 2. ️ Dynamic Updates Benefit: Your chart is always current. As soon as a new pivot is confirmed, the new trendline is drawn au
Cumulative Volume Delta MAX MTF Pro v4.4 — 거래량 기반 트레이딩의 정점 단 하나의 지표로 시장을 지배하십시오: 시장의 '진짜 의도'를 읽으십시오 추측은 멈추십시오. 가격이 움직이기 전에 기관 투자자들이 무엇을 하고 있는지 먼저 파악하십시오. CVD MAX MTF Pro v4.4는 거래량 분석 기술의 정점을 보여주며, 복잡한 데이터를 명확하고 실행 가능한 신호로 변환합니다. 이번 버전에서는 정밀한 다이버전스 감지와 그라데이션 인식 모멘텀 기능을 도입하여 가격 움직임을 주도하는 숨겨진 힘을 그 어느 때보다 정확하게 드러냅니다. v4.4 신기능: 정밀함의 진화 동적 그라데이션 인식 이동평균선 (MA) 정적인 추세선을 4가지 색상의 그라데이션 시스템으로 교체했습니다. 이제 단순히 '상승 추세'를 보는 것에 그치지 않고, 해당 추세의 건강 상태를 실시간으로 확인할 수 있습니다. DeepSkyBlue: 0선 위에서 상승 중 (강세 분출) Orange: 0선 위
ATrend
Zaha Feiz
4.82 (17)
ATREND: 작동 방식 및 사용 방법 ### 작동 방식 MT5 플랫폼을 위한 "ATREND" 지표는 기술 분석 방법론의 조합을 활용하여 트레이더에게 강력한 매수 및 매도 신호를 제공하도록 설계되었습니다. 이 지표는 주로 변동성 측정을 위해 평균 진폭 범위(ATR)를 활용하며, 잠재적인 시장 움직임을 식별하기 위한 트렌드 탐지 알고리즘과 함께 사용됩니다. 구매 후 메시지를 남기면 특별 보너스 선물을 받게 됩니다. ### 주요 특징: - 동적 트렌드 탐지: 이 지표는 시장 트렌드를 평가하고 신호를 조정하여 트레이더가 현재 시장 상황에 맞춰 전략을 조정할 수 있도록 돕습니다. - 변동성 측정: ATR을 사용하여 시장의 변동성을 측정하며, 이는 최적의 손절매(SL) 및 이익 실현(TP) 수준을 결정하는 데 중요합니다. - 신호 시각화: 이 지표는 차트에 매수 및 매도 신호를 시각적으로 표시하여 트레이더의 의사 결정을 향상시킵니다. ### 운영 단계 #### 입력 및 설정 - TimeFr
Overview Harmonic Patterns MT5 is a technical analysis indicator designed for the MetaTrader 5 platform. It identifies and displays harmonic price patterns, such as Butterfly, Cypher, Crab, Bat, Shark, and Gartley, in both bullish and bearish directions. The indicator calculates key price levels, including entry, stop loss, and three take-profit levels, to assist traders in analyzing market movements. Visual elements and customizable alerts enhance usability on the chart. Features Detects six ha
Introduction to Chart Pattern MT Chart Pattern MT is a chart pattern scanner to detect the triangle pattern, falling wedge pattern, rising wedge pattern, channel pattern and so on. Chart Pattern MT uses highly sophisticated chart pattern detection algorithm. However, we have designed it in the easy to use with intuitive user interface. Chart Pattern MT will show all the patterns in your chart in the most efficient format for your trading. You do not have to do tedious manual pattern detection an
WAPV Weis Wave Chart Forex
Eduardo Da Costa Custodio Santos
The Weis Wave Chart Forex for MT5 is a Price and Volume indicator. The Price and Volume reading was widely disseminated through Richard Demille Wyckoff based on the three laws created by him: Supply and Demand, Cause and Effect and Effort vs. Result. In 1900 R.Wyckoff already used the wave chart in his analyses. Many years later, around 1990, David Weis Automated R. Wyckoff's wave chart and today we bring you the evolution of David Weis' wave chart. It shows the amount of Volume and the amount o
Phantom Edge SMC
Nattapon Chuekamhod
Phantom Edge SMC — The Ultimate Smart Money Indicator for MT5 Tired of manually drawing structures while trading SMC or ICT concepts? Let Phantom Edge SMC do the heavy lifting for you. Key Features Internal & Swing Structure: Automatically detects BOS and CHoCH across two structural levels. Order Blocks (OB): Identifies Internal and Swing OBs with automated mitigation tracking. Equal Highs / Lows: Highlights EQH / EQL to pinpoint Liquidity pools. Fair Value Gaps (FVG): Displays FVGs with
Pan PrizMA CD Phase
Aleksey Panfilov
The Expert Advisor and the video are attached in the Discussion tab . The robot applies only one order and strictly follows the signals to evaluate the indicator efficiency. Pan PrizMA CD Phase is an option based on the Pan PrizMA indicator. Details (in Russian). Averaging by a quadric-quartic polynomial increases the smoothness of lines, adds momentum and rhythm. Extrapolation by the sinusoid function near a constant allows adjusting the delay or lead of signals. The value of the phase - wave s
The Super Arrow Indicator provides non-repainting buy and sell signals with exceptional accuracy. Key Features No repainting – confirmed signals remain fixed Clear visual arrows: green for buy, red for sell Real-time alerts via pop-up, sound, and optional email Clean chart view with no unnecessary clutter Works on all markets: Forex, gold, oil, indices, crypto Adjustable Parameters TimeFrame Default:   "current time frame" Function:   Sets the time frame for indicator calculation Options:   Can
"Impulses and Corrections 5" is created to help traders navigate the market situation. The indicator shows multi-time frame upward and downward "Impulses" of price movements. These impulses are the basis for determining the "Base" , which is composed of zones of corrections of price movements, as well as "Potential" zones for possible scenarios of price movement. Up and down impulses are determined based on a modified formula of Bill Williams' "Fractals" indicator. The last impulse is always "U
Weis Wave Scouter
Jean Carlos Martins Roso
Weis Wave Scouter는 MetaTrader 5용으로 개발된 혁신적인 지표로, Wyckoff 방법론과 VSA(Volume Spread Analysis)의 검증된 원칙을 결합했습니다. 높은 정확성과 깊이 있는 분석을 원하는 트레이더를 위해 설계되었으며, 누적 거래량 파동 분석을 통해 시장을 전술적으로 읽고 추세 반전 및 지속의 핵심 포인트를 식별하는 데 도움을 줍니다. 이 지표는 선명한 시각적 인터페이스를 제공하며, Classic, NightVision, OceanBreeze 등 다양한 테마의 사용자 지정 가능한 색상 히스토그램을 통해 상승 및 하락 파동을 시각화합니다. 주요 기능에는 거래량 급증 감지, 낮은 활동 영역(DeadZone) 식별, 거래량 기반 파동 반전 경고 설정이 포함되어 있습니다. 또한 노력 대비 결과 분석, 원인과 결과 분석, 수요와 공급 분석 등 Wyckoff 및 VSA 이론의 핵심 요소를 지원합니다. Brick Size, Volume Scale Fact
Overview The Market Perspective Structure Indicator is a comprehensive MetaTrader indicator designed to provide traders with a detailed analysis of market structure across multiple timeframes. It identifies and visualizes key price action elements, including swing highs and lows, Break of Structure (BOS), Change of Character (CHOCH), internal structures, equal highs/lows, premium/discount levels, previous levels from higher timeframes, and trading session zones. With extensive customization opt
Professional Gold Trading Levels Indicator Features: - Daily & Weekly Pivot Points - Fibonacci Retracement Levels   - Round Number Levels - Customizable Colors & Fonts - Auto-Update Daily - Clean & Simple Interface Perfect for Gold (XAUUSD) traders Reliable Support/Resistance levels Lightweight & Fast Performance Easy to install and use Compatible with all MT5 accounts. No complex settings required! SimpleGoldLevels v1.0 - User Manual Professional Support & Resistance Levels
Gioteen Volatility Index (GVI) - your ultimate solution to overcoming market unpredictability and maximizing trading opportunities. This revolutionary indicator helps you in lowering your losing trades due to choppy market movements. The GVI is designed to measure market volatility, providing you with valuable insights to identify the most favorable trading prospects. Its intuitive interface consists of a dynamic red line representing the volatility index, accompanied by blue line that indicate
Introduction to X3 Chart Pattern Scanner X3 Cherart Pattern Scanner is the non-repainting and non-lagging indicator detecting X3 chart patterns including Harmonic pattern, Elliott Wave pattern, X3 patterns, and Japanese Candlestick patterns. Historical patterns match with signal patterns. Hence, you can readily develop the solid trading strategy in your chart. More importantly, this superb pattern scanner can detect the optimal pattern of its kind. In addition, you can switch on and off individu
The RSI Divergence + FVG Signal indicator combines Relative Strength Index (RSI) Divergence with Fair Value Gap (FVG) detection to generate high-probability buy and sell signals based on both momentum shifts and institutional imbalance zones. Core Features: RSI Divergence Detection : Identifies both regular and hidden bullish/bearish divergences between price and RSI. Divergences indicate potential trend reversals or continuation. FVG Zone Recognition : Detects Fair Value Gaps (imbalances caused
Elliott Wave Trend MT5
Young Ho Seo
4 (4)
Elliott Wave Trend was designed for the scientific wave counting. This tool focuses to get rid of the vagueness of the classic Elliott Wave Counting using the guideline from the template and pattern approach. In doing so, firstly Elliott Wave Trend offers the template for your wave counting. Secondly, it offers Wave Structural Score to assist to identify accurate wave formation. It offers both impulse wave Structural Score and corrective wave Structure Score. Structural Score is the rating to sh
CosmiCLab FIBO
Kirils Subins
CosmiCLab SMC FIBO CosmiCLab SMC FIBO is a professional trading indicator designed for traders who use Smart Money Concepts (SMC), market structure analysis and Fibonacci retracement levels. The indicator automatically detects market swings and builds Fibonacci levels based on the latest impulse movement. It also identifies market structure changes such as BOS (Break of Structure) and CHOCH (Change of Character), helping traders understand the current market direction. CosmiCLab SMC FIBO also pr
Key level wedge MT5
Presley Annais Tatenda Meck
The   Key level wedge MT5   indicator automatically draws rising wedge pattern and falling wedge pattern for you on the chart. This pattern is really good when used as a confirmation entry at key support & resistance, supply & demand and reversal zones. Advantages  The   Key level wedge MT5   block DOES NOT RE-PAINT, giving you confidence when a signal appears and also helps when looking back.  The   Key level wedge MT5   includes an on/off button on the chart to easily keep the charts clean
The "MR Volume Profile Rectangles 5" indicator is a charting tool that displays trading volume at different price levels rather than time intervals. A key concept in volume profile is the point of control (POC) —the price level with the highest volume traded during the session or time range. While tools like VWAP or OBV provide volume trends, the "MR Volume Profile Rectangles 5" indicator offers granular detail about where the most market activity occurs at specific price levels. This makes it a
우선적으로, 이 거래 도구는 전문적인 거래에 이상적인 비-다시 그리기 및 지연되지 않는 지표입니다.  온라인 강좌, 사용자 매뉴얼 및 데모. 스마트 가격 액션 컨셉트 인디케이터는 신규 및 경험 많은 트레이더 모두에게 매우 강력한 도구입니다. Inner Circle Trader Analysis 및 Smart Money Concepts Trading Strategies와 같은 고급 거래 아이디어를 결합하여 20가지 이상의 유용한 지표를 하나로 결합합니다. 이 인디케이터는 스마트 머니 컨셉트에 중점을 두어 대형 기관의 거래 방식을 제공하고 이동을 예측하는 데 도움을 줍니다.  특히 유동성 분석에 뛰어나 기관이 어떻게 거래하는지 이해하는 데 도움을 줍니다. 시장 트렌드를 예측하고 가격 변동을 신중하게 분석하는 데 탁월합니다. 귀하의 거래를 기관 전략에 맞추어 시장의 동향에 대해 더 정확한 예측을 할 수 있습니다. 이 인디케이터는 시장 구조를 분석하고 중요한 주문 블록을 식별하고 다양
Nirvana trend
Aiireza Arjmandi Nezhad
5 (1)
Nirvana Trend — ATR 기반 위험 관리 프레임워크를 갖춘 추세 지표 주의: 이 도구는 분석 정보를 제공할 뿐이며, 수익·소득 또는 특정 결과(평가/챌린지 합격 포함)를 보장, 약속하거나 시사하지 않습니다. 사용 결정과 책임은 전적으로 사용자에게 있습니다. 소개 Nirvana Trend는 의사결정 과정을 표준화하고 거래 규율을 강화하도록 설계된 기술적 분석 지표입니다. 필터링된 신호, 다중 시간대 확인, ATR 기반의 제안형 손절매(SL) 거리 계산, 단계별 청산 수준(TP1/TP2/TP3)을 제공하여 보다 체계적으로 거래를 계획할 수 있도록 돕습니다. 본 제품은 어떤 결과도 보장하지 않으며 사용자의 전문적 판단을 대체하지 않습니다. 적합 대상 일간/총 드로다운 제한 등 엄격한 리스크 관리 규칙으로 운용하는 트레이더 진입/청산을 위한 명확한 프레임워크와 트레이딩 계획 문서화를 원하는 사용자 주요 기능 민감도 조절이 가능한 추세·모멘텀 필터 다중 시간대 확인: 상위 시간대
Maximum Trend Arrows OT MT5
Mulweli Valdaz Makulana
STRICTLY FOR BOOM INDEX ONLY!!!!! Here I bring the Maximum Trend Arrows OT1.0 MT5 indicator. This indicator is made up of a combination of different trend indicators for entries and exits, for entries an orange arrow will paint on the chart below the current market and a red flag for closing of trades and it produces buy arrows only. When the orange arrow appears, it will appear along with it's sound to notify you. The 1H timeframe is recommended, don't use it anywhere else than on the 1H timefr
Chỉ báo này sẽ thông báo cho bạn nếu cấu hình xu hướng thành công. Tín hiệu theo xu hướng không nên được tăng theo, nhưng tín hiệu mua ở mức giá thấp theo mô hình giao dịch thông thường của bạn, hoặc tín hiệu bán ở mức giá tốt, là một lựa chọn rất tốt. Hãy thiết lập nó trên khung thời gian lớn hơn và theo dõi các khung thời gian nhỏ hơn, bám sát các xu hướng chính. Tôi thường thiết lập ba khung thời gian gần nhau nhất và không bao giờ đi ngược tín hiệu của INdicator này. INdicator   này không có
Triangle Pattern Gann v3.1 - Complete Feature Documentation Core Functionality OverviewTriangle Pattern Gann v3.1 is a sophisticated MetaTrader 5 indicator that combines W.D. Gann's geometric trading principles with advanced triangle pattern recognition to deliver actionable trading signals. Primary Features1. Triangle Pattern Detection SystemAscending Triangle Recognition Function: Automatically identifies bullish continuation patterns Detection Criteria: Flat horizontal resistance line
이 제품의 구매자들이 또한 구매함
Azimuth Pro
Ottaviano De Cicco
5 (6)
LAUNCH PROMO Azimuth Pro price is initially set at 299$ for the first 100 buyers. Final price will be 499$ . THE DIFFERENCE BETWEEN RETAIL AND INSTITUTIONAL ENTRIES ISN'T THE INDICATOR — IT'S THE LOCATION. Most traders enter at arbitrary price levels, chasing momentum or reacting to lagging signals. Institutions wait for price to reach structured levels where supply and demand actually shift. Azimuth Pro maps these levels automatically: swing-anchored VWAP, multi-timeframe structure lines, an
ARICoins
Temirlan Kdyrkhan
ARICoin is a powerful trading companion designed to generate high-probability entry signals with dynamic TP/SL/DP levels based on volatility. Built-in performance tracking shows win/loss stats, PP1/PP2 hits, and success rates all updated live. Key Features: Buy/Sell signals with adaptive volatility bands Real-time TP/SL/DP levels based on ATR Built-in MA Filter with optional ATR/StdDev volatility Performance stats panel (Success, Profit/Loss, PP1/PP2) Alerts via popup, sound, push, or email Cust
AriX
Temirlan Kdyrkhan
1 (4)
AriX Indicator for MT5 A powerful trend-following and signal-evaluation tool AriX is a custom MT5 indicator that combines Moving Averages and ATR-based risk/reward logic to generate clear buy/sell signals. It visualizes dynamic SL/TP levels, evaluates past trade outcomes, and displays win/loss statistics in a clean on-chart panel. Key features include: Buy/Sell signals based on MA crossovers ATR-based SL/TP1/TP2/TP3 levels with visual lines and labels Signal outcome tracking with real-time stat
ARIPoint
Temirlan Kdyrkhan
ARIPoint is a powerful trading companion designed to generate high-probability entry signals with dynamic TP/SL/DP levels based on volatility. Built-in performance tracking shows win/loss stats, PP1/PP2 hits, and success rates all updated live. Key Features: Buy/Sell signals with adaptive volatility bands Real-time TP/SL/DP levels based on ATR Built-in MA Filter with optional ATR/StdDev volatility Performance stats panel (Success, Profit/Loss, PP1/PP2) Alerts via popup, sound, push, or email Cu
OmniSync Projection
Antonio-alin Teculescu
5 (1)
Chronos Fractal Engine is an innovative price projection indicator for MetaTrader 5, designed to transform your technical analysis by intelligently identifying and projecting historical price patterns. Built upon an advanced correlation algorithm and the fractal principles of the market, this powerful tool visualizes potential future price movements, giving you a unique edge in your trading decisions. What is Chronos Fractal Engine? At its core, the Chronos Fractal Engine employs a sophisticat
Gem SIGNAL
Shengzu Zhong
GEM Signal Pro - 전문 트레이딩 인디케이터 정밀한 진입. 리페인트 없음. 한 번에 하나의 결정. GEM Signal Pro는 MetaTrader 4 및 MetaTrader 5를 위해 구축된 전문가급 추세추종형 인디케이터입니다. 대부분의 리테일 인디케이터에 흔한 노이즈, 지연, 과장된 약속 없이, 깔끔하고 실행 가능한 신호를 요구하는 트레이더를 위해 설계되었습니다. 모든 신호는 독자적인 다층 확인 엔진을 통해 평가됩니다. GEM Signal Pro가 다른 이유 대부분의 인디케이터는 색깔 화살표 하나만 보여주고 나머지는 사용자가 추측하게 만듭니다. GEM Signal Pro는 완전한 거래 셋업을 제공합니다. 유효한 기회가 감지되면, 인디케이터는 시드 신호를 표시하고, 구조적 확인을 기다리며, 캔들 패턴 인식을 통해 최적의 진입 타이밍을 식별한 뒤, 차트에 정확한 리스크 관리 레벨을 그려줍니다. 진입가, 손절가, 그리고 각기 대응하는 손익비와 함께 3개의 목표가를 한눈에 볼
" Dynamic Scalper System MT5 " 지표는 추세 파동 내에서 스캘핑 방식으로 거래하도록 설계되었습니다. 주요 통화쌍 및 금에서 테스트되었으며, 다른 거래 상품과의 호환성이 가능합니다. 추가적인 가격 변동 지원을 통해 추세에 따라 단기 포지션 진입 신호를 제공합니다. 지표의 원리 큰 화살표는 추세 방향을 결정합니다. 작은 화살표 형태의 스캘핑 신호를 생성하는 알고리즘은 추세 파동 내에서 작동합니다. 빨간색 화살표는 상승 방향을, 파란색 화살표는 하락 방향을 나타냅니다. 민감한 가격 변동선은 추세 방향으로 그려지며, 작은 화살표의 신호와 함께 작용합니다. 신호는 다음과 같이 작동합니다. 적절한 시점에 선이 나타나면 진입 신호가 형성되고, 선이 있는 동안 미결제 포지션을 유지하며, 완료되면 거래를 종료합니다. 권장되는 작업 시간대는 M1~H4입니다. 화살표는 현재 캔들에 형성되며, 다음 캔들이 이미 시작되었더라도 이전 캔들의 화살표는 다시 그려지지 않습니다. 입
CGE Trading Suite
Carl Gustav Johan Ekstrom
5 (1)
CGE Trading Suite delivers the analytical edge typically reserved for professional trading desks. The platform integrates a full suite of analytical tools into one seamless workflow: dynamic grid mapping, liquidity behavior analysis, ECM, trend lines, MIDAS, trade cycles, and directional channel projections. Together, these provide a unified view of market structure and momentum. Directional clarity is further enhanced by the capital flow index, which measures currency basket strength to identif
ARIScalping
Temirlan Kdyrkhan
ARIScalp is a powerful trading companion designed to generate high-probability entry signals with dynamic TP/SL/DP levels based on volatility. Built-in performance tracking shows win/loss stats, PP1/PP2 hits, and success rates all updated live. Key Features: Buy/Sell signals with adaptive volatility bands Real-time TP/SL/DP levels based on ATR Built-in MA Filter with optional ATR/StdDev volatility Performance stats panel (Success, Profit/Loss, PP1/PP2) Alerts via popup, sound, push, or email Cus
Transaction Speed MT5
Ivan Stefanov
5 (3)
이 지표는 시장에서 관심이 나타나는 영역 을 강조 표시한 후, 주문이 누적되는 영역 을 보여줍니다. 이는 **대규모 오더북(호가창)**처럼 작동합니다. 이것은 거대한 자금 을 위한 인디케이터입니다. 성능은 탁월하며, 시장에서 어떤 관심이 있든 반드시 포착할 수 있습니다 . (이것은 완전히 새로 작성되고 자동화된 버전 입니다 – 이제 수동 분석은 필요하지 않습니다.) **거래 속도(Transaction Speed)**는 새로운 개념의 인디케이터로, 시장에 대규모 주문이 언제, 어디에 쌓이는지를 보여주며 , 그 이점을 분석합니다. 매우 초기 단계에서 트렌드 전환 을 감지할 수 있습니다. FX 시장에서 흔히 사용하는 "거래량(volume)"은 오해입니다. 실제로는 시간당 가격 변화량 이므로, 올바른 용어는 거래 속도 입니다. 우리가 어떻게 사고하고, 행동하며, 분석하느냐 가 가장 중요합니다. 분석 패러다임의 전환 은 필수적입니다. 이 인디케이터는 외환 시장에서의 볼륨 개념을 논리적으로
TrendMaestro5
Stefano Frisetti
note: this indicator is for METATRADER4, if you want the version for METATRADER5 this is the link:  https://www.mql5.com/it/market/product/108106 TRENDMAESTRO ver 2.5 TRENDMAESTRO recognizes a new TREND from the start, he never makes mistakes. The certainty of identifying a new TREND is priceless. DESCRIPTION TRENDMAESTRO identifies a new TREND in the bud, this indicator examines the volatility, volumes and momentum to identify the moment in which there is an explosion of one or more of these da
Weis Wave with Alert MT5
Trade The Volume Waves Single Member P.C.
4.94 (17)
Rental/Lifetime Package Options and Privileges  Rent Monthly Six Months   Yearly/Lifetime Weis Wave with Speed with Alert+Speed Index x x x Manual  x x x Quick Set up Video x x x Blog x x x Lifetime Updates x x x Setup and Training Material x x Discord Access Channel "The SI traders"          x Rectangle Break Alert Tool      x How to trade with it:    http://www.tradethevolumewaves.com   ** If you purchase please contact me to setup your  : Training Room and  complete manual access.  Wei
Rtc ML Ai Predictor
Muhammad Faisal Sagala
Rtc ML Ai | Predictor CORE MACHINE LEARNING ENGINE Adaptive ML Market Predictor – Multi-Bar Trend & Candle Forecast What This Indicator Does This indicator is a  real-time market prediction engine  designed to analyze price behavior and estimate  future market tendencies . Unlike conventional indicators, this system  does not rely on static parameters or historical curve-fitting , but adapts its internal state dynamically during live market operation. Instead of using static rules, the indic
Jita Indicator Pro
Jimmy Mwaba
1 (1)
Jita Indicator Pro MT5 | All Timeframes Professional Trend Agreement System – Premium Edition ($500) What Is Jita Indicator Pro? Jita Indicator Pro is a structured trend-confirmation system designed for serious traders who value precision, alignment, and controlled signal behavior. It combines: Advanced band-based trend direction logic ATR-driven structural trigger engine Dual-confirmation agreement system Locked history update design This indicator prints signals only when multiple conditions
Pointer Trend Switch — precision trend reversal indicator Pointer Trend Switch is a high-precision arrow indicator designed to detect key moments of trend reversal based on asymmetric price behavior within a selected range of bars. It identifies localized price impulses by analyzing how far price deviates from the opening level, helping traders find accurate entry points before a trend visibly shifts. This indicator is ideal for scalping, intraday strategies, and swing trading, and performs equa
Max Ribbon Mt5
Stefano Frisetti
WARNING: This indicator is distributed EXCLUSIVELY on MQL5.com MT4 version:   https://www.mql5.com/it/market/product/160363 MT5 version:   https://www.mql5.com/it/market/product/160410 ============================================================================================= MAX RIBBON ver 1.00 The indicator that shows you the TREND clearly and unambiguously! ============================================================================================= DESCRIPTION MAX RIBBON is an advanced tre
IVISTscalp5
Vadym Zhukovskyi
5 (6)
당신에게 소개하는 iVISTscalp5 지표는 독특하면서도 거래 작업에서 효과적입니다. 이 지표는 시간 데이터를 기반으로 하며 금융 시장의 많은 경험과 깊은 분석의 결과입니다. iVISTscalp5 지표는 수동 거래에 뛰어난 도구입니다. 편리성, 간단함 및 시각화 - 모든 복잡성은 숨겨져 있습니다. 우리는 iVISTscalp5 지표의 설정과 사용을 최대한 단순화했습니다. 이 지표는 MT5 터미널에서 가지고 있는 모든 금융 상품에 적합합니다. 시간 기준으로 작동하는 시간은 4am에서 8pm (UTC+3)입니다. iVISTscalp5 지표 메뉴 (스크린샷 1 참조): History - 표시할 주간 수 계산 dT_min - 시간 설정 간격 선택 (분) TFline - 수평 볼륨 생성 (타임프레임) BARSline - 수평 볼륨 생성 (바 수) TFtrend1 - 매일 채널 생성 (타임프레임) BARStrend1 - 매일 채널 생성 (바 수) TFtrend2 - 주간 채널 생성 (타임프레임
+++++++++++++++++++++++++++++++++++++++++++++++++++++++++++++++++++++++++++++++++++++++++++++++++ +++ Link to EURUSD Only Free Version -->  https://www.mql5.com/en/market/product/156904?source=Unknown +++++++++++++++++++++++++++++++++++++++++++++++++++++++++++++++++++++++++++++++++++++++++++++++++ Hallo Trader, This is a traditional GANN & FIBONACCI strategy based on detection of an impulsive move in the opposite direction. This is called a Breakout. At the moment of Breakout, the indicator draw
Big Player Range
Thalles Nascimento De Carvalho
5 (3)
BigPlayerRange – MT5 최고의 지표 BigPlayerRange 는 MetaTrader 5에서 미니 인덱스와 미니 달러를 위한 최고의 지표 로 평가받고 있습니다. 이 도구는 주요 기관 투자자들의 전략적 영역을 강조하여 높은 정확도의 기관 기술 분석을 제공합니다. BigPlayerRange 사용법: 이 지표는 매수 구간(녹색선)과 매도 구간(빨간선)을 표시합니다. 가격이 이 구간 밖에서 마감되면 추세 움직임이 예상됩니다. 녹색선 위에서 마감: 강한 매수세와 상승 추세 가능성. 빨간선 아래에서 마감: 매도 압력과 하락 가능성. 범위 내에서 마감: 횡보 시장, 돌파 신호 대기. 주요 혜택: 기관 투자자 영역 매핑: 주요 투자자들의 활동 구간을 식별합니다. 자동 목표 지점 산출: 거래 종료에 적합한 목표 지점을 제공합니다. 풀백 분석: 리스크 관리를 위한 가격 반등 가능성 평가. 활용 방법: BigPlayerRange와 함께 Imba
무료 AUX 지표, EA 지원 및 전체 가이드를 얻으시려면 방문하세요 – https://www.mql5.com/en/blogs/post/763955 트렌드를 포착하세요. 패턴을 읽으세요. 진입 시점을 타이밍하세요. 30초 이내의 3단계! 분석 없이도 쉽게 거래하세요 — 당신의 스마트 어시스턴트가 워크플로우를 단순화해 드립니다. 더 이상 차트 과부하 없음. 스마트 바이어스 감지로 자신감 있게 거래하세요. 모든 통화, 암호화폐, 주식, 금속, 지수 및 모든 시간대와 호환됩니다. 그냥 클릭하고 실행하세요 — 정말 간단합니다. 속도와 명확성을 원하는 바쁜 트레이더에게 이상적입니다. TPTSyncX는 추세, 패턴, 그리고 캔들스틱 트리거 분석을 하나로 통합하여 깨끗하고 지능적인 시각 시스템으로 동기화하는 강력한 올인원 MetaTrader 5 인디케이터입니다. 명확성, 정밀성, 속도를 원하는 트레이더를 위해 설계되었으며, 가격 행동, 구조적 패턴 및 시장 타이밍 도구의 조합을 통해 높은 확
Meravith MT5
Ivan Stefanov
마켓 메이커를 위한 도구. Meravith는 다음과 같은 기능을 제공합니다: 모든 타임프레임을 분석하고 현재 유효한 추세를 표시합니다. 강세와 약세 거래량이 동일한 유동성 구간(거래량 균형 구간)을 강조 표시합니다. 서로 다른 타임프레임의 모든 유동성 레벨을 차트에 직접 표시합니다. 텍스트 기반 시장 분석을 생성하여 참고용으로 제공합니다. 현재 추세를 기반으로 목표가, 지지선 및 손절가를 계산합니다. 거래의 위험 대비 보상 비율(Risk/Reward)을 계산합니다. 계좌 잔고에 따라 포지션 크기를 산출하고 잠재 수익을 추정합니다. 시장에 중대한 변화가 발생할 경우 경고도 제공합니다. 지표의 주요 라인: 강세/약세 거래량 소진 라인 — 목표가로 사용됩니다. 시장 추세를 나타내는 라인. 시장이 강세인지 약세인지에 따라 색상이 변경되며 추세 지지선 역할을 합니다. 색상은 주로 시장 심리를 보여줍니다. 거래량 균형선(Eq). Eq(Volume Equilibrium) 라인은 시스템의 핵심입니
Frontier Pivots
Nestor Jose Mendez Boza
FRONTIER PIVOTS - Geometric Levels Indicator This indicator plots support and resistance levels/ranges on the chart using mathematical calculations. It helps traders identify potential price reaction zones based on geometric patterns. Main Features: Automatically calculates and displays key price levels Plots both support and resistance lines Uses daily price data for level calculation Clean visual presentation with different colors for different level types No repainting - levels remain static
Hunter Spike
Jaime Humberto Gomez Arias
Hunter Spike This indicator consists of two regression channels calibrated with the current movement of the synthetic index algorithm, for any Deriv or Weltrade broker. Each channel has a signal, a target that alerts us when the price touches them, indicating buys on booms or gains and sells on crashes or pains. -configuration for booms or gains: Channel zone 1 (30) Channel zone 2 (0) -configuration for crashes or pains: Channel zone 1 (100) Channel zone 2 (70) Zones freely configurable by
VTrende Pro
Andrii Diachenko
5 (1)
VTrende Pro - MTF indicator for trend trading with a display panel for MT5 *** Videos can be translated into any language using subtitles (video language - Russian) Although the signals of the VTrende Pro indicator can be used as signals of a full-fledged trading system, it is recommended to use them in conjunction with the Bill Williams TS. VTrende Pro is an extended version of the VTrende indicator. Difference between Pro version and VTrende: - Time zones - Signal V - signal 1-2 waves -    S
Recommended TimeFrame >= H1. 100% Non Repainted at any moment.  Use it carefully, only with Trend Direction. Trading Usage: 2 Variants: as Range System or as BreakOut System (Both Only With Trend Direction)::: (Always use StopLoss for minimise Risk); [1] as Range System: (Recommended) in UP TREND:  - BUY in Blue Line , then if price goes down by 50 points (on H1) open Second BUY.   Close in any Profit you wish: TrailingStop(45 points) or Close when Price touches upper Gold Line. in DOWN TREND
FXLAND Smart Reversal Indicator (MT5) FXLAND Smart Reversal Indicator is a professional technical analysis tool designed to help traders identify potential price reversal zones and key market turning points with clarity and precision. The best reversal indicator and price return by choosing only one ceiling or floor in each time frame A masterpiece of combining mathematics and Gann, fractal matrix, Fibonacci, movement angle and time. Completely intelligent Key Features Detects potenti
Pantera Indicator
Temirlan Kdyrkhan
5 (1)
A tool for on-chart strategy backtesting and performance analysis. A utility for developing, debugging, and testing custom trading ideas and indicator functions. An indicator designed to quickly test trading concepts and visualize the effectiveness of different input parameters. An all-in-one sandbox for testing everything from simple crossovers to complex, multi-condition trading systems.
AlgoEAs Trend Dashboard V1 Indicator for MT5 Introduction: This is a Dashboard Indicator based on 7 built in Multi Timeframe indicators. This strategy gives Buy/Sell Ideas based on 9 trend states. Easy to view gas guage to view current trend. Has as optional Alerts to enable with 9 messages. Run on M15 chart, with M15, H1, and H4 indicator time frames. Great tool! Features: Non-Repainting Dashboard For Desktop MT5 Only, Works On Any Mt5 Pair Great for Intraday and Swing Trading Easy view gas
WanaScalper
Isaac Wanasolo
1 (1)
A scalping indicator based on mathematical patterns, which on average gives signals with relatively small SL, and also occasionally helps to catch big moves in the markets (more information in the video) This indicator has three main types of notifications: The first type warns of a possible/upcoming signal on the next bar The second type indicates the presence of a ready signal to enter the market/open a position The third type is for SL and TP levels - you will be notified every time price re
Historical Similarity Matcher Indicator (HI.SI.MA) Try it free today — demo version now available!   https://www.mql5.com/en/market/product/167114 Overview The Historical Similarity Matcher is a technical analysis indicator for MetaTrader 5. It scans historical price data to find segments that show statistical similarity to a user-selected reference period on the chart.
제작자의 제품 더 보기
RSI Divergence Pulse는 다이버전스 감지, 다중 타임프레임 분석, 시각 도구를 하나의 가벼운 애플리케이션에 통합한 포괄적인 RSI 지표입니다. Regular 및 Hidden 다이버전스를 자동으로 식별하고, 실시간 Multi-Timeframe RSI 패널을 표시하며, OB/OS 영역을 시각적으로 인식하기 쉽게 채우고, 가격 차트와 RSI 하위 창 모두에 다이버전스 선을 그려주며, Buy/Sell 화살표를 배치하고 실시간 알림을 제공합니다. Features Color-Coded RSI Line RSI 선은 현재 영역에 따라 색상이 변경됩니다. 파랑은 중립 영역(30~70)을 나타냅니다. 초록은 과매수 영역(70 이상)을 나타냅니다. 빨강은 과매도 영역(30 이하)을 나타냅니다. RSI Signal Line RSI의 SMA(기본 기간 9)가 신호선으로 작동합니다. RSI와 신호선의 교차는 타이밍 정보를 추가로 제공합니다. 차이값(Diff)은 대시보드에 표시됩니다. Auto
MERAVITH SCANNER는 MetaTrader 5용 전문 금융 시장 지표로, 여러 분석 도구를 하나의 통합 시스템으로 결합합니다. 독점적인 거래량 가중 평균 가격(VWAP) 방법론을 사용하여 모든 계산을 자동으로 수행하며, 주관적인 해석을 완전히 배제합니다. 이 지표는 모든 자산 클래스(Forex, 주식, 지수, 상품, 암호화폐)와 M1부터 월간 차트까지 모든 시간 프레임에서 작동합니다. 기본 원리는 “가격은 거래량을 따른다”입니다. MERAVITH는 기관 거래량이 집중되는 위치를 식별하고, 그 집중에서 수학적으로 정확한 가격 수준을 도출합니다. 예측이나 투기를 하지 않으며, 계산만 수행합니다. MERAVITH SCANNER를 사용하면 28개의 주요 Forex 통화쌍을 모든 시간 프레임에서 단 2~3분 만에 스캔할 수 있습니다. 또한 원하는 시장을 스캔할 수도 있으며, 예를 들어 약 100개의 주식을 약 10분 안에 스캔할 수 있습니다. 지표는 소진 레벨, 균형선, 편차, 통계
Meravith AUTO
Ivan Stefanov
5 (1)
Meravith Auto는 Meravith 거래 시스템의 자동화 버전입니다. 이 지표는 색상이 변하는 추세선으로 구성되어 있습니다. 상승 추세일 때는 녹색, 하락 추세일 때는 빨간색입니다. 이것이 추세 지지선입니다. 상승 거래량과 하락 거래량이 같은 유동성 라인. 세 배 상승 편차 라인. 세 배 하락 편차 라인. 높은 거래량을 나타내는 보라색 및 파란색 점. 보라색 점은 평균 거래량보다 2편차 큰 거래량을 나타내며, 파란색 점은 2편차를 나타냅니다. 사용 방법은? 상승 추세선과 추세선 위의 유동성은 상승 추세를 나타냅니다. 시장이 상승할 것으로 예상됩니다. 롱 포지션을 엽니다. 하락 추세선과 추세선 아래의 유동성은 하락 추세를 나타냅니다. 시장이 하락할 것으로 예상됩니다. 숏 포지션을 엽니다. 다른 지표와 자유롭게 조합하여 사용할 수 있습니다. 모든 통화쌍과 모든 시간대에서 사용할 수 있습니다. 브로커마다 표시하는 거래량이 다르기 때문에 결과가 다를 수 있습니다. 거래량이 많은 대형
Meravith
Ivan Stefanov
5 (3)
마켓 메이커를 위한 도구. Meravith는 다음과 같은 기능을 제공합니다: 모든 타임프레임을 분석하고 현재 유효한 추세를 표시합니다. 강세와 약세 거래량이 동일한 유동성 구간(거래량 균형 구간)을 강조 표시합니다. 서로 다른 타임프레임의 모든 유동성 레벨을 차트에 직접 표시합니다. 텍스트 기반 시장 분석을 생성하여 참고용으로 제공합니다. 현재 추세를 기반으로 목표가, 지지선 및 손절가를 계산합니다. 거래의 위험 대비 보상 비율(Risk/Reward)을 계산합니다. 계좌 잔고에 따라 포지션 크기를 산출하고 잠재 수익을 추정합니다. 시장에 중대한 변화가 발생할 경우 경고도 제공합니다. 지표의 주요 라인: 강세/약세 거래량 소진 라인 — 목표가로 사용됩니다. 시장 추세를 나타내는 라인. 시장이 강세인지 약세인지에 따라 색상이 변경되며 추세 지지선 역할을 합니다. 색상은 주로 시장 심리를 보여줍니다. 거래량 균형선(Eq). Eq(Volume Equilibrium) 라인은 시스템의 핵심입니
MACD divergency
Ivan Stefanov
4.5 (6)
이 지표는 지수이동평균(EMA) 기간을 5(빠름)와 34(느림), 신호선 기간을 5로 설정하여 가격 움직임과 MACD 히스토그램 간의 강세 및 약세 다이버전스를 정확하게 식별합니다. 지표는 모멘텀이 약화되는 지점을 강조 표시하여 잠재적 추세 반전을 알립니다. 올바른 다이버전스 식별 규칙: 강세 다이버전스는 가격이 더 낮은 저점을 형성하면서 MACD 히스토그램이 동시에 0선 위에서 더 높은 저점을 형성할 때 유효합니다. 약세 다이버전스는 가격이 더 높은 고점을 형성하면서 MACD 히스토그램이 동시에 0선 아래에서 더 낮은 고점을 형성할 때 유효합니다. 히스토그램의 극값과 가격의 극값이 0선의 같은 쪽에 있지 않으면 다이버전스 신호는 무효로 간주되며, 이는 잘못된 신호를 초래할 수 있습니다. 이 접근법은 MACD 다이버전스 분석을 적용하는 가장 정확하고 신뢰할 수 있는 방법을 제시합니다. 지표 특징: 확인된 강세 및 약세 다이버전스를 명확하게 표시합니다. 신뢰성을 높이기 위해 MACD
FREE
Transaction Speed MT5
Ivan Stefanov
5 (3)
이 지표는 시장에서 관심이 나타나는 영역 을 강조 표시한 후, 주문이 누적되는 영역 을 보여줍니다. 이는 **대규모 오더북(호가창)**처럼 작동합니다. 이것은 거대한 자금 을 위한 인디케이터입니다. 성능은 탁월하며, 시장에서 어떤 관심이 있든 반드시 포착할 수 있습니다 . (이것은 완전히 새로 작성되고 자동화된 버전 입니다 – 이제 수동 분석은 필요하지 않습니다.) **거래 속도(Transaction Speed)**는 새로운 개념의 인디케이터로, 시장에 대규모 주문이 언제, 어디에 쌓이는지를 보여주며 , 그 이점을 분석합니다. 매우 초기 단계에서 트렌드 전환 을 감지할 수 있습니다. FX 시장에서 흔히 사용하는 "거래량(volume)"은 오해입니다. 실제로는 시간당 가격 변화량 이므로, 올바른 용어는 거래 속도 입니다. 우리가 어떻게 사고하고, 행동하며, 분석하느냐 가 가장 중요합니다. 분석 패러다임의 전환 은 필수적입니다. 이 인디케이터는 외환 시장에서의 볼륨 개념을 논리적으로
이 인디케이터는 MetaTrader 4 및 5용 인터랙티브 엘리엇 파동 라벨링 도구입니다. 차트에 표시된 메뉴에서 라벨 크기, 색상, 파동 유형(ABC 조정파, 5파동 임펄스 또는 WXY 구조)을 선택하여 차트에 직접 파동 라벨을 수동으로 배치할 수 있습니다. 차트를 한 번 클릭하면 선택한 가격과 시간 위치에 맞는 파동 라벨이 순차적으로 배치되어, 트레이더가 엘리엇 파동 구조를 시각적으로 표시하고 정리하는 데 도움을 줍니다. 마음에 드신다면 평가해 주세요! 이 인디케이터는 MetaTrader 4 및 5용 인터랙티브 엘리엇 파동 라벨링 도구입니다. 차트에 표시된 메뉴에서 라벨 크기, 색상, 파동 유형(ABC 조정파, 5파동 임펄스 또는 WXY 구조)을 선택하여 차트에 직접 파동 라벨을 수동으로 배치할 수 있습니다. 차트를 한 번 클릭하면 선택한 가격과 시간 위치에 맞는 파동 라벨이 순차적으로 배치되어, 트레이더가 엘리엇 파동 구조를 시각적으로 표시하고 정리하는 데 도움을 줍니다. 마음
FREE
Horizont
Ivan Stefanov
Horizont는 진입 지점, 목표 1, 목표 2, 손절가를 포함한 완전한 트레이딩 세트업을 제공하는 트레이딩 시스템입니다. 모든 값은 자동으로 계산됩니다. 시스템은 시장의 고점과 저점을 자동으로 감지하고 이를 연결하여 현재 추세를 정의합니다. 사용자는 거래할 추세를 선택하며, Horizont는 이에 따른 진입, 목표 및 손절 수준을 생성합니다. 시스템에는 자동 리스크 관리 기능이 포함되어 있습니다. 계좌 잔액을 확인하고 리스크를 계산한 뒤, 적절한 포지션 크기를 제안합니다. 리스크 대비 보상 비율(R:R)은 첫 번째 목표에 대해서만 표시됩니다. 모든 계산은 즉시 수행됩니다. 다른 기회를 탐색하고 싶다면 통화 패널을 클릭하여 종목을 전환하고 더 나은 R:R 비율을 찾을 수 있습니다. 이 시스템은 주로 외환(Forex)에 초점을 맞추고 있지만, 금속, 지수, 암호화폐 거래도 지원합니다(현재 베타 단계로, 모든 브로커에서 지원되지 않을 수 있습니다). 시스템은 각 세트업에 대해 등급이
시장 변동성에 따라 계산 기간을 자동으로 조정하여 과매수 및 과매도 신호를 보다 정확하게 제공하는 고급 모멘텀 오실레이터입니다. 작동 방식 이 지표는 적응형 기간 계산을 사용하며, 변동성이 높을 때는 기간을 짧게 하고 변동성이 낮을 때는 기간을 길게 합니다. 이러한 동적 조정은 추세 시장에서는 더 빠른 신호를 제공하고, 횡보 시장에서는 거짓 신호를 줄여줍니다. RSI 값은 이 가변 기간을 기반으로 계산되므로 현재 시장 상황에 더욱 민감하게 반응합니다. 전통적인 30(과매도)과 70(과매수) 수준을 사용하지만, 적응형 특성으로 인해 이러한 수준에 도달할 때의 신뢰도가 더 높아집니다. 주요 특징: 시장 변동성에 따라 계산 기간 자동 조정 매수 / 매도 시점을 표시하는 차트 화살표 컬러 오실레이터: 50 이상은 녹색, 50 이하는 빨간색 추세 시장에서 더 빠른 반응 횡보 시장에서 거짓 신호 감소 리페인트 없음 지표 — 캔들 마감 후 값이 고정됨 모든 타임프레임과 모든 시장에서 작동
FREE
Meravith Auto는 Meravith 거래 시스템의 자동화 버전입니다. 이 지표는 색상이 변하는 추세선으로 구성되어 있습니다. 상승 추세일 때는 녹색, 하락 추세일 때는 빨간색입니다. 이것이 추세 지지선입니다. 상승 거래량과 하락 거래량이 같은 유동성 라인. 세 배 상승 편차 라인. 세 배 하락 편차 라인. 높은 거래량을 나타내는 보라색 및 파란색 점. 보라색 점은 평균 거래량보다 2편차 큰 거래량을 나타내며, 파란색 점은 2편차를 나타냅니다. 사용 방법은? 상승 추세선과 추세선 위의 유동성은 상승 추세를 나타냅니다. 시장이 상승할 것으로 예상됩니다. 롱 포지션을 엽니다. 하락 추세선과 추세선 아래의 유동성은 하락 추세를 나타냅니다. 시장이 하락할 것으로 예상됩니다. 숏 포지션을 엽니다. 다른 지표와 자유롭게 조합하여 사용할 수 있습니다. 모든 통화쌍과 모든 시간대에서 사용할 수 있습니다. 브로커마다 표시하는 거래량이 다르기 때문에 결과가 다를 수 있습니다. 거래량이 많은 대
Imbalance Pro
Ivan Stefanov
5 (4)
이 인디케이터는 선택한 기간 동안 상승과 하락 사이의 불균형을 측정하고 두 지점 사이의 직선을 표시합니다. 상승세가 하락세보다 거래량이 많으면 선이 녹색으로 바뀝니다.  하락세가 더 많으면 빨간색으로 표시됩니다. 이 선은 거래량의 백분율 차이도 표시합니다. 표시기는 별도의 창에 동일한 데이터를 표시합니다. 분할된 볼륨도 볼 수 있습니다. 표시기에는 두 가지 모드가 있습니다. 이를 위해 왼쪽 상단에 버튼이 있습니다,  - 누르지 않으면 시장의 임의의 지점과 현재 가격 사이의 불균형을 측정합니다.  - 버튼을 누르면 선택한 시장의 두 지점 사이의 잔액을 측정할 수 있습니다. 이 인디케이터는 선택한 기간 동안 상승과 하락 사이의 불균형을 측정하고 두 지점 사이의 직선을 표시합니다. 상승세가 하락세보다 거래량이 많으면 선이 녹색으로 바뀝니다.  하락세가 더 많으면 빨간색으로 표시됩니다. 이 선은 거래량의 백분율 차이도 표시합니다. 표시기는 별도의 창에 동일한 데이터를 표
이 인디케이터는 MetaTrader 4 및 5용 인터랙티브 엘리엇 파동 라벨링 도구입니다. 차트에 표시된 메뉴에서 라벨 크기, 색상, 파동 유형(ABC 조정파, 5파동 임펄스 또는 WXY 구조)을 선택하여 차트에 직접 파동 라벨을 수동으로 배치할 수 있습니다. 차트를 한 번 클릭하면 선택한 가격과 시간 위치에 맞는 파동 라벨이 순차적으로 배치되어, 트레이더가 엘리엇 파동 구조를 시각적으로 표시하고 정리하는 데 도움을 줍니다. 마음에 드신다면 평가해 주세요! 이 인디케이터는 MetaTrader 4 및 5용 인터랙티브 엘리엇 파동 라벨링 도구입니다. 차트에 표시된 메뉴에서 라벨 크기, 색상, 파동 유형(ABC 조정파, 5파동 임펄스 또는 WXY 구조)을 선택하여 차트에 직접 파동 라벨을 수동으로 배치할 수 있습니다. 차트를 한 번 클릭하면 선택한 가격과 시간 위치에 맞는 파동 라벨이 순차적으로 배치되어, 트레이더가 엘리엇 파동 구조를 시각적으로 표시하고 정리하는 데 도움을 줍니다. 마음
FREE
Meravith MT5
Ivan Stefanov
마켓 메이커를 위한 도구. Meravith는 다음과 같은 기능을 제공합니다: 모든 타임프레임을 분석하고 현재 유효한 추세를 표시합니다. 강세와 약세 거래량이 동일한 유동성 구간(거래량 균형 구간)을 강조 표시합니다. 서로 다른 타임프레임의 모든 유동성 레벨을 차트에 직접 표시합니다. 텍스트 기반 시장 분석을 생성하여 참고용으로 제공합니다. 현재 추세를 기반으로 목표가, 지지선 및 손절가를 계산합니다. 거래의 위험 대비 보상 비율(Risk/Reward)을 계산합니다. 계좌 잔고에 따라 포지션 크기를 산출하고 잠재 수익을 추정합니다. 시장에 중대한 변화가 발생할 경우 경고도 제공합니다. 지표의 주요 라인: 강세/약세 거래량 소진 라인 — 목표가로 사용됩니다. 시장 추세를 나타내는 라인. 시장이 강세인지 약세인지에 따라 색상이 변경되며 추세 지지선 역할을 합니다. 색상은 주로 시장 심리를 보여줍니다. 거래량 균형선(Eq). Eq(Volume Equilibrium) 라인은 시스템의 핵심입니
Fifty Pro MT5
Ivan Stefanov
가격만을 기준으로 레벨을 계산하는 몇 안 되는 인디케이터 중 하나입니다. 이 인디케이터는 시간 프레임, 추세 또는 시장 사이클의 영향을 받지 않습니다. 지금까지 만들어진 것 중 가장 논리적인 인디케이터 중 하나입니다. FIFTY 인디케이터는 이제 자동화 버전으로 제공되어 수동으로 레벨을 그릴 필요가 없습니다. 이 버전은 일간, 주간, 월간, 연간 레벨을 자동으로 차트에 표시하여 정확성을 높이고 시간을 절약해 줍니다. 또한, 이러한 레벨의 표시 여부를 전환할 수 있는 버튼이 제공되어 완전한 사용자 맞춤 설정이 가능합니다. 수동 방식을 선호하는 분들을 위해 무료 버전도 여전히 제공되며, 완전히 작동합니다. 사용자들은 자신의 트레이딩 스타일에 따라 수동 또는 자동 도구를 선택할 수 있습니다. 매우 신뢰할 수 있으며 강력히 추천드립니다! 수동 버전의 FIFTY 인디케이터를 지금 요청해 보세요!
Naturu
Ivan Stefanov
5 (1)
“Naturu”는 자연의 대칭성을 알고리즘으로 활용하는 수동 인디케이터입니다. 간단한 전략과 숨겨진 지혜로 시장을 제패하세요! 인디케이터를 로드하면 위(Top)와 아래(Bottom) 두 개의 라인이 표시됩니다. 라인을 한 번 클릭해 활성화한 후, 이동하고 싶은 캔들 위를 클릭하면 그 위치로 이동합니다. 사용자가 고점과 저점을 지정하면, 인디케이터가 자동으로 계산합니다: 마젠타 색 영역: 상승(불) 세력과 하락(곰) 세력의 관심이 가장 가까워져서 지지/저항이 될 가능성이 큰 구간 회색 영역: 다음 관심 구간 아쿠아 색 실선: 상승 세력의 목표가 골드 색 실선: 하락 세력의 목표가 수동 인디케이터는 실시간 시장 상황과 개인의 직관에 따라 레벨을 자유롭게 조정할 수 있는 완전한 제어력과 유연성을 제공합니다. 직접 가격 움직임을 분석함으로써 지지·저항과 패턴 형성을 본질적으로 이해할 수 있습니다. 인간의 판단을 통해 자동 시스템이 놓치거나 오해하기 쉬운 ‘노이즈’를 걸러내어 잘못된 신호를
Two Snakes
Ivan Stefanov
5 (1)
2 SNAKES  is a first class scalping system. As the entries are quite precise, you are likely to become addicted to this system very quickly.  You have 2 snakes. When you see a candle above or below them that does not touch them - that is your scalping signal. Then buy or sell at the green line or close. If you use a larger time frame, scalping can become trend following. The snakes are calculated precisely in relation to the current state of the market. They ARE NOT moving averages.  You decide
Separated Volume
Ivan Stefanov
5 (1)
이 지표는 외환 시장의 틱 거래량을 강세와 약세 카테고리로 효과적으로 구분합니다. 또한 선택한 기간 동안 강세 및 약세 틱 거래량의 합계를 계산하여 표시하는 기능도 제공합니다. 차트에서 파란색 선 두 개를 움직여 기간을 쉽게 조정할 수 있으므로 거래 요구에 맞는 맞춤형 거래량 분석을 할 수 있습니다. 유용하게 사용하셨다면 리뷰를 남겨주시면 감사하겠습니다! 행복한 거래 되세요! 이 지표는 외환 시장의 틱 거래량을 강세와 약세 카테고리로 효과적으로 구분합니다. 또한 선택한 기간 동안 강세 및 약세 틱 거래량의 합계를 계산하여 표시하는 기능도 제공합니다. 차트에서 파란색 선 두 개를 움직여 기간을 쉽게 조정할 수 있으므로 거래 요구에 맞는 맞춤형 거래량 분석을 할 수 있습니다. 유용하게 사용하셨다면 리뷰를 남겨주시면 감사하겠습니다! 행복한 거래 되세요!
FREE
Enigmera
Ivan Stefanov
5 (8)
ENIGMERA: 시장의 핵심 중요: MQL5.com의 데모는 Strategy Tester에서 실행되며 Enigmera의 기능을 완전히 반영하지 못할 수 있습니다. 설명, 스크린샷 및 비디오를 확인하여 자세한 내용을 확인하십시오. 질문이 있으면 언제든지 메시지를 보내주세요! 인디케이터의 코드는 완전히 다시 작성되었습니다. 버전 3.0은 새로운 기능을 추가하고 인디케이터가 처음 출시된 이후 누적된 버그를 수정했습니다. 소개 이 인디케이터 및 거래 시스템은 금융 시장에 대한 주목할 만한 접근 방식입니다. ENIGMERA는 프랙탈 주기를 사용하여 정확하게 지원 및 저항 수준을 계산합니다. 실제 축적 단계를 보여주고 방향과 목표를 제공합니다. 트렌드와 수정 모두에서 작동하는 시스템입니다. 작동 방식 인디케이터의 대부분의 기능은 차트 왼쪽에 있는 버튼을 통해 제어되며, 이를 통해 다양한 시장 상황에 빠르게 대응할 수 있습니다. 버튼 ON/OFF – 인디케이터 전체를 표시하거나 숨깁니다.
Levelss
Ivan Stefanov
5 (1)
레벨스 지표가 표시됩니다: - 일일 강세 및 약세 영역. 매일 00:00~23:59에 표시됩니다.  - 주간 강세 및 약세 영역. 매주 월요일 0:00부터 금요일 23:59까지 표시됩니다. - 특정 시간대에서 특별히 계산된 채널로 다른 모든 시간대에 표시됩니다. 기본적으로 4시간 주기로 표시되며 거래하고자 하는 다른 주기로 변경할 수 있습니다. 논스톱으로 계산됩니다. 화면 왼쪽 상단에는 강세, 약세 또는 중립 영역과 채널이 표시됩니다. 세 가지가 모두 강세인 경우 현재 캔들에 녹색 점이 나타납니다. 세 개가 모두 약세인 경우 분홍색 점이 나타납니다. 인디케이터에는 제한이 없습니다. 레벨스 지표가 표시됩니다: - 일일 강세 및 약세 영역. 매일 00:00~23:59에 표시됩니다.  - 주간 강세 및 약세 영역. 매주 월요일 0:00부터 금요일 23:59까지 표시됩니다. - 특정 시간대에서 특별히 계산된 채널로 다른 모든 시간대에 표시됩니다. 기본적으로 4시간 주기로 표시되며
GANN Master
Ivan Stefanov
5 (1)
GANN의 정확한 목표는 그의 오랜 방법론에 따라 계산되어 눈앞에 제시됩니다. 이 도구는 거래를 더욱 쉽고 직관적으로 만들어줍니다. 흰 선을 위로 또는 녹색 선을 아래로 움직이면 GANN의 기법이 여전히 거래 세계에서 영향력 있는 이유를 즉시 알 수 있습니다. GANN의 전략은 시장 움직임을 높은 정확도로 예측하는 데 중점을 두며, 이 도구는 그 힘을 여러분의 손끝에 전달합니다. 숙련된 트레이더든 초보자든, 선을 조작하면 그의 접근 방식이 왜 오랜 세월 동안 신뢰받았는지 깊이 이해할 수 있게 될 것입니다. GANN의 정확한 목표는 그의 오랜 방법론에 따라 계산되어 눈앞에 제시됩니다. 이 도구는 거래를 더욱 쉽고 직관적으로 만들어줍니다. 흰 선을 위로 또는 녹색 선을 아래로 움직이면 GANN의 기법이 여전히 거래 세계에서 영향력 있는 이유를 즉시 알 수 있습니다. GANN의 전략은 시장 움직임을 높은 정확도로 예측하는 데 중점을 두며, 이 도구는 그 힘을 여러분의 손끝에 전달합니다.
Sense
Ivan Stefanov
5 (2)
SENSE는 선택된 GANN 방식과 프랙탈 계산을 결합한 자동화된 시스템입니다. 이 시스템은 거래를 개시하고 청산할 위치를 알려줍니다. 더 이상 복잡한 계산에 시간을 낭비할 필요가 없습니다. SENSE가 모든 것을 알아서 해줍니다. 인디케이터를 설치하기만 하면 됩니다. 기본 원칙: 가격이 흰색 선 위에 있으면 시장은 강세입니다. 흰색 선 위에서 매수, 아래에서 손절 녹색 선은 상승 목표 가격이 흰색 선 아래에 있으면 시장은 약세입니다. 흰색 선 아래에서 매도, 그 위에 스톱 빨간색 선은 하락 목표 녹색 또는 빨간색 이중선은 강세 구간을 나타냅니다. 왜 센스인가? 수익 목표: SENSE는 자동으로 이익 실현 목표를 설정하여 트레이딩 성공을 극대화할 수 있도록 도와줍니다. 자동 적응: 인디케이터는 모든 차트주기에 대해 자동으로 다시 계산하여 수동으로 조정할 필요 없이 정확하고 신뢰할 수 있는 신호를 제공합니다. 스캘핑에도 좋습니다. 데모를 확인해 보세요!
Stefanov
Ivan Stefanov
The indicator displays support and resistance zones defined logically using the MACD. The entire concept is explained in the video, with specific examples shown. The indicator works on any instruments and timeframes. It does not repaint. After placing it on the chart, please go through all the timeframes sequentially, from monthly to 1-minute, so that all lines load correctly. After that, you can start using it. The concept is unique and has not been seen in other systems or indicators.
Fifty Pro
Ivan Stefanov
5 (1)
FIFTY 인디케이터는 이제 자동화된 버전으로 제공되어 수동으로 레벨을 그릴 필요가 없습니다. 이 버전은 일간, 주간, 월간 및 연간 레벨을 자동으로 차트에 표시하여 정확성을 보장하고 시간을 절약합니다. 또한, 이러한 레벨의 표시 여부를 전환할 수 있는 버튼이 제공되어 완전한 사용자 맞춤 설정이 가능합니다. 수동 조작을 선호하는 사용자들을 위해 무료 버전도 계속 제공되며, 완전한 기능을 갖추고 있습니다. 트레이더는 자신의 거래 스타일에 맞춰 수동 또는 자동 도구를 선택할 수 있습니다. 가장 논리적인 인디케이터 중 하나. 높은 신뢰성. FIFTY 인디케이터는 이제 자동화된 버전으로 제공되어 수동으로 레벨을 그릴 필요가 없습니다. 이 버전은 일간, 주간, 월간 및 연간 레벨을 자동으로 차트에 표시하여 정확성을 보장하고 시간을 절약합니다. 또한, 이러한 레벨의 표시 여부를 전환할 수 있는 버튼이 제공되어 완전한 사용자 맞춤 설정이 가능합니다. 수동 조작을 선호하는 사용자들을 위해 무료 버
Naturu MT4
Ivan Stefanov
“Naturu”는 자연의 대칭성을 알고리즘으로 활용하는 수동 인디케이터입니다. 간단한 전략과 숨겨진 지혜로 시장을 제패하세요! 인디케이터를 로드하면 위(Top)와 아래(Bottom) 두 개의 라인이 표시됩니다. 라인을 한 번 클릭해 활성화한 후, 이동하고 싶은 캔들 위를 클릭하면 그 위치로 이동합니다. 사용자가 고점과 저점을 지정하면, 인디케이터가 자동으로 계산합니다: 마젠타 색 영역: 상승(불) 세력과 하락(곰) 세력의 관심이 가장 가까워져서 지지/저항이 될 가능성이 큰 구간 회색 영역: 다음 관심 구간 아쿠아 색 실선: 상승 세력의 목표가 골드 색 실선: 하락 세력의 목표가 수동 인디케이터는 실시간 시장 상황과 개인의 직관에 따라 레벨을 자유롭게 조정할 수 있는 완전한 제어력과 유연성을 제공합니다. 직접 가격 움직임을 분석함으로써 지지·저항과 패턴 형성을 본질적으로 이해할 수 있습니다. 인간의 판단을 통해 자동 시스템이 놓치거나 오해하기 쉬운 ‘노이즈’를 걸러내어 잘못된 신호를
MACD Divergence Pulse — 4색 히스토그램, 알림 및 대시보드와 함께하는 스마트 다이버전스 스캐너 짧은 설명 자동 일반 및 숨겨진 다이버전스 감지, 4색 동적 히스토그램, 매수/매도 화살표, 신호 라벨, 실시간 대시보드, 다채널 알림을 갖춘 전문 MACD 지표. 모든 심볼 및 시간대에서 작동. 전체 설명 MACD Divergence Pulse는 클래식 MACD 오실레이터를 다음 레벨로 끌어올립니다. 일반 및 숨겨진 다이버전스를 자동으로 감지하고 표시하며, 가격 차트와 MACD 하위 창에 선을 그리며, 화살표를 배치하고, 신호 라벨을 표시하며, 라이브 대시보드를 제공합니다 — 모두 하나의 가벼운 지표에서. 트레이더가 MACD Divergence Pulse
RSI Divergence Pulse — Smart Divergence Scanner with MTF Panel, Zone Fill, Alerts & Dashboard SHORT DESCRIPTION Professional RSI indicator with automatic Regular & Hidden divergence detection, color-coded RSI line, Multi-Timeframe panel, OB/OS zone fills, Buy/Sell arrows, signal labels, real-time dashboard, and multi-channel alerts. Works on any symbol and timeframe. FULL DESCRIPTION
전설적인 윌리엄 갠(William Gann) 수준을 완전 자동화하여 표시하는 MT5 인디케이터. GANN Master는 일간, 주간, 월간 데이터를 바탕으로 가격이 전환하거나 추세를 이어갈 가능성이 높은 핵심 구역을 정확히 포착합니다. 주요 기능 원클릭 기간 선택 버튼 : Daily, Weekly, Monthly 버튼 클릭 한 번으로 해당 일, 주, 월의 구역을 즉시 표시 자동 및 수동 모드 자동 모드: GANN Master가 모든 레벨을 자동으로 계산, 수동 입력 불필요 수동 모드: 차트에서 Top 및 Bottom 라인을 드래그하여 스윙 포인트를 설정하면, 모든 Gann 레벨이 즉시 재계산 매수 및 매도 레벨 : 강세(매수)·약세(매도) 레벨을 모두 표시, 레벨이 모일수록 강력한 지지/저항 구역 표시 다양한 자산 지원 : Forex, 귀금속(Gold 등), 지수, 암호화폐 등 고가 자산 모두 지원 — 설정에서 자산 클래스를 변경하면 자동으로 스케일 및 승수 조정 직관적 인터페이스
Speculator MT5
Ivan Stefanov
SPEKULATOR는 주요 지원 영역과 시장 방향을 식별하는 데 도움이 되는 수동 거래 시스템 및 지표입니다. 간단한 전략과 숨겨진 지혜로 시장을 마스터하세요. 차트에서 원하는 최고점(TOP)과 최저점(BOTTOM)을 선택하면 지표는 다음을 그립니다: 당신의 트렌드를 위한 지원 영역. 상승 추세에서는 녹색 영역이, 하락 추세에서는 빨간색 영역이 나타납니다. 지원 영역의 민감도는 지표 설정에서 조정할 수 있습니다. 이 영역은 선택한 추세를 기반으로 지원이 나타날 가능성이 있는 위치를 나타냅니다. 높은 편차선과 낮은 편차선 W.D. Gann의 9의 제곱에 따라 계산된 각도선 거래에 진입할 때: 높은 편차선이 위로 돌파되면 롱 포지션을 취합니다. 낮은 편차선이 아래로 돌파되면 숏 포지션을 취합니다. 시장이 편차선 사이에 있을 경우, 해당 구간 내에서 매수와 매도를 하며 지원 영역을 존중합니다. Gann의 각도선은 이익 실현 구간으로 가이드를 제공합니다. 핵심 수준은 360도 선입니다: 가
MACD Divergence Pulse — 4색 히스토그램, 알림 및 대시보드와 함께하는 스마트 다이버전스 스캐너 짧은 설명  자동 일반 및 숨겨진 다이버전스 감지, 4색 동적 히스토그램, 매수/매도 화살표, 신호 라벨, 실시간 대시보드, 다채널 알림을 갖춘 전문 MACD 지표. 모든 심볼 및 시간대에서 작동. 전체 설명 MACD Divergence Pulse는 클래식 MACD 오실레이터를 다음 레벨로 끌어올립니다. 일반 및 숨겨진 다이버전스를 자동으로 감지하고 표시하며, 가격 차트와 MACD 하위 창에 선을 그리며, 화살표를 배치하고, 신호 라벨을 표시하며, 라이브 대시보드를 제공합니다 — 모두 하나의 가벼운 지표에서. 트레이더가 MACD Divergence Puls
필터:
Gabriel De Araujo Lobo
1329
Gabriel De Araujo Lobo 2025.06.18 15:48 
 

It's amazing how this works, excellent to add to strategies that use price action. Excellent attention given by the seller

Vasyl Daki
485
Vasyl Daki 2025.06.16 18:55 
 

I bought this indicator mostly because of the reviews because I couldn't test it with the demo version to the full extent. After the purchase, I started checking the system's operation on history. During the check, I found that the indicator gives weak results. My first observation concerns the fact that after the trend has changed and I notice it and of course I set the indicator to the top point of the beginning of the downward trend at the next price touch of the main support line and the formation of a pattern for concluding a deal to sell in 50% of cases the market turns around and goes against the pattern or makes a deep correction that confuses the indicator and it can create a false pattern that creates new losses, the same applies to patterns to buy. When working with this indicator, there is no sense of control over the market. That is, there is some interval where the indicator works very well, but then there comes an interval where the indicator shows bad results. I still couldn't understand what its advantage is and how you can make money with it. In my opinion, its price is 40 dollars. If the author thinks otherwise he can write a program for a profitable robot based on this indicator, I would be happy to test this robot.

Ivan Stefanov
6685
개발자의 답변 Ivan Stefanov 2025.06.18 12:38
Dear Mr. Daki, I deeply regret your dissatisfaction; however, the facts of our interactions clearly indicate a different situation. Immediately after your purchase, I proactively provided extensive support, offering multiple channels (email, Telegram) to clarify any questions. Despite several attempts to help you, you consistently refused to provide any concrete examples or screenshots of your claimed issues, making it impossible to assist you effectively. When I offered a full refund, you supplied inconsistent payment details with multiple conflicting identities—first a Bulgarian name, then an Arabic one, and later cryptocurrency addresses in romanian language—raising legitimate concerns about the authenticity of your claims. Enigmera is a proven system, highly rated and validated by numerous satisfied traders. Each customer requesting a trial receives full access to test thoroughly before buying. Your allegation that testing was impossible is false and contradicts clear evidence. Moreover, records show that you never downloaded a demo from the location of your purchase (Norway), which raises further doubts about your claims to have tested the system thoroughly. Given your pattern of threats and suspicious behavior, I have escalated this issue to mql5.com for further investigation. Transparency and integrity are fundamental to my practice. Any interested parties may request full documentation of our communication to verify the truthfulness of my statements. Regards, Ivan Stefanov Enigmera Support
Nath
161
Nath 2025.05.26 06:35 
 

This is the best indicator I have used to date. It is worth every dollar. Ivan promptly clarified all my 'humble' questions, supporting a very effective use of the indicator. He also provides a lot of supporting material. **Also available on Tradingview Ivan, thanks again, you genius!

리뷰 답변