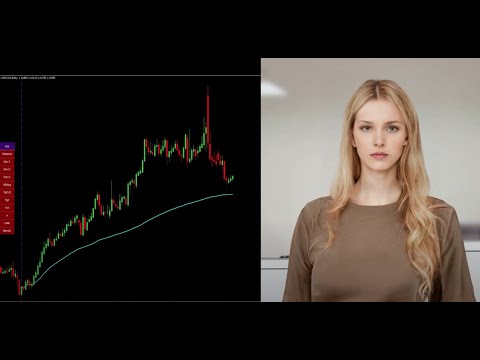
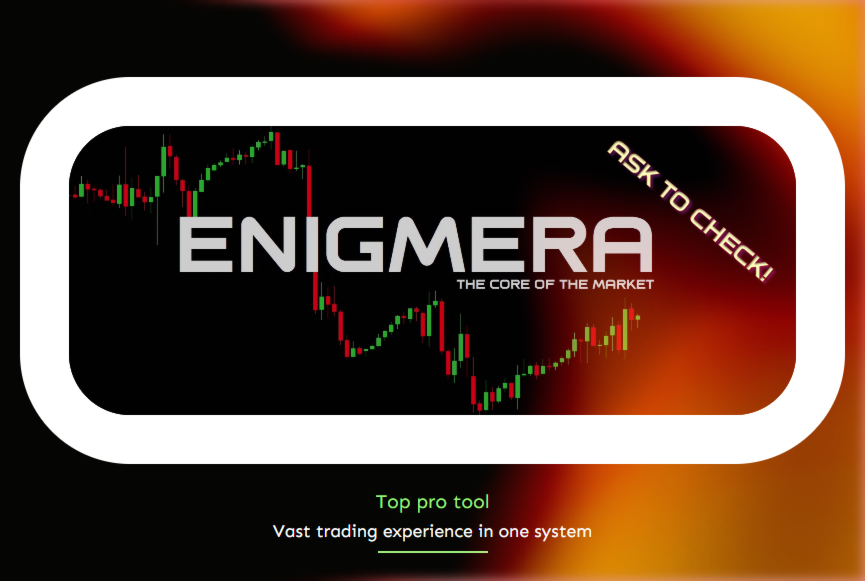
Enigmera MT5
- 指标
- 版本: 1.50
- 更新: 27 十二月 2025
- 激活: 20

ENIGMERA:市场的核心
(这是一个手动指标,包含的某些功能可能不被当前 MetaTrader 测试环境所支持)
简介
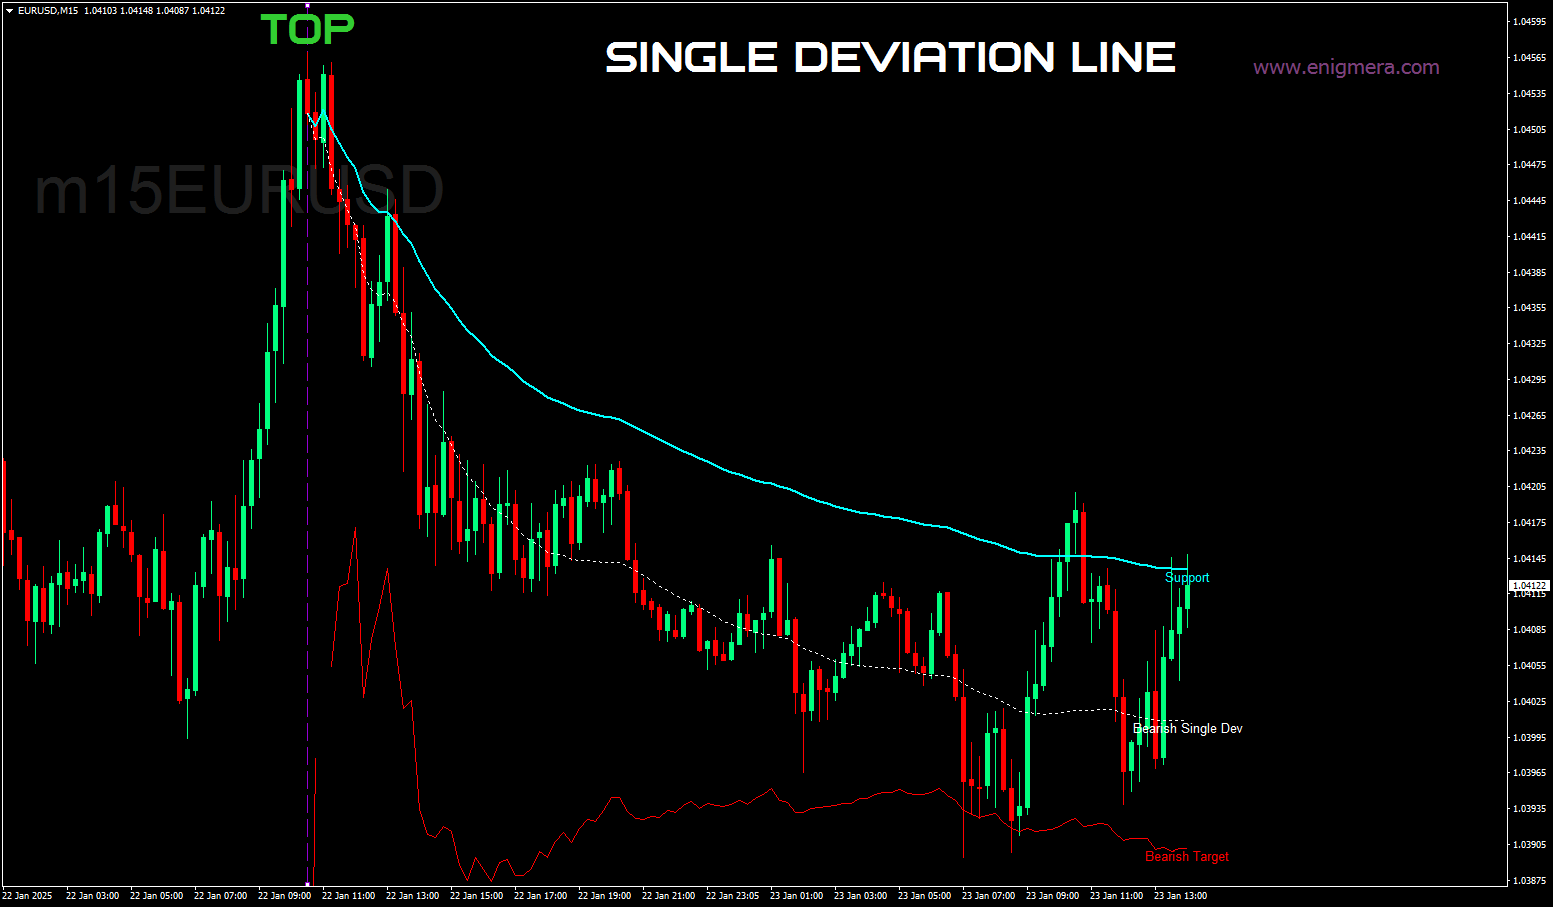
此指标和交易系统是一种对金融市场的独特方法。ENIGMERA 利用分形周期精确计算支撑和阻力水平。它揭示真实的积累阶段,并给出方向和目标。无论市场处于趋势还是调整阶段,该系统都能发挥作用。
工作原理
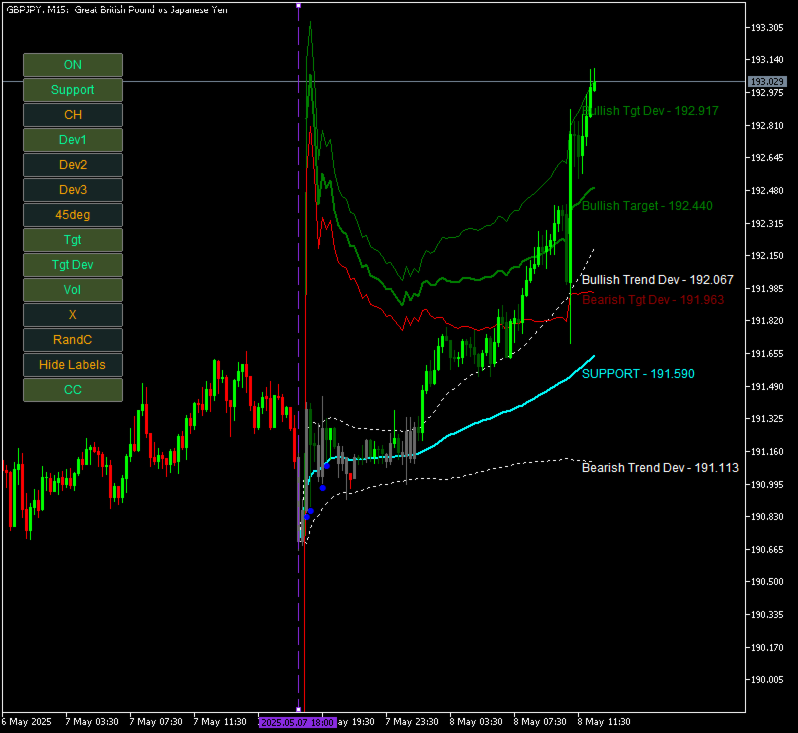
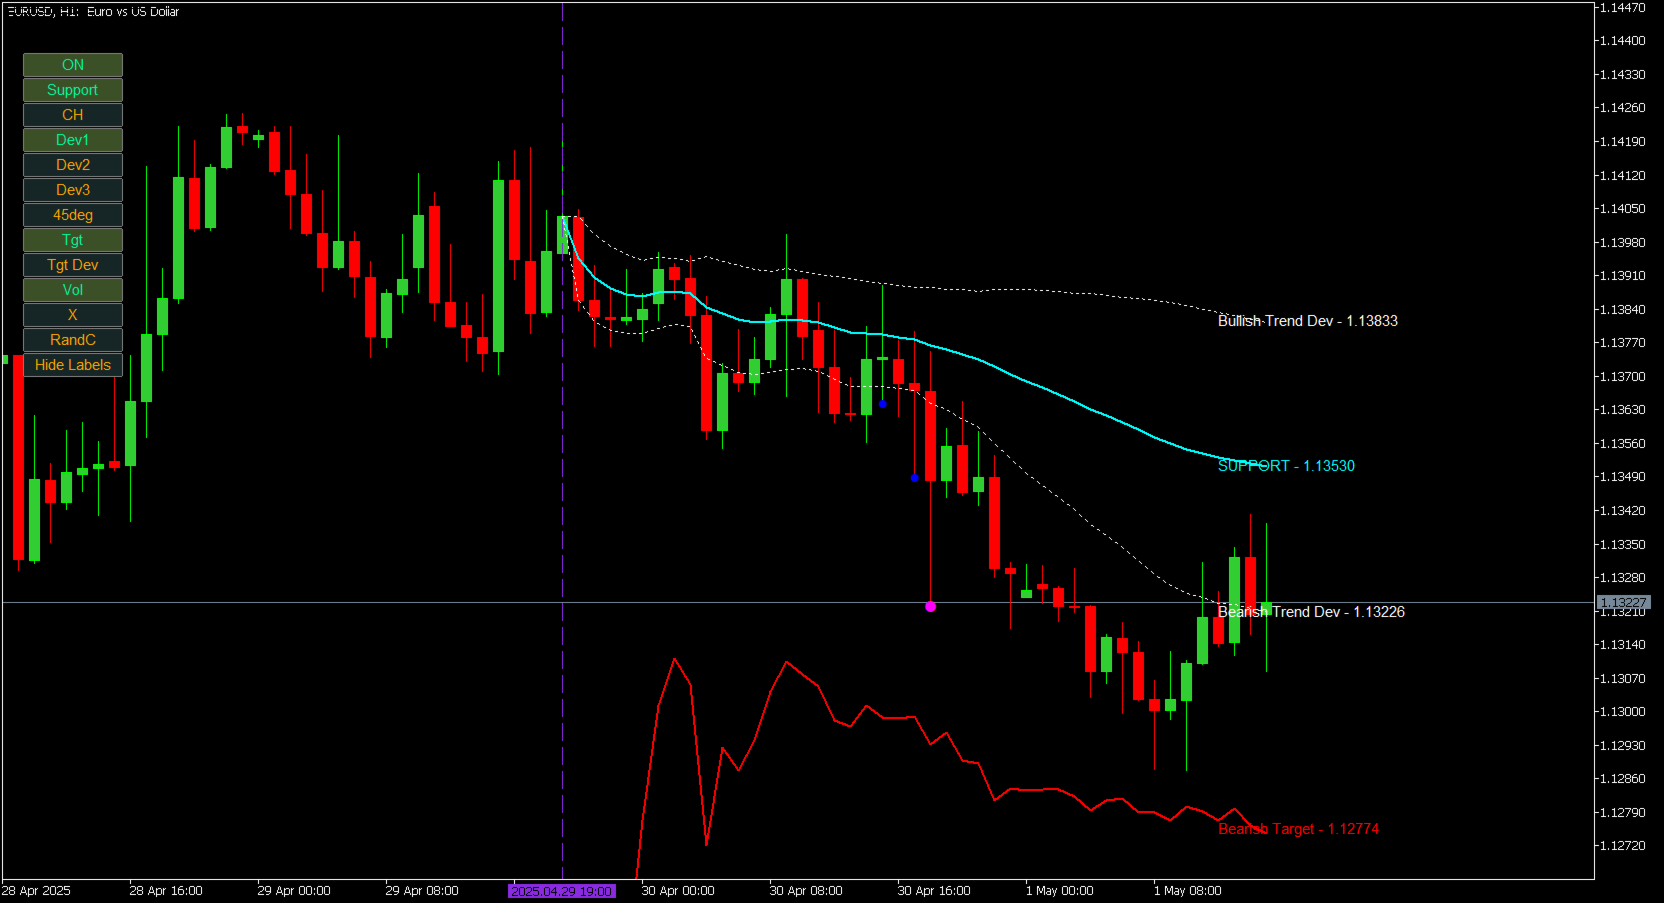
大多数功能通过图表左侧的按钮控制,使您能够快速应对不同的市场状况。
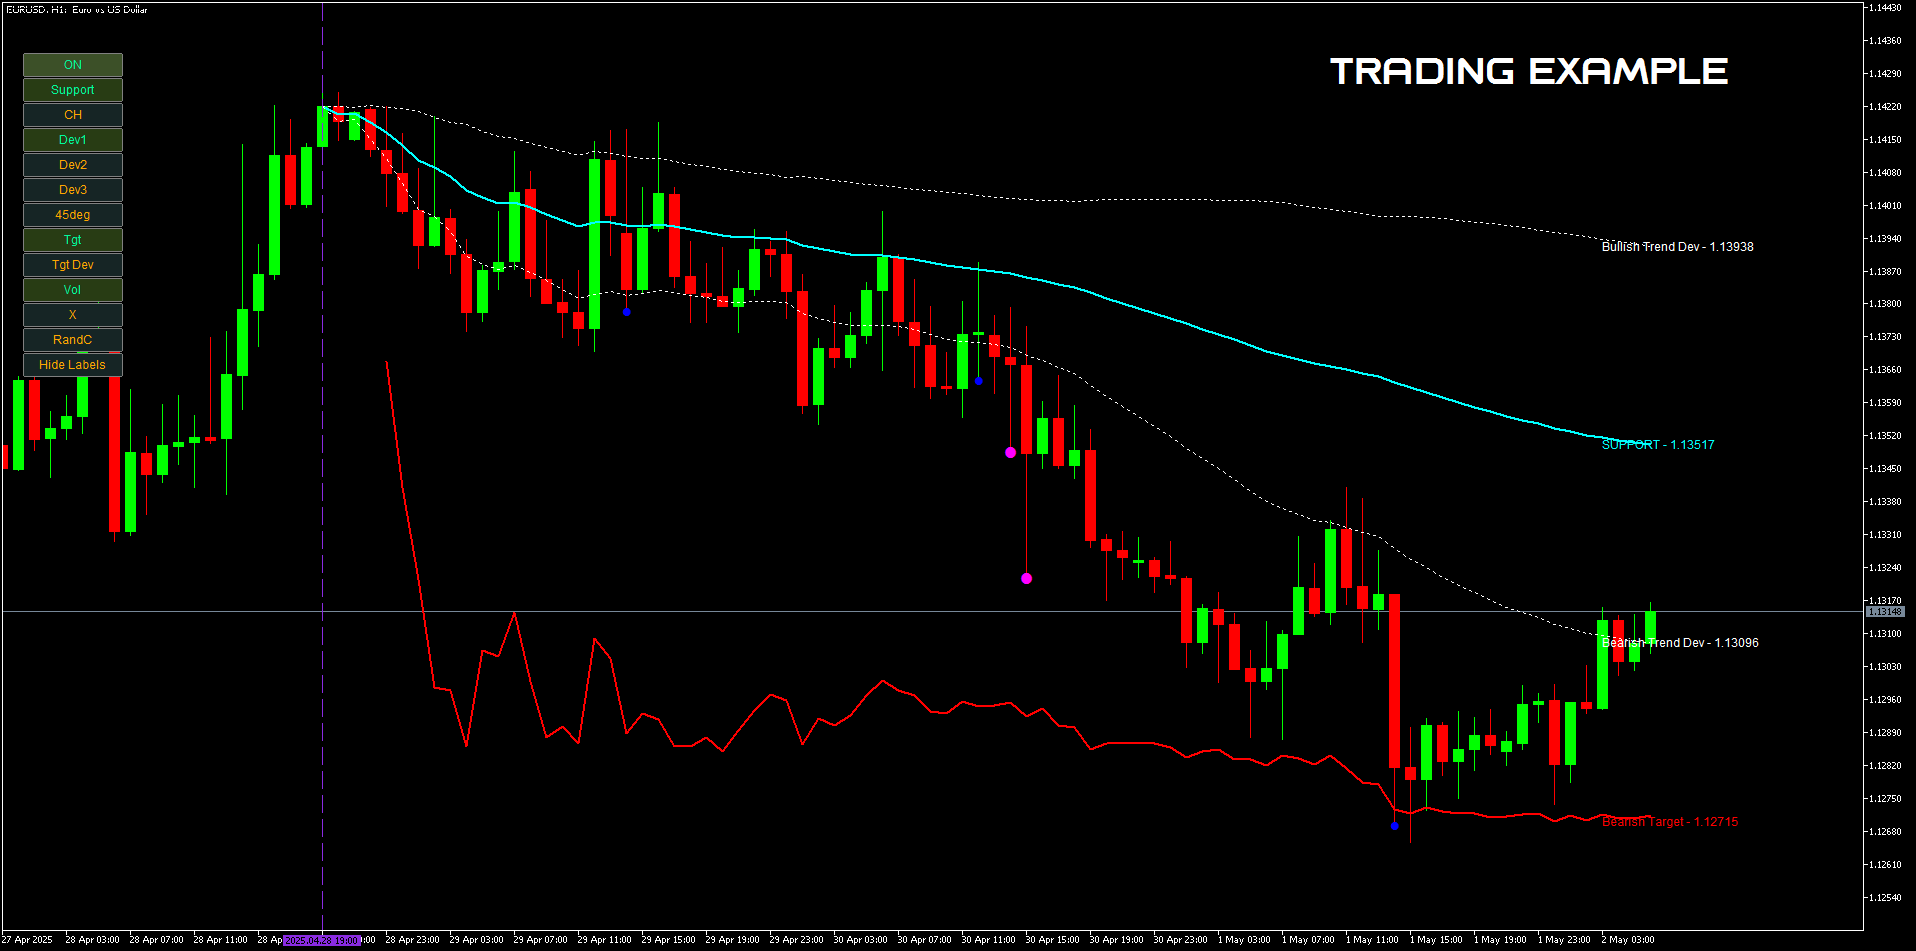
按钮说明
ON/OFF – 显示或隐藏整个指标。
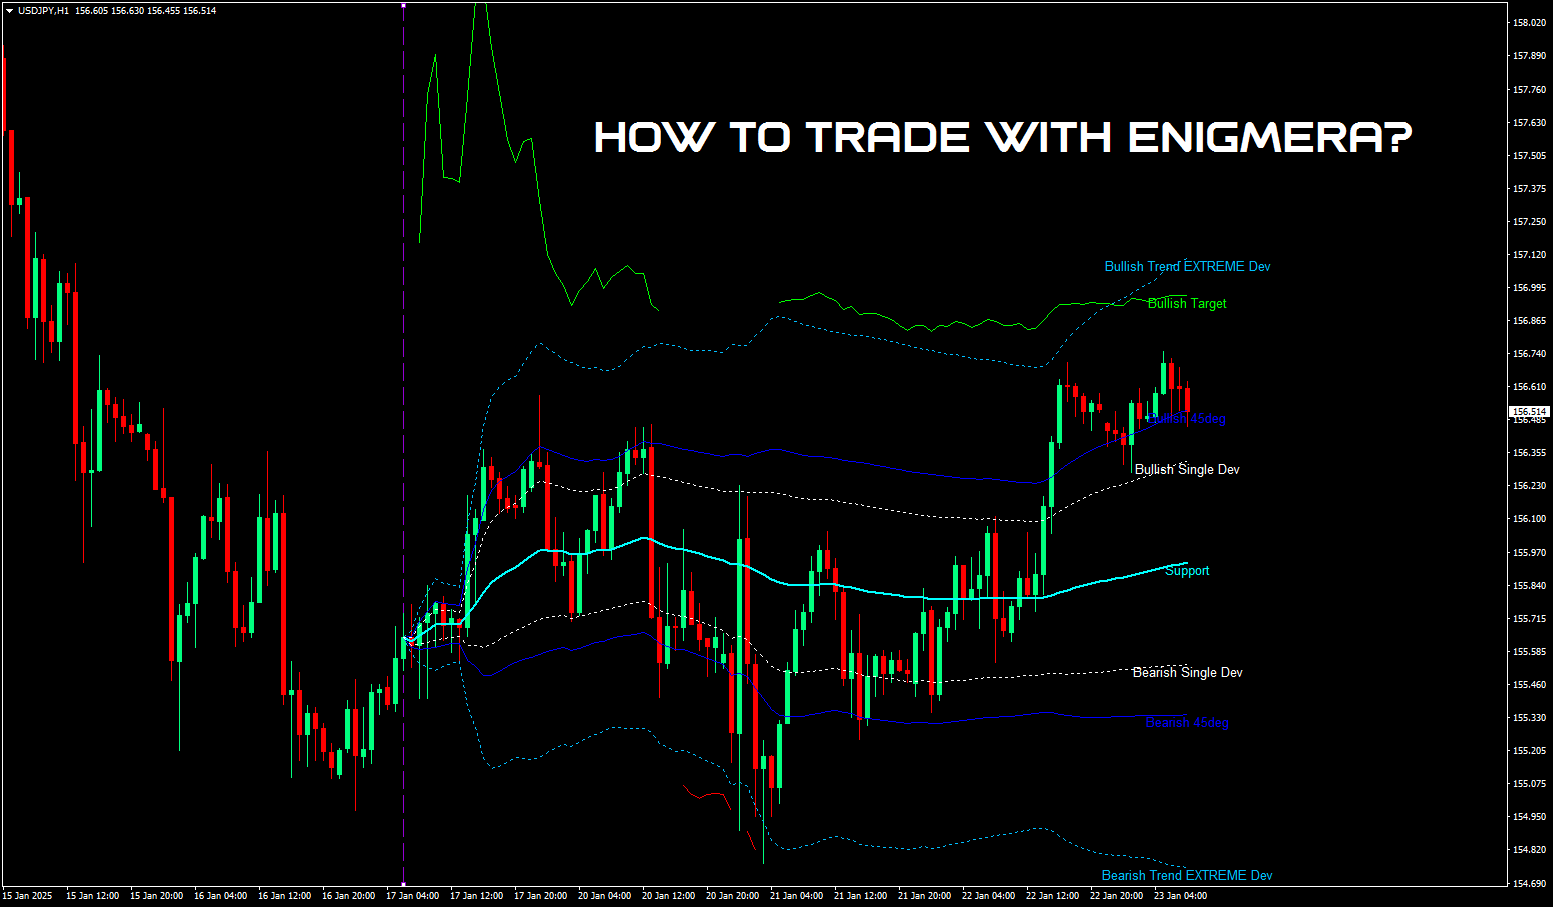
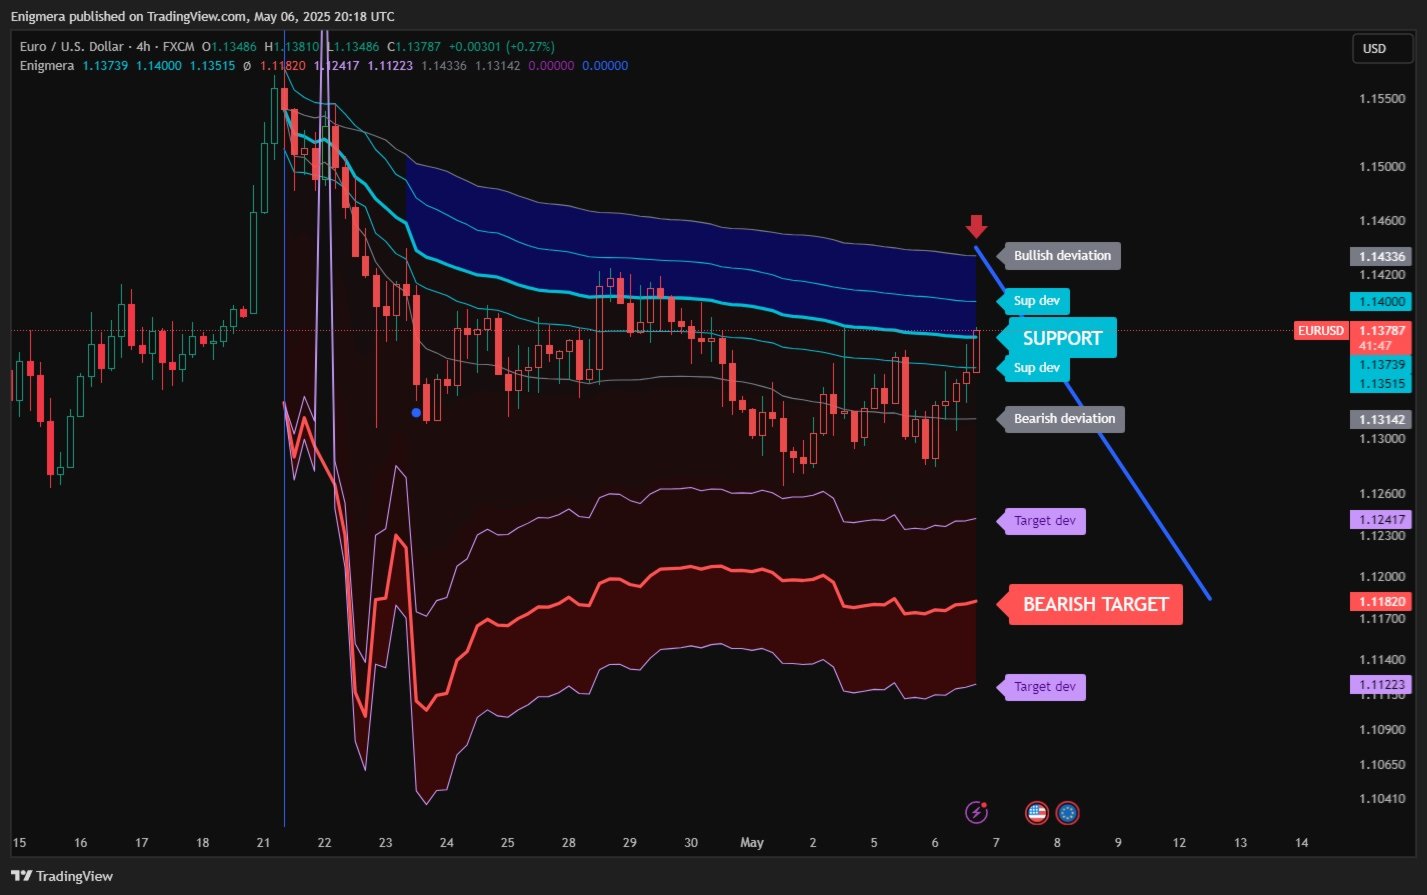
Support – 趋势的主要支撑线。
Ch – 激活支撑通道,显示允许的偏差范围。
Dev1(第一偏差)– 表示价格在支撑偏差内的波动,提示市场盘整或能量积累。
Dev2(第二偏差)– 表示价格在偏差之间的波动,提示趋势的形成与方向。
Dev3(第三偏差)– 表示趋势显著加速和高波动性。
45deg(45 度)– 显示相对于 45 度线的市场节奏与稳定性。
Tgt(目标)– 趋势目标线,指示可能的平仓区域。
Tgt Dev – 目标价格的可能波动通道。
Vol(成交量)– 在蜡烛图上显示成交量点,以标识显著的市场成交变化。
X – 当市场达到目标线时显示 “X”。
RandC(随机颜色)– 将指标的线条和标签随机着色,以便更好地可视化。
Hide/Show Labels – 显示或隐藏线条标签。
CC – 新增按钮,点击后,支撑线之上的蜡烛变为绿色,支撑线之下的变为红色,触及支撑线的为中性灰色,从而直观显示市场状态。
该系统展示市场的当下状态,而不是像传统指标那样仅将过去的数据外推到现在与未来。
当价格处于支撑时,那是真实的支撑;当价格处于阻力时,那是真实的阻力。支撑或阻力被突破则意味着趋势变化。
ENIGMERA 专为需要向客户提供可靠市场见解的金融分析师与顾问设计,同时适合追求精确与信心的投资者使用。
它以卓越的精度脱颖而出,使交易者能够清晰、自信地评估各种选择。
结合二十年的交易经验与知识,ENIGMERA 是一个综合性的强大工具。它既直观,又依赖使用者的正确设置以发挥最大效能。
建议:
货币对:所有货币对、所有市场
时间周期:所有周期
最低存款:无要求
账户类型:无限制
经纪商:无限制
此高级指标非常适合日内交易和剥头皮策略。利用 Enigmera 的先进算法优化您的自主交易,适用于外汇、股票、指数及加密货币市场。
为 MetaTrader 4、MetaTrader 5 和 TradingView 设计,Enigmera 简化了止损与风险管理。
您成功交易所需的一切工具尽在其中。Enigmera 可在任何市场与时间周期中运行,不会重绘。
购买前须知
此产品可直接在 MetaTrader 策略测试器中试用。
强烈建议您先在自己偏好的交易品种、周期与市场条件下测试其表现,再决定是否购买。
有问题或需要说明?
请通过 MQL5 向我发送私信。
我会为您提供清晰的指导与帮助,确保您完全了解产品功能。
开启交易智慧的新世界。您是否准备好将自己的金融决策提升至新高度?
购买后将提供完整支持、安装指导及额外资料。
Enigmera 适用于 MT4


It's amazing how this works, excellent to add to strategies that use price action. Excellent attention given by the seller