Watch the Market tutorial videos on YouTube
How to buy а trading robot or an indicator
Run your EA on
virtual hosting
virtual hosting
Test аn indicator/trading robot before buying
Want to earn in the Market?
How to present a product for a sell-through
Expert Advisors and Indicators for MetaTrader 5 - 41

Real Quants Forex Volatility Catcher for MT5 Introduction Real Quants Forex Volatility Catcher is a cutting-edge automated trading system designed specifically for MetaTrader 5. Developed through advanced machine learning and exhaustive data mining techniques, this system offers traders a robust strategy for navigating the complex terrains of the forex markets. With a commitment to rigorous testing that includes Monte Carlo simulations, walk-forward matrix optimization, and live execution valida
FREE

The Moving Average Ribbon is a technical indicator that overlays a series of moving averages (MAs) on a price chart to visualize trend direction, strength, and potential reversals or reentries. It supports both Exponential Moving Averages (EMA) and Simple Moving Averages (SMA), configurable via user input.
Key Features:
Ribbon Composition: Displays 18 moving averages with periods ranging from 5 to 90 in increments of 5 (e.g., MA5, MA10, ..., MA90), plus an internal MA100 for reference. The MA5
FREE

Description
Spread History is a simple yet essential indicator that displays the historical spread, candle by candle, in a separate window alongside its moving average. With a real‑time line and overlaid text on the main chart, you can easily monitor the spread applied by your broker at every market phase. Purpose Show the actual spread provided by the broker for each candle Calculate and display the spread’s moving average over a configurable period Overlay the current spread value and its av
FREE

The indicator displays important technical levels on the chart. These levels act as support or resistance for the price movement.
The most important levels are multiples of 100 and 50 pips . You can also display levels in multiples of 25 pips .
When the price reaches the level, an alert or push notification is displayed. MT4 version https://www.mql5.com/en/market/product/69486 Settings Show Levels 100 pips - show levels that are multiples of 100 pips Show Levels 50 pips - show levels t
FREE
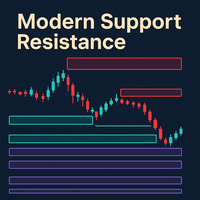
Dynamic S/R indicator that creates zones from fast/slow fractals, merges them if they overlap, classifies them (Possible, Untested, Verified, Turncoat, Weak), highlights the one closest to current price, and sends alerts when price enters the area. It supports testing mode, visual themes, zone extension/merge, global variables for EA integration, optional display of broken zones, and an adaptive ATR-based fuzz filter (with automatic fallback).
My indicators for free. I only ask that leave your
FREE

Institutional Session Sweep Strategy Just a proven strategy based on real market logic. SessionSweep is an automated trading system designed to capture reversals after liquidity sweeps at key market sessions. Based on observing how major players manipulate session extremes before significant directional moves.
Institutional Logic : Trades like market makers, exploiting liquidity sweeps at key sessions (Asia, London, New York). EMA 12 Confirmation : Precise entry only when price confirms revers

This Expert Advisor implements a trend-adaptive grid-hedging strategy designed to operate on instruments that exhibit directional movement (e.g., XAUUSD on H1), combining multi-layered risk protection with disciplined execution logic. Trend-based Entry Logic The system uses two exponential moving averages to detect market direction: EMA Fast > EMA Slow → BUY bias EMA Fast < EMA Slow → SELL bias The EA only opens trades in alignment with the detected trend direction. Structured Grid Trading
FREE

A pin bar pattern consists of one price bar, typically a candlestick price bar, which represents a sharp reversal and rejection of price. The pin bar reversal as it is sometimes called, is defined by a long tail, the tail is also referred to as a “shadow” or “wick”. The area between the open and close of the pin bar is called its “real body”, and pin bars generally have small real bodies in comparison to their long tails.
The tail of the pin bar shows the area of price that was rejected, and t
FREE

Majestic — Premium Trend-Swing EA for XAUUSD
Majestic is a directional swing-trading algorithm designed exclusively for trading GOLD , identifying high-probability trend moves based on a dynamic combination of Risk/Reward ratios, ADR-based volatility filters, and a custom scoring system to confirm trade setups. The EA features both fixed and adaptive stop levels based on real-time market volatility conditions and it can operate with or without stops, allowing for strategic exits either on oppo

Overview EMA Scalper is a technical indicator designed for the MetaTrader 5 platform. This tool helps traders identify potential trading signals based on the crossover between price and an Exponential Moving Average (EMA), combined with a dynamic price channel. The indicator is suitable for scalpers or day traders and works across various timeframes and financial instruments. How It Works The indicator's logic is based on two main components: EMA Crossover: The core signal is generated when the
FREE

A clean Bollinger Bands indicator with single-color filling designed to reduce chart clutter. What is This Indicator? This is a Bollinger Bands technical indicator designed with visual simplicity in mind. Unlike standard Bollinger Bands implementations that display multiple colored lines and bands, this indicator uses a single-color filled area to represent the trading bands. This approach minimizes visual clutter while maintaining full functionality for technical analysis. How It Works The ind
FREE

EMA Crossover Expert Advisor The EMA Crossover Expert Advisor (EA) is a fully automated trading system designed for MetaTrader 5.
It uses a fast/slow EMA crossover strategy combined with configurable risk management tools to identify potential trading opportunities. This EA is ideal for traders who prefer systematic execution without manual intervention, with built-in parameters to fine-tune performance according to different market conditions. Key Features: EMA Crossover Logic – Detects bulli

Shadow Bands Pro – MT5 说明(中英文) English Description (MT5) Shadow Bands Pro – Advanced Reversion System for MT5 This MT5 edition of Shadow Bands Pro takes full advantage of the MT5 platform, offering faster calculations, more timeframes, and better testing capabilities.
It remains a non-repainting (on close) trend-reversal / mean-reversion tool with dynamic channels, entity-break logic, and an integrated statistics panel. Key Features Optimized for MT5’s 64-bit, multi-threaded architecture Non-
FREE

The fact that round number levels have a significant influence on the market cannot be denied and should not be overlooked. These psychological levels are used by both retail Forex traders and major banks that deal in Forex. Very simple and effective indicator and most importantly free. ////////////////////////////////////////////////////////////////////////////////////////////////////////////////////////////////////////////////////////////// The program does not work in the strategy tester.
FREE

Use this expert advisor whose strategy is essentially based on Bollinger bands as well as a personal touch.
Other free expert advisors are available in my personal space as well as signals, do not hesitate to visit and leave a comment, it will make me happy and will make me want to offer content. Expert advisors currently available: LVL Creator LVL Creator Pro LVL RSI mt5
If you want to get a configuration file to improve your experience, leave a comment on this robot, then contact me by direc
FREE

RSI with moving average is great to see when the price is overbought and oversold instead of RSI only.
INPU T PARAME TERS : RSI:
Period - RSI period.
Price - RSI applied price.
Color scheme - RSI color scheme (4 available). MOVING AVERAGE:
Period - MA period.
Type - MA type.
Apply - MA applica tion.
Shift - MA shif t (correc tion). PRICE LINE:
Show - specify if line with price, only line or nothing.
Style - line style. OTHER:
Overbought level - specify the level .
Overbought descriptio
FREE

Golden Gap Zone Recovery EA (XAUUSD – M5 Timeframe) Broker (Recommended): https://one.exnesstrack.org/a/lmeqq9b7
Golden Gap Zone Recovery EA is a professional automated trading system developed for MetaTrader 5 , designed to trade Gold against the US Dollar (XAUUSD) exclusively on the 5-minute timeframe (M5) . The Expert Advisor is based on price gap detection and retest logic , combined with multi-timeframe trend confirmation and a step-based recovery (multiplier) system to manage adver

Drawing inspiration from ICT's Private Mentorship Course of 2016 (month 05) , as shared on YouTube, our innovative tool empowers traders to navigate the markets with precision. By marking out periods of 60, 40, and 20 days, it helps identify significant market movements, drawing upon the wisdom imparted by ICT. What truly sets this indicator apart is its forward casting capability, a feature that offers invaluable insights into future market behavior based on meticulous historical data analysis
FREE

This trading strategy uses HeikenAshi candles to smooth out market noise and 2 SMAs for more accurate market entry points. It is suitable for trading any currency pairs, commodities (e.g., gold and oil), and stocks. The strategy was tested on EURUSD with a 1-hour timeframe. Period 01.01.2024 - 27.07.2024 Recommended parameters: Lots = 1 StopLoss = 490 TakeProfit = 310 Moving averages parameters: FastMA = 66 SlowMA = 32 Before starting, make sure that the Heiken Ashi indicator, located in Indicat
FREE

The "YK-LOT-SIZE" is a custom indicator for MetaTrader 5 (MT5) that displays the total lot sizes and profits for both buy and sell positions on the current chart. Key features of the indicator: It calculates the total lot sizes for all open buy and sell positions of the current symbol. It calculates the total profits (including commissions and swaps) for all open buy and sell positions. The indicator displays the information on the chart using two lines of text: "BUY Lots: [total buy lots] | BUY
FREE

Daily Weekly Monthly High Low - Your Ultimate Tool for Precision Market Analysis
The 200 free download promotion has ended. The price has now been updated. Thank you, everyone!
Love it? Hate it? Let me know in a review! Feature requests and ideas for new tools are highly appreciated. :)
Try "The AUDCAD Trader":
https://www.mql5.com/en/market/product/151841 Overview:
Elevate your trading strategy with Daily Weekly Monthly High Low , a sophisticated MQL5 indicator designed to pinpoint c

Sync Crosshair — Multi-Chart Cursor Synchronization for MT5 See everything, everywhere, at the same time.
Sync Crosshair is a lightweight yet powerful indicator for MetaTrader 5 that instantly synchronizes your crosshair across all charts where it is installed. Move your mouse on one chart, and the exact time/price position appears on every other chart — effortless precision for serious traders. Why Sync Crosshair? Multi-Chart Analysis Made Simple — compare symbols and timeframes side by sid
FREE

SETTINGS Make sure to select Chart shift option in the chart.
(Right click in the chart ---> Properties (dialog box) ----> Select Chart Shift)
Kindly rate and comment about the product for upgradation & Support
When using candlestick timers, keep in mind that the timing of candlestick patterns can play a crucial role in your trading strategy. For instance, different timeframes (such as 1-minute, 5-minute, hourly, ) can provide varying insights into price movements and trends. Make sure to i
FREE

Highly configurable Moving average indicator.
Features: Highly customizable alert functions (at levels, crosses, direction changes via email, push, sound, popup) Multi timeframe ability Color customization (at levels, crosses, direction changes) Linear interpolation option Works on strategy tester in multi timeframe mode (at weekend without ticks also) Parameters:
MA Timeframe: You can set the lower/higher timeframes for Ma. MA Bar Shift: Y ou can set the offset of the line drawing. MA Period,
FREE

BEHOLD!!!
One of the best Breakout Indicator of all time is here. Multi Breakout Pattern looks at the preceding candles and timeframes to help you recognize the breakouts in real time.
The In-built function of supply and demand can help you evaluate your take profits and Stop losses
SEE THE SCREENSHOTS TO WITNESS SOME OF THE BEST BREAKOUTS
INPUTS
MaxBarsback: The max bars to look back
Slow length 1: Period lookback
Slow length 2: Period lookback
Slow length 3: Period lookback
Slow leng
FREE
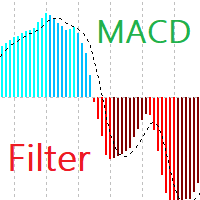
MACD Filter Introducing MACD Filter – a fresh take on the beloved MACD (Moving Average Convergence Divergence) indicator, developed specifically for the MetaTrader 5 platform. By applying the Fisher Transform for filtering and refining data, MACD Filter creates smoother lines, eliminating noise and providing clearer signals. Fisher Transform Filtering: Normalizes and smooths MACD data. This leads to smooth, less chaotic lines compared to traditional MACD, reducing false signals and simplifying
FREE

TransitX1 indicator is very useful, with unlimited signals and works on all the timeframes and all the piers. TransitX1 draws two trend lines very short trendlines (+/-20 bars) which can be considered as support and resistance. The support is in red trendline and the resistance is in green trendline. TransitX1 gives buying and selling signals, with only 3 being previous signals and the 4th one being the current signal. Buying signals are in green arrows and are always on the support trendline an
FREE

Adaptive Trend Master(ATM)– Kısa Kullanım Özeti
SET DOSYASI ICIN ILETISIME GECIN Adaptive Trend Master , özellikle BTC/USD ve XAU (Altın) gibi volatil piyasalarda kullanılmak üzere tasarlanmış, trend odaklı ve risk kontrollü bir otomatik işlem (Expert Advisor) sistemidir. Piyasa koşullarına göre kendini uyarlayabilen, çoklu indikatör onaylı bir algoritma ile çalışır. Ne yapar? Trend yönünü tespit eder Güçlü sinyal oluşmadan işleme girmez Her işlemde riski otomatik hesaplar Stop Loss ve Take
FREE

Introduction
The PF Maximizer is a game-changing non-repainting technical tool engineered to help traders distinguish genuine trend signals from erratic market fluctuations. By employing sophisticated algorithms and cutting-edge data analysis, this indicator efficiently filters out unwanted noise, empowering traders to identify the precise starting and ending points of substantial market moves.
Signal
Potential buy signal is generated when moving average is going up and the blue line cross a
FREE

Overview Magic 7 Indicator is a comprehensive MetaTrader 5 (MQL5) indicator that identifies seven different trading scenarios based on candlestick patterns and technical analysis. The indicator combines traditional price action patterns with modern concepts like Fair Value Gaps (FVG) to provide trading signals with precise entry points and stop loss levels. Features 7 Trading Scenarios : Each scenario identifies specific market conditions and trading opportunities Visual Signals : Clear buy/sell
FREE
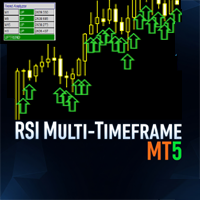
The MultiFrameRSIIndicator is a powerful MetaTrader 5 (MT5) indicator that leverages the Relative Strength Index (RSI) to analyze trends across multiple timeframes. This indicator synchronizes RSI-based trend signals from up to nine timeframes (M1, M5, M15, M30, H1, H4, D1, W1, MN1) and presents them with clear visual feedback, including a colored RSI line, signal arrows, and a customizable dashboard. Ideal for traders seeking momentum-based trend confirmation. Features Multi-Timeframe Analysis
FREE
MACD Storm is a professional Expert Advisor designed for traders who want to harness the proven strength of the Moving Average Convergence Divergence (MACD) indicator. Built with precision and strict compliance to MetaTrader 5 Market standards, this EA executes trades automatically based on clear MACD crossovers, while respecting broker rules for stops, freeze levels, and margin requirements.
Unlike many complex robots that overwhelm traders with dozens of parameters, MACD Storm focuses on cla
FREE

Scalping Emas Mini Konsisten
Gold Scalping Mini Consistent adalah EA scalping intraday untuk XAUUSD (Emas) yang fokus pada keuntungan kecil tetapi sering dengan risiko rendah. Strategi Utama Gold Scalping Mini Consistent dirancang untuk XAUUSD (Emas) dengan target tetap sekitar 100 poin (10 pip) per perdagangan. Strategi ini fokus pada entri short, keluar cepat, dan meminimalkan paparan volatilitas tinggi.
Fitur Utama
Performa Konsisten – keuntungan kecil tapi sering
Manajemen Uang Aman

Turn Gold Volatility into Profits — 24/7.
AI-powered XAUUSD bot with multi-strategy engine, precision SL/TP, and 10+ years of trading experience behind it.
Grew a 10K USC account to 50K USC — now it’s your turn.
Minimum Investment: $300 or 10000 USC Timeframe: H1 Symbol: Only Gold / XAUUSD We have clubbed all strategies and fine tuned the target levels. We use AI to calculate target & stop levels. We convert all indicators pattern trading signals into profit making trades. It has to be connec

This EA finds Fair Value Liquidity (FVL) on the chart, tracks when they get mitigated , and then looks for an inversion signal (price “fails” through the zone). When that inversion happens, it places a trade in the opposite direction of the original Liquidity gap (an Inverse FVG approach). It also lets you control when it trades using market sessions , and it can auto-close positions at New York open (all positions or profitable-only). Key advantages Clear, rule-based entries (no guessing): trad
FREE

Drawdown Protector is a utility tool used to manage your desired Max Daily Drawdown.
In the era of prop firms and challenges, it's highly important to be aware of daily drawdown limits. It's an effective EA that is simple to use for Equity Drawdown Management and prevention of revenge trading. Input parameters:
How many Hours to block trading? - Here, you set how many hours you want the EA to block new trades, after the Daily % Drawdown is breached. Value must be >0. Block trading until the n

Move TP & SL One Click Manager MT5 is a trading utility script that allows you to quickly move Take Profit (TP) and Stop Loss (SL) for active positions and pending orders with a single click. Script Modes The script supports two working modes: Pips Mode: Set TP and SL based on a fixed pip distance from the order open price. Price Mode: Set TP and SL directly at a specified price level. Order Selection You can choose which orders will be modified: all orders, active positions only, or pending ord
FREE

Envelopes RSI Zone Scalper MT5 EA Unleash your trading edge with the Envelopes RSI Zone Scalper MT5 EA , an Expert Advisor for MetaTrader 5, engineered to thrive in any market—forex, commodities, stocks, or indices. This dynamic EA combines the precision of Envelopes and RSI indicators with a zone-based scalping strategy, offering traders a versatile tool to capitalize on price movements across diverse instruments. Whether you’re scalping quick profits or navigating trending markets, this EA del
FREE

Corazon is an EA that operates using the martingale method, with carefully selected entry points. When a trade goes in the wrong direction, the EA will open martingale orders with increasing lot sizes and distances, then average the price and reset the overall TP for all the orders. Corazon EA also has options for trailing functionality for individual orders, trailing all martingale orders together, or only trailing the initial order.
FREE

This indicator is designed to help traders to help them Synchronize objects across all charts that have the same pair/currency.
Applicable objects: -Rectangle
-Trendlines
-Trendlines by Angle
-Horizontal Lines
-Vertical Lines
-Arrow Lines
-Channels
- Text boxes
Known Issues : - Visualization is not copied to the other charts. - If indicator is only placed in one chart, other charts with the same pair/currency will have difficulty deleting the objects if there is no "Sync Objects In Charts" in
FREE

AI Forecasts MT5 Indicator: Future Prediction System with Artificial Intelligence and Deep Learning (AI + ML) _ Main Features: - Future vision up to 20 candles ahead based on dynamic data analysis - Suitable for scalping trading
-Multi-colored prediction charts reflecting confidence levels in forecasts with white pip counter next to current Buy/Sell status -Probability zones showing expected price paths with margin of probability changes and direction -Multi-variable analysis primarily based

https://www.mql5.com/en/users/gedeegi/seller GEN (Trend Line) automatically detects swing highs and lows, plots dynamic upper & lower trendlines with adaptive slope (ATR, Standard Deviation, or Linear Regression approximation), and marks breakout points visually when the price crosses the trend boundaries. Perfect for price action, breakout, and trend confirmation strategies across multiple timeframes.
FREE

Elastic Grid MT5 is a multifunctional grid Expert Advisor designed to fully or partially automate various ideas related to grid trading (on a hedging account) . The Expert Advisor can trade on any timeframe, on any currency pair, on several currency pairs, on any number of signs. It does not interfere with manual trading, trading of other Expert Advisors, or the operation of any indicators.
It allows you to adjust your settings on the fly, works only with your own positions and orders, and for
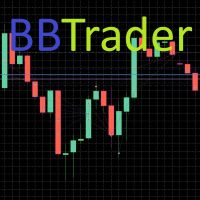
Introducing the BB Trader EA, an advanced trading tool harnessing insights from the Bollinger Band indicator. This expert advisor strategically makes use of the upper and lower bollinger bands. Key Features: Flexible trade options: Set the maximum number of trades for single or multiple entries. Optional ATR-adjusted system: Manage multiple trades while dynamically making adjustments for volatility. Versatile grid lot sizing: Choose between static or automatically increasing (non-martingale) op
FREE

Modern Dark Chart Theme Modern Dark Chart Theme is a clean, professional dark-mode chart style designed for traders who value clarity, focus, and reduced eye strain during long trading sessions. The theme uses carefully balanced dark tones with high-contrast candle colors, making price action easy to read in all market conditions. It is optimized for manual traders, scalpers, swing traders, and algorithmic traders who want a distraction-free trading environment. Key Features Professional da
FREE
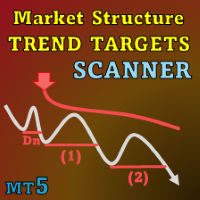
Special offer : ALL TOOLS , just $35 each! New tools will be $30 for the first week or the first 3 purchases ! Trading Tools Channel on MQL5 : Join my MQL5 channel to update the latest news from me I. Introduction
Market Structure Trend Targets Scanner is a powerful tool for analyzing market trends, identifying breakout points, and managing risk via a dynamic stop loss. By tracking previous highs and lows to pinpoint breakouts, this tool helps traders quickly recognize market tren
[ MT4 Version ] Are you tired of spending months on demo or live accounts to test your trading strategies? The Backtesting Simulator is the ultimate tool designed to elevate your backtesting experience to new heights. Utilizing Metatrader historical symbol information, it offers an unparalleled simulation of real market conditions. Take control of your testing speed, test ideas quickly or at a slower pace, and witness remarkable improvements in your testing performance. Forget about wasting tim

All in one Multipurpose Telegram Trade Management , Manage and Copy Trades on the go From Telegram Pro Version MT4: www.mql5.com/en/market/product/85691
Execute Trades on mobile with fast execution When away from desktop MT5, or scalping the market with mobile device, or needed to copy trades from telegram groups while away, or doing some other activities, Telegram EA Manager is an effective tool to perform any trade operation with swift execution. In other words, Our Telegram Trade Manag

Raptor EA - Algorithmic Trading System Product Description Raptor EA is an algorithmic trading solution designed for scalping in financial markets. The system combines technical indicators with optional machine learning components to identify trading opportunities while implementing risk management controls. This Expert Advisor has been developed for ECN accounts and is suitable for traders seeking automated execution with structured risk management. The system provides tools and safeguards for
FREE

Order Flow Lite: Synthetic Order Flow Analysis Tool Order Flow Lite is a technical analysis utility designed to visualize synthetic Order Flow, Footprint Charts, and Tick Analysis using standard broker data. It serves as the entry-level version of the professional analysis suite, providing essential functions for traders to analyze Delta logic and Volume Profiling based on recent price action. Included Features Footprint Bars: Displays "Sell x Buy" volume data for the last 3 closed candles. Tic
FREE

If you love this indicator, please leave a positive rating and comment, it will be a source of motivation to help me create more products <3 Key Takeaways Provides both trend and momentum signals in a single view. Entry and exit signals are based on the crossover of the RSI and Signal Line. Market Base Line offers insight into the overall trend direction. Volatility Bands help identify overbought and oversold market conditions.
FREE

One Mint EMA Higher Trend Scalper is a fast and flexible MT5 trading bot designed for quick entries while following the stronger higher-timeframe trend. It uses a clean EMA crossover on the main chart and confirms direction with a higher-frame trend filter to avoid counter-trend trades and improve consistency. Key Inputs Lot Size Take Profit Stop Loss Trailing Stop Max Trade Limit Close Opposite Trade Option Core Features EMA-based entry strategy for simple and fast scalping Higher Time Frame Tr
FREE

MT4 Version : https://www.mql5.com/en/market/product/90091 MT5 Version : https://www.mql5.com/en/market/product/93707
The "Multi Pair Currency Strength Meter" Expert Advisor (EA) is an advanced trading tool designed for forex traders looking to optimize their trading strategies through comprehensive market analysis and robust risk management techniques. This EA leverages the currency strength method, providing a clear indication of the relative strength and weakness of different currency pair

Otter Scalper Gold is an expert advisor that operates on the breakout strategy. The EA detects the highs and lows based on a specified range of candles and places Stop or Limit Orders accordingly. Otter Scalper Gold provides several types of stop loss options, including a wide choice of different stop losses to match your trading strategies. The EA includes advanced money management and risk management systems to help minimize losses and maximize profits. You can use Otter Scalper Gold for scalp

A simple utility to copy trade volumes from one MT5 or MT4 account to another MT5 account. You can copy positions between Netting and Hedging accounts in any combination. By default, positions opened by all matching symbols with the same volumes will be copied. If the symbol names are different or the volume of copied positions should be different or not all positions should be copied, then the desired behavior can be specified in the settings described in this post . This product will expand
FREE

Level Breakout Indicator is a technical analysis product that works from upper and lower boundaries, which can determine the direction of the trend. Works on candle 0 without redrawing or delays.
In its work, it uses a system of different indicators, the parameters of which have already been configured and combined into a single parameter - “ Scale ”, which performs gradation of periods.
The indicator is easy to use, does not require any calculations, using a single parameter you need to select

Pip Value Calculator - Instant Risk Assessment on Your Chart This powerful and lightweight utility instantly calculates the precise monetary value for any pip movement, displaying it directly on your chart so you can assess risk and potential profit at a glance. At its core, the indicator's sophisticated calculation engine runs silently with every price tick, ensuring the information you see is always up-to-date. It automatically detects the instrument you are trading—whether it's a Forex pair,
FREE

Start earning profits by copying All trades are sent by our successful Forex trader & are extremely profitable. You can earn profits by copying trades daily Trial Period included You'll also get access to extremely powerful trading education which is designed in a simple way for you to become a profitable trader, even if you have no trading experience. https://ec137gsj1wp5tp7dbjkdkxfr4x.hop.clickbank.net/?cbpage=vip
FREE

Overview Auto TPSL is a sophisticated MetaTrader 5 Expert Advisor designed to revolut ionize how traders manage their risk and protect profits. This powerful tool automatically sets and adjusts Take Profit (TP) and Stop Loss (SL ) levels, eliminating emotional decision-making and ensuring disciplined trading practices. The EA operates through two core systems:
Auto TPSL System The Auto TPSL system automatically calculates and sets appropriate Take Profit and Stop Loss level
FREE

Koala Trend Line Upgraded To Version 1.2 Last Upgrade Improvement : New Parameter Added that allow user to connect trend line to 2nd or 3th or Xth highest or lowest point.
My Request :
**Dear Customers Please Release Your Review On Koala Trend Line, And Let Me Improve By Your Feed Backs.
Join Koala Trading Solution Channel in mql5 community to find out the latest news about all koala products, join link is below : https://www.mql5.com/en/channels/koalatradingsolution
WHAT ABOUT OTHER FREE
FREE

BollingerBandsEA is an Expert Advisor designed to combine technical analysis with automated execution, utilizing the renowned Bollinger Bands strategy. Developed for traders of all experience levels, it offers a practical approach to streamline your trading activities in the financial market. Why Choose BollingerBandsEA? Strategy-Based Approach: Built on Bollinger Bands logic, the EA identifies trading opportunities using solid technical criteria. Smart Automation: Enables automated buy and sel
FREE
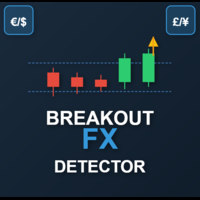
This is a powerful, session-aware breakout indicator designed for serious traders who thrive on volatility and structure. Engineered for precision, it identifies high-probability breakout zones during the London and New York trading sessions—where the market moves with intent. Key Features: Session Range Detection
Automatically detects and highlights the key price range of London and New York sessions. Breakout Confirmation
Identifies breakout candles after the session range, with clear bullis
FREE
This EA trades using the Stochastic Indicator. It offers many trading scenarios and flexible position management settings, plus many useful features like customizable trading sessions, a martingale and inverse martingale mode. [ Installation Guide | Update Guide | Troubleshooting | FAQ | All Products ] Easy to use and supervise It implements three different entry strategies Customizable break-even, SL, TP and trailing-stop Works for ECN/Non-ECN brokers Works for 2-3-4-5 digit symbols Trading can
FREE

KDJ Indicator for MT5 The KDJ Indicator for MT5 is a professional-grade momentum and trend analysis tool designed to help traders identify trend reversals , overbought/oversold conditions , and entry or exit opportunities with high accuracy. Originally developed as an enhancement of the Stochastic Oscillator , the KDJ adds a powerful J-line that reacts faster to price movement, giving traders earlier warnings of potential reversals. Key Features Three-Line System (K, D, J):
The K and D lines r
FREE

Discount on all my products until 01.05. Gold Veritas is a fully automatic Forex Expert Advisor for quiet hours. Monitoring the work of the adviser: https://www.mql5.com/en/users/bayburinmarat/seller Attention, from 20.02.2023 it is planned to increase prices for all my products by 30%. Correct GMT setting: https://www.mql5.com/en/blogs/post/743531 All the parameters necessary for the most understandable and simple optimization are available in just 6 settings. You can adapt the adviser to

- Displays horizontal lines for Previous Day High (PDH) and Previous Day Low (PDL) on the chart. - Customizable line colors via input parameters. - Sends sound alerts, pop-up notifications, and mobile push notifications upon the initial crossover of PDH or PDL. - Alerts are triggered only once per crossover event; they re-trigger only if the price moves away and re-crosses after a specified minimum interval. - Automatically updates the PDH/PDL levels at the start of each new day. - All indicator
FREE

Volume Weighted Average Price (VWAP) is a trading benchmark commonly used by Big Players that gives the average price a Symbol has traded throughout the day. It is based on both Volume and price. Additionally we put in this indicator the MVWAP (Moving Volume Weighted Average Price). For those who do not know the usage and the importance od this indicator I recommend a great article about this subject at Investopedia ( https://www.investopedia.com/articles/trading/11/trading-with-vwap-mvwap.asp )
FREE

SuperTrend Alert with Email Notification – Your Smart Market Sentinel! Overview: SuperTrend Alert with Email Notification is a lightweight and powerful tool that helps traders stay ahead of trend changes in real-time . Built on the widely trusted SuperTrend indicator , this tool monitors price action and instantly notifies you via email when a new BUY or SELL signal is triggered – no more missed opportunities! ️ Key Features: SuperTrend-Based Signals Uses SuperTrend algorithm (ATR-base

GOLD QUANTUM FUSION
Introducing: Gold Quantum Fusion EA – your ultimate gateway to financial prosperity and cutting-edge trading technology in the gold market. This expert advisor is meticulously crafted to bring you unparalleled trading performance, leveraging advanced algorithms and state-of-the-art strategies.
Why Choose Gold Quantum Fusion EA?
1. Based on the back-test results from 2024/01/01: Potential Exceptional Profitability
- Total Net Profit: $15,714.40 - Gross Profit: $15,939.30 -

Theme Switcher - Personalize Your Trading Terminal Description The Theme Switcher is an interactive panel that lets you quickly change the color scheme of your MetaTrader 5 chart. Designed for traders seeking a comfortable and personalized visual environment, This tool offers a variety of theme styles inspired by brands, movies, and professional designs. How to Use It Open the panel: Simply add the indicator to your chart, and a window with buttons for different themes will appear. Select a them
FREE
The MetaTrader Market offers a convenient and secure venue to buy applications for the MetaTrader platform. Download free demo versions of Expert Advisors and indicators right from your terminal for testing in the Strategy Tester.
Test applications in different modes to monitor the performance and make a payment for the product you want using the MQL5.community Payment System.
You are missing trading opportunities:
- Free trading apps
- Over 8,000 signals for copying
- Economic news for exploring financial markets
Registration
Log in
If you do not have an account, please register
Allow the use of cookies to log in to the MQL5.com website.
Please enable the necessary setting in your browser, otherwise you will not be able to log in.