Watch the Market tutorial videos on YouTube
How to buy а trading robot or an indicator
Run your EA on
virtual hosting
virtual hosting
Test аn indicator/trading robot before buying
Want to earn in the Market?
How to present a product for a sell-through
Expert Advisors and Indicators for MetaTrader 5 - 42

This indicator is a simple tool to spot a possible trend.
When the ribbon below the price bars, It will turn to Green color and the trend is seen to be bullish When the ribbon above the price bars, it will turn to Red color and the trend is seen to be bearish. It can be used a either Entry Signal Exit Signal or trailing stop, so it is very versatile. By default color : Green is UP trend and Red is Down trend and this work perfect with Bar4Colors.ex5
FREE

Live trade TEST ICT EA VS ICT manual: https://www.youtube.com/live/uKa9YD40Kn4
Introducing: Gold ICT EA 1.0 – Precision-Engineered for XAUUSD Scalping Built with purpose. Tuned for gold. Trusted by precision. Gold ICT EA 1.0 is an advanced automated trading system specially crafted for XAUUSD . Designed to operate on the M5 chart, it’s a no-nonsense solution for gold traders who value capital protection and consistent growth.
No unnecessary complications – just stability, discipline, and prec
FREE

BotGPT edition 2024 is different from what you have seen so far, it independently adapts to market conditions in real time. In 10 years, it will still be at the cutting edge and will fulfill its role flawlessly, guided by customer suggestions in order to create a perfect system, only 150 traders will be able to use it. Its success rate is exceptional, download the demo version for free and see its results for yourself : Try it ! It's an intraday, it trades at its own pace, programmed for (EURU

BEHOLD!!!
One of the best Breakout Indicator of all time is here. Multi Breakout Pattern looks at the preceding candles and timeframes to help you recognize the breakouts in real time.
The In-built function of supply and demand can help you evaluate your take profits and Stop losses
SEE THE SCREENSHOTS TO WITNESS SOME OF THE BEST BREAKOUTS
INPUTS
MaxBarsback: The max bars to look back
Slow length 1: Period lookback
Slow length 2: Period lookback
Slow length 3: Period lookback
Slow
FREE

The initial discount ! From September 26th to October 3rd, the discounted price is $199! The final price is $599! The BTC Winner EA achieved excellent returns after its release, and more importantly, it proved its feasibility on BTC. This gave me confidence, and I decided to develop a new, more aggressive, and superior BTC EA focused on short-term trading, with more trades. After years of tireless work, the Apocalypse BTC Scalper EA was born. DeepSeek has undoubtedly played a significant role

GoldPapi Trend Trailing Stop Daily is a premium Expert Advisor engineered specifically for XAUUSD (Gold) trading with a robust trend-following architecture, adaptive risk-management mechanisms, and an exceptionally precise Daily-based Trailing Stop system .
Designed with institutional-grade logic, dynamic stop-level protection, and intelligent margin-checking, this EA ensures maximum compatibility and stability across all major brokers. This EA is crafted for traders who seek consistent long-ter

Babylon Expert Advisor trades on support and resistance levels. Support and resistance levels are determined on the basis of a genetic algorithm based on artificial intelligence. This allows you to open trades not only at levels that are already visible in history, but also at the expected levels that may be formed in the future. Moreover, trading only in the direction of the trend increases reliability and minimizes possible drawdowns. After purchase, send me a private message to receive the se

Fair Value Gap Sweep is a unique and powerful indicator that draws fair value gaps on your chart and alerts you when a gap has been swept by the price. A fair value gap is a price gap that occurs when the market opens at a different level than the previous close, creating an imbalance between buyers and sellers. A gap sweep is when the price moves back to fill the gap, indicating a change in market sentiment and a potential trading opportunity.
Fair Value Gap Sweep indicator has the following
FREE
Weis Waves is a technical indicator developed by David Weis, inspired by Richard Wyckoff’s principles.
Unlike traditional volume, which is shown bar by bar, Weis Waves accumulates volume into bullish or bearish “waves,” restarting the count whenever price changes direction. This method allows traders to clearly see the true strength of market moves , as each wave reflects the intensity of the volume behind a sequence of candles. Key features: Groups volume into buying and selling waves. Highl
FREE

ATR Plus is an enhanced version of the classic ATR that shows not just volatility itself, but the directional energy of the market .
The indicator converts ATR into a normalized oscillator (0–100), allowing you to clearly see: who dominates the market — buyers or sellers when a trend begins when a trend loses strength when the market shifts into a range where volatility reaches exhaustion zones ATR Plus is perfect for momentum, trend-following, breakout and volatility-based systems. How ATR Plus
FREE

# DAILY SUPPORT AND RESISTANCE LEVELS - SEO OPTIMIZED DESCRIPTION
## SHORT DESCRIPTION (160 characters max)
```
Free pivot points indicator with daily support resistance levels for MT5. Perfect for intraday forex day trading and scalping strategies.
```
**Character count:** 159
**Keywords included:** pivot points, support, resistance, MT5, forex, day trading, scalping, free
---
## FULL DESCRIPTION (HTML Formatted for MQL5)
### Main Title
**Daily Support and Resistance Levels - Free Pivot
FREE

The VR Grid indicator is designed to create a graphical grid with user-defined settings. Unlike the standard grid , VR Grid is used to build circular levels . Depending on the user's choice, the step between the round levels can be arbitrary. In addition, unlike other indicators and utilities, VR Grid maintains the position of the grid even when the time period changes or the terminal is rebooted. You can find settings, set files, demo versions, instructions, problem solving, at [blog]
You can
FREE

This indicator was developed to support multiple timeframe analysis. In the indicator settings, the user can set the color, width, and style of the horizontal lines for each timeframe. This way, when the horizontal lines are inserted into the chart, they will be plotted with the timeframe settings.
MTF Lines also allows visibility control of another objets like rectangles, trend lines and texts.
This is a product developed by Renato Fiche Junior and available to all MetaTrader 4 and 5 users!
FREE
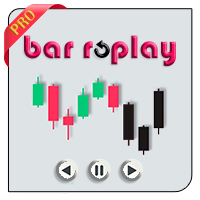
MT5 Bar Replay Pro Download demo version. These are the two basic steps to use this EA: How To Use Load the EA on your desired symbol Constructor input first. Load the EA on the newly created custom symbol, with the Controller input . Overview MT5 Bar Replay Pro is MetaTrader 5’s answer to TradingView’s Bar Replay feature. It comes fully equipped with all 21 MT5 timeframes, allowing you to go back as far as your broker’s data permits. It includes a built-in risk management tool to ensure pro

EMA Crossover Expert Advisor (Free MT5 EA) Automate Your Trading with the Classic Trend-Following Strategy The EMA Crossover EA is a free, fully automated trading tool designed for MetaTrader 5. It simplifies one of the most reliable technical strategies—the Moving Average Crossover into a "set and forget" solution for retail traders. Perfect for capturing big trends on major currency pairs like EURUSD and GBPUSD, this EA handles the entry, exit, and risk management so you don't have to watch th
FREE

The " YK Find Support And Resistance " indicator is a technical analysis tool used to identify key support and resistance levels on a price chart. Its features and functions are as follows:
1. Displays support and resistance levels using arrow lines and colored bands, with resistance in red and support in green.
2. Can be adjusted to calculate and display results from a specified timeframe using the forced_tf variable. If set to 0, it will use the current timeframe of the chart.
3. Uses th
FREE
Three Sixty Dollar EA
M1 FTMO Strategy: over/under actual Price inp_1:Worktime inp_4/9:Lot Settings Real Account with 200$. Only Pair DE40, US100, US30. Automatic added London Session. This Version works with fixed Lot buy/ sell. Write me privat Message of Questions when undecided. Gratis ex5 Code by Request. Mq5 Source Code for 30$ for Payment of a EA on my Page.
FREE

TransitX1 indicator is very useful, with unlimited signals and works on all the timeframes and all the piers. TransitX1 draws two trend lines very short trendlines (+/-20 bars) which can be considered as support and resistance. The support is in red trendline and the resistance is in green trendline. TransitX1 gives buying and selling signals, with only 3 being previous signals and the 4th one being the current signal. Buying signals are in green arrows and are always on the support trendline an
FREE

Sessions are very important in trading and often good area where to look for setup. In SMC, ICT we will look for Asian session to serve as liquidity
This indicator displays: High & Low of the Asia session Midnight New York time opening line
Congifuration Line Style, color Label position, size, color Start of the level (Start of the day, Start of the session, Highest or Lowest point in the session)
Any questions or comments, send me a direct message here https://www.mql5.com/en/users/mvonline
FREE

Overview: The US Dollar Index (DXY) is a key financial indicator that measures the strength of the US Dollar against a basket of six major world currencies. This index is crucial for traders and investors as it provides a comprehensive view of the overall market sentiment towards the US Dollar and its relative performance. All Products | Contact Composition: The DXY's composition is as follows: Euro (EUR): 57.6% Japanese Yen (JPY): 13.6% British Pound (GBP): 11.9% Canadian Dollar (CAD): 9.1%
FREE

The Ultimate Arbitrage Machines EA is a professional-grade solution designed for both statistical and triangular arbitrage in forex markets. This EA adaptively captures mean-reversion opportunities while employing robust risk controls. It features dynamic threshold adjustment, adaptive risk management, multi-strategy execution, and real-time market adaptation. The EA auto-calibrates Z-Score parameters, intelligently positions TP/SL, and uses multi-factor position sizing. It detects both statist
FREE

Fully automated trending EA with active strategy and advanced averaging system. Orders are opened according to a trend filter using oscillators for greater signal security. Has a simple and clear setup. The EA is suitable for use on any instruments and timeframes Advantages: Automated system with the ability to add manual orders Adjustable Overlap Recovery Algorithm Ability to trade in one or both directions Uses averaging when moving in the opposite direction Pluggable automatic volume calculat

Relative Volume or RVOL is an indicator that averages the volume of X amount of days, making it easy to compare sessions volumes.
The histogram only has 3 colors:
Green - Above average volume
Yellow - Average volume
Red - Below average volume
The default setting is 20 days, which corresponds more or less to a month of trading.
In this version is possible to choose between tick and real volumes (if you are using a broker which offers future contracts)
With the data obtained from this in
FREE

This indicator displays buy or sell signals according to Bill Williams' definition of the Trading Zone. [ Installation Guide | Update Guide | Troubleshooting | FAQ | All Products ] Easy to use and understand Avoid trading flat markets Deterministic indicator with clear rules The indicator is non-repainting It implements alerts of all kinds It has straightforward trading implications. A blue arrow is a buy signal A red arrow is a sell signal According to Bill Williams trading in the zone helps t
FREE

TCM Breakeven Calculator Ultra is a professional utility designed to instantly visualize your True Weighted Average Entry Price with the Total Lot Size . Unlike simple averages, this tool mathematically accounts for Lot Sizes , giving you the exact price where your net position reaches zero loss. It automatically scans your terminal and isolates trades based on the chart you are viewing. If you are trading multiple pairs (e.g., EURUSD and Gold) simultaneously, this indicator will onl
FREE
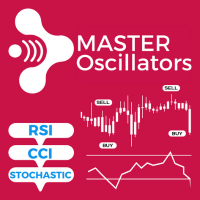
Meet Master Oscillators, a bot that makes trading simple and flexible!
Choose from RSI, CCI, or Stochastic signals and build your own strategy. This bot gives you many tools, like MA filter, dynamic lot sizes, Kelly Criterion calculator, dynamic SL and TP levels, and more.
No matter your trading style, Master Oscillators is here for you. It gives you important info, stats, and more, while always keeping your trading safe. If you've ever wanted to build your own trading bot but didn't know how,

The indicator synchronizes eight types of markings on several charts of one trading instrument.
This indicator is convenient to use in conjunction with "Multichart Dashboard" or other similar assistant that allows you to work with several charts at the same time.
"Multichart Dashboard" can be found under the link on my youtube channel.
Settings:
enable vertical line synchronization
enable horizontal line synchronization
enable Trend Line synchronization
enabling Fibonacci Retracement synchron
FREE
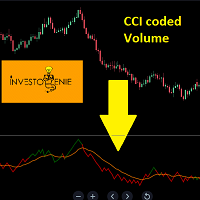
The Indicator is based on Commodity Channel Index (CCI) coded on Volume. The concept is to try and analyze the movement of Volume and Price in a certain direction
Concept:
If the Price of the indicator moves below the threshold price, it turns RED indicating the direction downwards is getting strong.
If the Price of the indicator moves above the threshold price, it turns GREEN indicating the direction upwards is getting strong.
The moving average acts as a great filter to decide entry/exit poi
FREE

Flaminex Gold Pro - Advanced Multi-Indicator Gold Trading System Professional Day Trading EA with 90% Win Rate & Smart Dynamic Exits
NOT Grid | NOT Martingale | NOT AI Hype | R CORE TRADING STRATEGY Flaminex Gold Pro employs a multi-indicator confluence system that combines: EMA (Exponential Moving Average) - Trend direction identification ADX (Average Directional Index) - Trend strength confirmation CCI (Commodity Channel Index) - Momentum analysis Fibonacci Levels - Key support/resis

Introduction
The PF Maximizer is a game-changing non-repainting technical tool engineered to help traders distinguish genuine trend signals from erratic market fluctuations. By employing sophisticated algorithms and cutting-edge data analysis, this indicator efficiently filters out unwanted noise, empowering traders to identify the precise starting and ending points of substantial market moves.
Signal
Potential buy signal is generated when moving average is going up and the blue line cross a
FREE

Check out my TRADE PLANNER MT5 – strongly recommended to anticipate account scenarios before risking any money. This is the Bill Williams Awesome Oscillator indicator calculated from Heikin Ashi candles. Here you find multi-colored histogram which is helpful when identify weakness or strength of trend in the market. To use it, just simply drop it on the chart and you don't need to change parameters except one: switch between Heikin Ashi or normal candles (see attached picture).
FREE
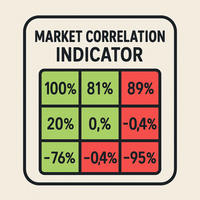
General Description
This indicator calculates in real time the Pearson correlation coefficient between multiple financial instruments. It displays a dynamic correlation matrix that shows the strength and direction of relationships among currencies, indices, stocks, and commodities. Main Parameters SymbolsList : list of instruments to compare (comma separated) BarsToAnalyze : number of historical bars used for calculation TimeFrame : timeframe for correlation analysis Correlation Interpretation
FREE

Probability emerges to record higher prices when MACD breaks out oscillator historical resistance level. It's strongly encouraged to confirm price breakout with oscillator breakout since they have comparable effects to price breaking support and resistance levels; surely, short trades will have the same perception. As advantage, many times oscillator breakout precedes price breakout as early alert to upcoming event as illustrated by 2nd & 3rd screenshot. Furthermore, divergence is confirmed
FREE
This expert is a pure volatility scalper working with market orders orders. Expert not use any indicator, only use prices action and volatility of price to generate signals. Using an algorithm to calculate the speed of price to generate the signals. There are three conditions for it to work: Tight spread Fast execution Stop level = 0 Please during the tests of this EA do not simultaneously use another EA in the same terminal because it affects the modification speed. Try expert on demo accoun
FREE

The Abyss Weaver EA – Adaptive AUDCAD Mean Reversion System 1. System Philosophy The Abyss Weaver is an advanced automated trading system designed specifically for the AUDCAD currency pair. The EA's core logic is built upon the Mean Reversion characteristics of AUDCAD, utilizing a sophisticated grid-based framework to capitalize on price deviations from the statistical mean. 2. Operational Mechanism Operating exclusively on the M5 or M15 timeframe , the EA identifies high-probability entry poin
FREE

The Solarwind No Repaint is a technical oscillator that applies the Fisher Transform to normalized price data, creating a histogram-based indicator that identifies potential market turning points. This indicator converts price movements into a Gaussian normal distribution, making cyclical patterns and momentum shifts more visible to traders. How It Works The indicator processes price data through several computational steps: High-Low Analysis : Calculates the highest high and lowest low over the
FREE

Wheel of Forex by Victorious Creations Labs Trending markets ,Ranging Markets .Who cares ! . How many times can uncorrelated random pairs be wrong? .
Lose the analysis paralysis and start seeing positive outcomes through unconventional means. 95% of traders fail because 95% of traders do what they taught you, what they wanted you to do! Play the game your way.
Wheel of Forex is a hybrid manual/automated trading system designed to help traders develop essential skills through a practical ap
This EA trades untested fractals using pending orders. It offers many trading behaviors and flexible position management settings, plus many useful features like customizable trading sessions and a martingale mode. [ Installation Guide | Update Guide | Troubleshooting | FAQ | All Products ] Easy to use and supervise It implements 4 different trading behaviors Customizable break-even, SL, TP and trailing-stop Works for ECN/Non-ECN brokers Works for 2-3-4-5 digit symbols Trading can be NFA/FIFO C
FREE

This panel offers the following features: stop loss, partial sell, take profit, and trailing breakeven levels.
Customizable settings
1: In this area you can set the risk for the order. 2: Likewise, Stop Loss and Take Profit are set manually in the chart. 3: Trailing stop and breakeven can also be activated. Distance adjustable. 4: Order comment can be created. 5: Partial sale by CRV and percentage (if the order is percentage in profit). 6: Partial sale can also be carried out manually an
FREE

AlphaPrice MT5 is a trading Expert Advisor (EA) designed for the Forex market and other financial markets via the MetaTrader 5 platform. It is based on a price momentum trading strategy, allowing it to effectively capture strong price movements while minimizing risks during stagnant periods. The EA uses minimal settings, making it easy to set up quickly, and completely avoids risky methods such as martingale and grid strategies. Key Features: Momentum Trading – The EA analyzes market mom
FREE
CLICK HERE TO SEE ALL MY FREE PRODUCTS
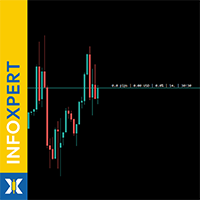
InfoXpert is a free and intelligent tool for MetaTrader 5 that displays all essential trading data directly on your chart – live, clear, and precise . You can instantly see your profit or loss (in currency and percentage), the spread , and the remaining candle time – perfect for quick decisions in active trading. All elements are fully customizable – you decide which data to display , what colors to use , and where the information appears on your chart –
FREE
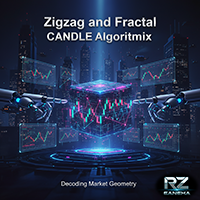
ZIGZAG and FRACTAL CANDLE PRO ( Only candles, No RSI strength panel) " Suitable for QQE RITZ " > Check My Product is an advanced market structure visualization system built for precision trend detection, powered by dynamic fractal logic and adaptive swing validation.
It seamlessly identifies Higher Highs (HH), Lower Lows (LL), and key structural shifts — allowing traders to read the true rhythm of market transitions with institutional clarity. This system combines ZigZag precision , fractal
FREE

The ChanLun or Chan theory is one of the most popular trading theories in China. But it seems like that it has little influence in western countries. Actually, the Chan Theory is based on a sophisticated mathematical model. The basic idea ChanLun is to simplify the bar chart by its model. With the help of ChanLun, a trader can analyze and predict the trend of future goods, stocks.
In ChanLun, there are several basic elements called fractals, strokes, line segments and pivots . A trader should pa
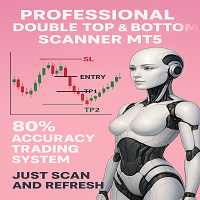
PROFESSIONAL DOUBLE TOP/BOTTOM PATTERN SCANNER
The Ultimate Reversal Trading System for Forex & Crypto Traders
TRANSFORM YOUR TRADING WITH INSTANT PATTERN RECOGNITION
Are you tired of missing profitable reversal setups? Exhausted from staring at charts for hours, trying to spot double tops and bottoms? Frustrated with false breakouts and missed entries?
What if I told you there's a professional-grade tool that: SCANS ALL SYMBOLS AUTOMATICALLY - No more manual chart hunting DRAWS PATTER

RSIMA Concept combines the RSI indicator with moving averages (MA) to generate trading signals. RSI is used to determine whether the market is overbought or oversold, while MA is used to determine price trends. A buy signal is generated when RSI is overbought, and the price is above the MA; a sell signal is generated when RSI is oversold or when the MA produces a death cross. All the best as you try the bot
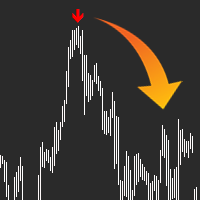
QUICK OVERVIEW: Use AI to predict the markets with AI Arrow, the ultimate trading tool, let it manage the probabilities and send you a simple signal in the form of an arrow, ready to trade, no complex configurations. The indicator will analyze the market and let you know when a potential movement will happen, sometimes it takes some extra bars for the movement to happen as it can't predict the exact top/bottom every time. Arrow will appear at the start of a new bar and alert you, so you have ti
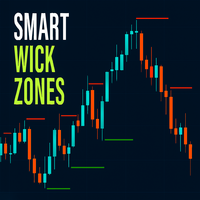
Smart Wick Zones indicator is a powerful tool designed to highlight hidden areas of price rejection and liquidity on your chart. By analyzing candle wicks (also called shadows or tails), the indicator automatically draws horizontal zones where strong buying or selling pressure has previously appeared. These wick zones often mark turning points in the market or areas where price reacts strongly, making them excellent references for support and resistance.
Instead of manually scanning candles for
FREE
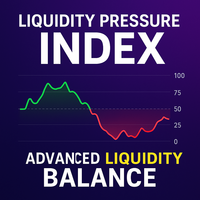
Liquidity Pressure Index (LPI) is an advanced technical indicator designed to uncover the hidden battle between buyers and sellers in the market. Unlike conventional oscillators that only rely on price movements, LPI integrates market depth (order book data), ATR-based volatility compression, and adaptive smoothing to give traders a deeper view of true liquidity dynamics.
By combining price action with volume absorption and order flow pressure, the LPI helps traders anticipate shifts in market
FREE

Streamline your trade closure process with the Close Manager MT5, a powerful Expert Advisor (EA) designed to automate trade exits for manual or EA-placed trades on MetaTrader 5, offering traders precise control over exit strategies. Widely praised on MQL5, Forex Factory, and Reddit’s r/Forex for its versatile and customizable closure criteria, this EA is a favorite among scalpers, day traders, and swing traders in volatile markets like forex, indices, and cryptocurrencies. Users report a 30-50%
FREE
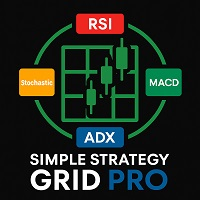
Simple Strategy Grid Pro is a trading advisor combining four indicators (RSI, Stochastic, MACD, ADX) into a grid-based strategy. Suitable for both novice and experienced traders due to its flexible settings and automation. Strategy The advisor enters trades on signal changes from FALSE to TRUE, using RSI > 50, Stochastic > 50, MACD above signal line, and ADX > 25 for long positions (opposite for shorts). Take Profit is calculated from VWAP, with grid steps adjusted via ATR. Key Features Combin
FREE

VORTEX OSCILLATOR: Master the Volume Flow VORTEX OSCILLATOR is a high-performance trading tool that reimagines the classic Vortex indicator as an ultra-responsive precision oscillator. Designed for traders who demand absolute clarity, it fuses price action with Tick Volume to reveal the true momentum behind every market move. Why VORTEX OSCILLATOR is a Game Changer Most indicators only track price, often reacting too late. VORTEX OSCILLATOR uses a sophisticated Volume-Weighted Flow algorit

With this easy to set up indicator you can display and set alerts for the following candlestick formations: Bull Breakout, Bear Breakout, Hammer, Pin, Bullish Engulfing, Bearish Engulfing. Input parameters: ShortArrowColor: The color of the Arrows, displaying a Bearish candle formation LongArrowColor: The color of the Arrows displaying a Bullish candle formation BullishEngulfing: Disabled/Enabled/EnabledwithAlert BearishEngulfing: Disabled/Enabled/EnabledwithAlert Pin: Disabled/Enabled/Enabledw
FREE

Sorry for the excellent 340% p.a. performance!
Yes, you read that right: these 340% p.a. backtest results are almost indecently good. But please don’t get me wrong – this is not a marketing trick, but the result of clean programming and honest backtests. Of course, such dream returns are not realistically sustainable forever, since after a few years, any EA in backtesting eventually hits the lot size limits. Still: Stealth 150 DE40 shows what’s possible when you simply let the algorithm d

Advanced Scalpers Club Grid Trading System This Expert Advisor supports grid trading for users who open initial positions manually. It manages grid positions with defined risk controls. Core Features Grid Management Detects manual trades and adds grid positions around them. Each manual position has its own grid with a set maximum number of levels (default: 10). Uses ticket numbers to separate grids for different base trades. Sets grid step as a percentage of price. Prevents duplicate positions
FREE
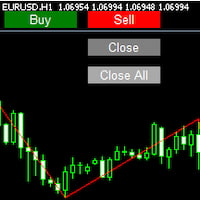
Imagine flying a real aircraft without ever stepping into a flight simulator. That's what trading is like. You have to simulate your strategy before you can take it to a live market. It is good if you can simulate things speedily before even stepping into any live market, or before coming up with an automated system. People don't have all day to stare at a higher timeframe chart until the entry signal finally arrives. That's why I built this so that you can simulate your strategy with speed. Th
FREE
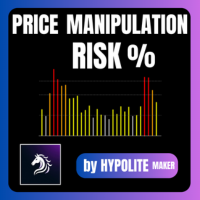
Price Manipulation Risk Indicator Advanced Tool for Market Risk Evaluation & Manipulation Detection Price Manipulation Risk Indicator is a professional tool designed to measure the current risk level in the market.
It evaluates price behavior, market activity, and candle dynamics to detect unstable or potentially manipulated environments. This indicator helps traders avoid traps , filter false signals , and improve timing in both entries and exits. Product Purpose Provide an immediate a
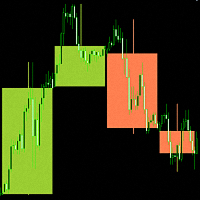
"Candlesticks MTF 5" is an information indicator that displays "Japanese Candlesticks" . The indicator analyzes and determines the opening and closing times of candles from higher time frames.
An algorithm has been developed for the "Candlesticks MTF 5" indicator that corrects the discrepancy between the opening and closing times of candles from higher time frames. For example, if the opening time of a candle on a weekly time frame is the 1st of the month, and on the smaller time frame this da
FREE
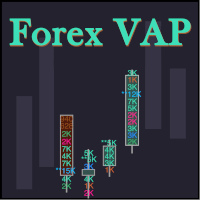
What do you see inside a candle? How to interpret the fight between bulls and bears? The candlestick chart brings a lot of information, but the volume is lacking in the candlestick body. This is where the Forex Volume At Price Expert Advisor comes in. This advisor searches for a set of recent trades, calculates the buy and sell attack volumes and prints on the candles, the volume value in each price range. You can also define up to ten colors to filter volumes and make it easier to
FREE
Accurate Buy Sell System is a clean and reliable swing-based indicator designed to identify trend reversals and entry zones with high precision. The algorithm follows the original “Accurate Swing Trading System” concept from TradingView (by ceyhun) and has been fully re-engineered for MetaTrader 5. 1:1 match with TradingView behavior
Works on all symbols and timeframes
Clean non-repainting signals when used after candle close
Visual BUY/SELL arrows + colored dynamic trendline
Popup al
FREE
Trade donchian breakouts with complete freedom. This EA can trade any breakout period, any timeframe, with pending or market orders- as desired- and implements many other useful features for the exigent trader, like customizable trading sessions and week days, a martingale mode and inverse martingale mode. [ Installation Guide | Update Guide | Troubleshooting | FAQ | All Products ] Easy to use and supervise Customizable trading direction Customizable donchian breakout period It can trade using
FREE

Smart Money Concepts Indicator - Professional ICT/SMC Trading System Transform Your Trading with Institutional-Grade Smart Money Analysis Unlock the power of Smart Money Concepts (SMC) and Inner Circle Trader (ICT) methodologies with this advanced indicator that identifies high-probability entry zones and intelligently sets Take Profit targets at the next Point of Interest (POI). Stop guessing where to exit your trades - let institutional logic guide you to the next Order Block or key market
FREE
FlipX 1 – Initial version
Asset: FlipX 1 - H1
Exclusive broker: WelTrade
Strategy optimized with a focus on compound interest Key performance highlights of FlipX 1: Total net profit: 253,887.34 USD
Initial deposit: 20 USD
Profit factor: 2.93
Recovery factor: 15.31
Expected payoff: 1,410.49 USD
Gross profit: 385,122.87 USD
Gross loss: -131,235.53 USD
Maximum absolute drawdown: 11,740.00 USD (9.22%)
Total trades: 180
Winning trades percentage: 48.89%
Sharpe ratio: 5.42
Z-Score: -0.07 (no statisti

FiboEvo FX: Hybrid Fibo & Adaptive Grid Strategy USE ON HEDGE ACCOUNTS ONLY Short Description "Graybox" Expert Advisor specialized in Forex . It combines technical Fibonacci entries, Flow Filters (VWAP/ADX), and an ATR Adaptive Grid system for position recovery. Overview FiboEvo FX was designed for dynamic Forex market conditions. It trades breakouts and Fibonacci retracements in favor of the trend. Its key differentiator is the Auto-Adaptive (ATR) system: instead of using fixed distances for th
FREE

This is a simple Orderblock alert indicator. it alerts you once it spots a bullish or bearish OB. what you choose to do with the alert, is left to you. Feel free to test on demo before use. (I'll be working on a combo i.e this and an EA working side by side, anticipate) Bullish OB has a light blue color and bearish has a light red color (rectangle box drawn on chart). Please trade wisely and don't forget to leave a positive review. thanks More blues to you, and Happy Trading!
FREE

This Expert Advisor uses statistical arbitrage to trade cryptocurrency pairs (e.g., BTCUSD & ETHUSD). It identifies mispricings and executes trades based on deviations from historical correlations. The EA employs mean reversion, pair trading, and cointegration analysis. It features advanced risk management, including dynamic position sizing, ATR-based stop-loss/take-profit, equity protection, and drawdown limits. It also includes smart order handling, real-time position verification, and statis
FREE

Overview EMA Scalper is a technical indicator designed for the MetaTrader 5 platform. This tool helps traders identify potential trading signals based on the crossover between price and an Exponential Moving Average (EMA), combined with a dynamic price channel. The indicator is suitable for scalpers or day traders and works across various timeframes and financial instruments. How It Works The indicator's logic is based on two main components: EMA Crossover: The core signal is generated when the
FREE

Hi-Lo is an indicator whose purpose is to more precisely assist the trends of a given asset - thus indicating the possible best time to buy or sell.
What is Hi-lo?
Hi-Lo is a term derived from English, where Hi is linked to the word High and Lo to the word Low. It is a trend indicator used to assess asset trading in the financial market.
Therefore, its use is given to identify whether a particular asset is showing an upward or downward trend in value. In this way, Hi-Lo Activator can be tran
FREE

Blahtech Moving Average indicator is a multitimeframe version of the standard Moving Average indicator. It is also enhanced with customisable alerts, period breaks and other configuration options. The 50 day and 200 day moving averages are widely followed by investors and traders, with breaks above and below the MA lines considered to be signals of interest. Links [ Install | Update | Training | All Products ]
Feature Highlights Up to three timeframes Configurable calculation variabl
FREE
Based on the Extreme Trend Indicator on Trading View converted for MT5. Usage of the Indicator is free, but if you want the source code, you can purchase the source code by messaging me.
Extreme Trend is an indicator that identifies when a new trend is forming and creates a trading signal. This indicator can be used for many markets, forex, gold etc. If you have any inquiries or want to create an EA using this indicator, you can message me.
FREE
EA Portfolio Analytics Dashboard Pro - Advanced Multi-EA Performance Monitor EA Portfolio Analytics Trading Dashboard Pro is a professional MetaTrader 5 tool designed for advanced portfolio management and real-time performance analytics. Monitor all your Expert Advisors simultaneously with institutional-grade metrics. Key Benefits: Multi-EA Performance Matrix: Track unlimited EAs and their statistics in a single view. Real-Time Risk Analytics: Monitor key metrics like Sharpe Ratio, Value at
The MetaTrader Market is a unique store of trading robots and technical indicators.
Read the MQL5.community User Memo to learn more about the unique services that we offer to traders: copying trading signals, custom applications developed by freelancers, automatic payments via the Payment System and the MQL5 Cloud Network.
You are missing trading opportunities:
- Free trading apps
- Over 8,000 signals for copying
- Economic news for exploring financial markets
Registration
Log in
If you do not have an account, please register
Allow the use of cookies to log in to the MQL5.com website.
Please enable the necessary setting in your browser, otherwise you will not be able to log in.