Watch the Market tutorial videos on YouTube
How to buy а trading robot or an indicator
Run your EA on
virtual hosting
virtual hosting
Test аn indicator/trading robot before buying
Want to earn in the Market?
How to present a product for a sell-through
Expert Advisors and Indicators for MetaTrader 5 - 48

Gold Pro SMC Big Player EA MT5 - Note This EA Can also be used on Indices such as US30, NASDAQ, FR40, DAX, UK, BTCUSD, Metals and Currencies. Write Separately to me for set files after purchase. Set file for Backtesting/forward testing is attached in Comment Section- Must Use it on XAUUSD/Gold in M30 time. The Gold Pro SMC Big Player EA MT5 is a next-generation trading system built on Smart Money Concepts (SMC) and institutional order flow logic .
It identifies high-probability zones where inst

Genaral: Not martingale, not a grid; Use on EURUSD Use on M5
Signals: There is a good rational algorithm. Work of two indicators: Chaikin and DeMarker (from 2 timeframes) (you can set a separate Timeframe for each indicator)
Stop Loss/Take Profit: There is a good money management system (there are several type for trailing stop loss); There is virtual levels of Stop Loss / Take Profit; There is smart lot (percent by risk) or fix lot
Important: EA can work on closed candles, and on curr
FREE

The Draggable Candle Timer is a clean, minimal countdown to the next candle close. Fully customizable and freely draggable, it can be placed anywhere on the chart without interfering with trading or analysis. The timer runs on the system clock, avoiding the glitches and delays common in candle timers that rely on the Market Watch clock. An optional candle-close alert can be enabled for traders who want a simple sound notification as the current candle approaches its close — useful for those rel
FREE

The Nadaraya-Watson Envelope is a non-parametric regression-based indicator that helps traders identify trends, support, and resistance levels with smooth adaptive bands. Unlike traditional moving averages or standard deviation-based envelopes, this indicator applies the Nadaraya-Watson kernel regression , which dynamically adjusts to price movements, reducing lag while maintaining responsiveness.
Key Features: • Adaptive Trend Detection – Smooths price action while remaining responsive to m
FREE

INTRODUCTION : The breakout strength meter is a trading tool that is used to identify which currencies are the strongest to breakout, and which currencies are the weakest to breakout. The settings for the indicator are easy, and if you cannot find the settings, please leave a comment The tools are completely free to use Please, if you like the indicator, please leave a comment and rate the indicator in order to develop it
FREE
This indicator provides a clear, at-a-glance dashboard for monitoring both the Relative Strength Index (RSI) and Stochastic Oscillator on any instrument or timeframe.
Whenever both RSI and Stochastic %K simultaneously exceed their respective overbought or oversold levels, the indicator displays an arrow signal in the indicator window.
These signals highlight strong momentum and can help traders quickly identify high-probability reversal zones. As with all my free tools, the arrow symbol can be e
FREE

BandPulse is a powerful trading expert that combines Martingale, Hedging, and Scalping strategies, simplifying the management of trading complexities. This EA uses advanced algorithms to maximize the strengths of each strategy while meticulously managing risks.
The balance-based risk management feature provides users with safety, and when used in conjunction with IAMFX-Agent , it can achieve both risk management and profit maximization.
This combination is designed to offer users the best pos
FREE

DGoldInfinity – The Ultimate Professional Gold Trading EA DGoldInfinity EA is a fully automated trading system ( Expert Advisor) specifically designed for scalping the XAUUSD ( Gold) market on the M15 timeframe .
It features precise entry strategies using advanced AI filters, robust risk management, and disciplined execution logic for professional- grade results. Key Features 1. High- Precision Smart Entry Strategy Combines multiple filters: EMA, RSI, MA10, Stochastic, and Trend Filter Th

Fair Value Gap Sweep is a unique and powerful indicator that draws fair value gaps on your chart and alerts you when a gap has been swept by the price. A fair value gap is a price gap that occurs when the market opens at a different level than the previous close, creating an imbalance between buyers and sellers. A gap sweep is when the price moves back to fill the gap, indicating a change in market sentiment and a potential trading opportunity.
Fair Value Gap Sweep indicator has the following
FREE

Forex17 Clock is a lightweight and minimalist utility for MetaTrader 5, designed to display the broker server time and/or a user-adjusted time directly on the chart. The purpose of the product is to provide clear and accurate time information without interfering with chart analysis, keeping the chart clean and functional. The clock is drawn directly on the chart using text only, without panels, backgrounds, borders, or intrusive visual elements. This approach ensures low resource usage, excellen
FREE

Drag Drop Lot Size Calculator Overview Drag Drop Lot Size Calculator is a chart-based risk and position sizing tool for MetaTrader 5. It calculates the appropriate lot size based on your account balance (or equity), the selected risk percentage, and the stop-loss distance defined by a single horizontal line on the chart. A compact on-chart panel displays the key values in real time. Key Features One-line workflow: uses a single horizontal line as the stop-loss level Real-time lot size calculatio
FREE

YOU CAN NOW DOWNLOAD FREE VERSIONS OF OUR PAID INDICATORS . IT'S OUR WAY OF GIVING BACK TO THE COMMUNITY ! >>> GO HERE TO DOWNLOAD
The Volatility Ratio was developed by Jack D. Schwager to identify trading range and signal potential breakouts. The volatility ratio is defined as the current day's true range divided by the true range over a certain number of days N (i.e. N periods). The following formula is used to calculate the volatility ratio: Volatility Ratio (VR) = Today's True Range
FREE

Smart Grid MT5 automatically recognizes any symbol, period and scale of the chart and marks it up accordingly. It is possible to mark up the chart by trading sessions. The grid consists of the two main line types.
Vertical lines There are two visualization methods: Standard - the lines are divided into three types, separating: Small time period. Medium time period. Large time period. Trading Session - the lines are divided into groups (a total of ten). Each group has two lines: the first is res
FREE

Velas Multi Time Frame
Las velas multi time frame, también conocidas como "MTF candles" en inglés, son un indicador técnico que permite visualizar velas japonesas de un marco temporal diferente al marco temporal principal en el que estás operando. Este enfoque ofrece una perspectiva más amplia del comportamiento del precio, lo que resulta especialmente útil para los traders que emplean estrategias de acción del precio. A continuación, se detallan los conceptos clave relacionados con este indic
FREE
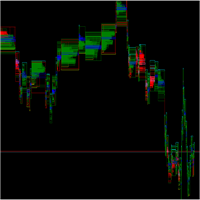
O SpreadFlow é um indicador para MetaTrader que gera um gráfico totalmente baseado no comportamento do fluxo de negócios, em vez de se limitar apenas a candles de tempo ou volume.
Ele organiza as informações de cada tick em quatro dimensões principais: Spread – monitora a diferença entre BID e ASK ao longo do tempo, mostrando momentos de compressão e alargamento do spread, associados a maior ou menor liquidez. Negócio no mesmo preço – identifica quando sucessivos negócios ocorrem no mesmo nível
FREE

DoubleOB is an automated EA designed to trade EUR/USD M5. It uses Order Blocks, dynamic exits and trailing stops with advanced risk management. Ideal for safe and consistent scalping. Compatible with optimization and VPS.
Optimized for EUR/USD (M5) High parameter customization Order Blocks and FVGs detection Dynamic TP/SL management with pivot points Automatic Trail Stop & Break Even Hourly session filtering Built-in daily risk management
Included tools and parameters:
Hourly settings (Star
FREE

Double RSI EA – Smart Multi-Timeframe Strategy This Expert Advisor uses two RSI indicators from different timeframes to confirm Buy/Sell signals. A trade is opened only when both RSI values meet the required level — reducing false entries and improving accuracy. Dual RSI confirmation (e.g., H1 + M15) Price-based SL/TP and optional trailing stop Only one active trade at a time Reverse trades enabled after signal change ️ On-chart status panel for RSI1, RSI2 & trade status Works
FREE
This is the automatic realization of multi single and open position EA, welcome to use. It has passed many historical data tests before it was put on the shelves. The following is EA's principle of multiple orders and closing positions: 1. Through the golden fork generated by the two moving averages, multiple orders can be automatically bought. The cycles of the two moving averages can be set by themselves. The default value of the small cycle moving average is 5, and the default value of the l
FREE

RSI ALARM (For Metatrader 5)
This indicator works like a normal RSI with all its settings (Periodicity, colors, levels, etc),
but additionally, alarms can be set at the upper and lower level (Example 70 and 30), with the possibility of adjusting these levels by moving the blue and red lines to establish the upper and lower levels.
You can also turn on and off an additional function that creates an arrow on the chart when the expected upper or lower RSI is met.

The behavior of different currency pairs is interconnected. The Visual Correlation indicator allows you to display different Symbols on a single chart while preserving the scale. You can determine a positive, negative correlation, or lack thereof. Some instruments begin to move earlier than others. Such moments can be determined when overlaying charts. To display a tool on a chart, enter its name in the Symbol field.
Version for MT4 https://www.mql5.com/en/market/product/33063
FREE
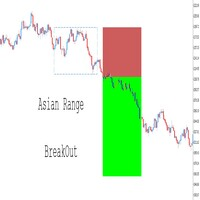
Fully Customizable – Adapt the indicator to your personal trading style by modifying parameters such as range time, colors, line styles, and risk-reward settings. Trade Levels Visualization – Automatically draws entry price, stop loss (SL), and take profit (TP) levels based on breakout conditions. Seamless Integration with Expert Advisors (EAs) – Take full control of your automated strategies by adding extra confirmations such as RSI, Moving Averages, Break of Structure (BOS), and more. Yo
FREE

SummarySignalLine is an intelligent multi-indicator for MetaTrader 5 that combines signals from five classical technical indicators into a single smoothed signal line. The indicator visualizes overall market sentiment in a simple, intuitive format with color coding. Key Features Composite Analysis — combines MA, RSI, Bollinger Bands, Stochastic, and ATR Smoothed Signal — reduces market noise with configurable smoothing Visual Clarity — color gradient from green (bullish) to red (bearish)
FREE

ADR, AWR & AMR Indicator: Comprehensive Trading Guide Try "Average Daily Range Scalper":
https://www.mql5.com/en/market/product/154469 Core Concepts ADR (Average Daily Range) Definition : The average distance between daily high and low prices over a specified lookback period (typically 14-20 days) Purpose : Measures daily volatility expectations, identifies range-bound versus trending days, sets realistic intraday profit targets Key Insight : Markets tend to respect their average volatility - d
FREE
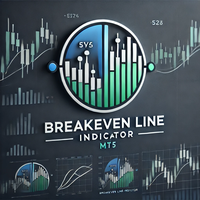
Simple indicator to show Breakeven line for all orders on attached chart pair. This indicator also comes with additional information such as Total Lot Size, Floating Drawdown in account's currency and Number of open positions and Difference from current price in Points. Do you use DCA (dollar cost average) or Hedging approach on your trading? Then this indicator you MUST have. Really useful, when you have multiple orders (hedging), this can help you quickly identify breakeven point without calc
FREE

Paranormal Insightment Use with : Ritz MA Ribbon Dynamics (check on my product) Ritz Paranormal Insightment is a precision-engineered analytical indicator that blends momentum intelligence and trend confirmation into a single visual system.
It merges the DeMarker oscillator with a dynamic Moving Average filter , detecting price exhaustion and directional shifts with remarkable clarity. The indicator translates subtle market imbalances into actionable visual and auditory signals, helping trad
FREE

Aurea Stella EA – Illuminate Your Trading Path Like the guiding stars that lead sailors through uncharted waters, Aurea Stella EA empowers you to navigate the unpredictable seas of the financial markets. Craft Your Own Constellation of Strategies: Endless Combinations – Weave together Bollinger Bands, Stochastic, RSI, MACD, Envelopes, and Donchian Channels to create your unique trading patterns.
Precision Control – Adjust stop loss, take profit, trailing stops, and choose whether to reverse
FREE

Description. This product was created based on low investment EA,
EA "OPHEX" is an advanced system that exploits GOLD XAUUSD Only. I uses both Scalping and Hedging Strategy. Once the Scalping hits SL it converts the position into Hedging and recovers the loss.EA gives upto 10% return every month with low risk. We can increase initial lot size for more return while account grows.
Advantages. Get upto 10% Returns every month with very low risk; Much cheaper than similar alternatives; Operat
FREE

Chỉ báo Watermark là một công cụ trực quan thường được sử dụng để lưu trữ các ký hiệu giao dịch và khung thời gian. Các tính năng chính trên chỉ báo: Tạo nhãn dán ký hiệu giao dịch tạo nhãn dán khung thời gian giao dịch Cố định vị trí theo chart giá Chỉ báo không tác động đến các tín hiệu giao dịch của nhà đầu tư. Nếu có bất kỳ vấn đề vui lòng phản hồi lại để chúng tôi có thể cải thiện sản phẩm.
FREE
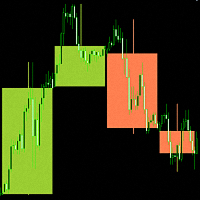
"Candlesticks MTF 5" is an information indicator that displays "Japanese Candlesticks" . The indicator analyzes and determines the opening and closing times of candles from higher time frames.
An algorithm has been developed for the "Candlesticks MTF 5" indicator that corrects the discrepancy between the opening and closing times of candles from higher time frames. For example, if the opening time of a candle on a weekly time frame is the 1st of the month, and on the smaller time frame this da
FREE

Want to AUTOMATE this strategy? We have released the fully automated Expert Advisor based on this logic. Check out Range Vector Fibo Logic EA here: https://www.mql5.com/en/market/product/158065
UPGRADE AVAILABLE: Tired of manual trading? I just released the Automated MTF Version with Mobile Alerts and Auto-Targets. Get the Pro Version here: https://www.mql5.com/en/market/product/159350
Range Vector Fibo Logic (Indicator) One Candle Strategy
Stop waking up at 3 AM to draw lines manually. Ran
FREE
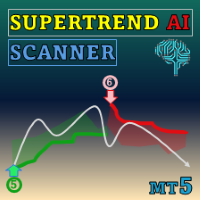
Special offer : ALL TOOLS , just $35 each! New tools will be $30 for the first week or the first 3 purchases ! Trading Tools Channel on MQL5 : Join my MQL5 channel to update the latest news from me Discover the power of AI with the SuperTrend AI Clustering MT5 with Scanner , a revolutionary trading tool for MetaTrader 5 (MT5). This indicator redefines market analysis by combining K-means clustering with the widely popular SuperTrend indicator, giving traders an edge in navigating t

This indicator is based on the strategy proposed by 'The Secret Mindset' YouTube channel, on the video "A Reliable Scalping Strategy I Discovered After 1 Month of Price Action Trading" A complete and detailed explication of the strategy and conditions to filter the signals are exposed on the video. * The YouTube channel creator is not related to this indicator development The signals should be combined with other indicators and be filtered by each trader judgment
Indicator
Bars that are inside
FREE

Effortlessly take control of your trading routine with the revolutionary Trades Time Manager. This potent tool automates order execution at designated times, transforming your trading approach. Craft personalized task lists for diverse trading actions, from buying to setting orders, all without manual intervention. Trades Time Manager Installation & Inputs Guide If you want to get notifications about the EA add our URL to MT4/MT5 terminal (see screenshot). MT4 Version https://www.mql5.com/en/m

RSI 14 Expert Advisor – FINAL v1.31 RSI 14 Expert Advisor – FINAL v1.31 is a fully automated trading system for MetaTrader 5 (MT5) based on the classic Relative Strength Index (RSI) reversal strategy.
This EA is designed to trade safely across Forex pairs, Gold (XAUUSD), and other CFDs , with built-in broker protection and risk management features. Trading Strategy Uses RSI period 14 as the main indicator BUY trades are opened when RSI reaches or falls below 30 (oversold condition) SELL t
FREE

The HiLo Ladder is a reinterpretation of the classic HiLo indicator , widely used by traders to identify trends and potential market reversals. Unlike the traditional version, the HiLo Ladder is displayed in a step-like format — the popular “stairs” — which makes reading price movements much clearer and more objective. Main advantages: Simplified visualization of bullish phases (green) and bearish phases (red). More intuitive analysis without losing the essence of the traditional HiLo. Quick
FREE

Moving Average RAINBOW Forex traders use moving averages for different reasons. Some use them as their primary analytical tool, while others simply use them as a confidence builder to back up their investment decisions. In this section, we'll present a few different types of strategies - incorporating them into your trading style is up to you! A technique used in technical analysis to identify changing trends. It is created by placing a large number of moving averages onto the same chart. When a
FREE

The indicator allows you to simplify the interpretation of signals produced by the classical ADX indicator.
The position of the hight bars of the histogram relative to zero and the histogram coloring indicate the direction of price movement determined by the intersection of DI+ / DI-.
The position of the hight bars of the histogram relative to zero and the color indicate the strength of the price movement.
The indicator is a logical continuation of the series of indicators using this classica
FREE

Unlock powerful breakout opportunities
The 123 Pattern is one of the most popular, powerful and flexible chart patterns. The pattern is made up of three price points: a bottom, a peak or valley, and a Fibonacci retracement between 38.2% and 71.8%. A pattern is considered valid when the price breaks beyond the last peak or valley, moment at which the indicator plots an arrow, rises an alert, and the trade can be placed. [ Installation Guide | Update Guide | Troubleshooting | FAQ | All Products ]

Unlock market continuations with the accurate pennants indicator
This indicator finds pennants , which are continuation patterns identified by converging trendlines surrounding a price consolidation period. Trades are signaled using a breakout period alongside the formation breakout. [ Installation Guide | Update Guide | Troubleshooting | FAQ | All Products ] Easy to use Customizable colors and sizes It implements breakout signals It implements alerts of all kinds
Optimal Usage To see pennants
This utility EA closes any buy or sell order when it reaches the desired profit value, or when the stop gain is activated. Closes orders opened manually or by other robots. Very effective for protecting or guaranteeing gains in rapid price movements. It works on any period and any asset available on MT5.
Trailing Start: Example, if the price moves 70 pips in favor, it activates the stop gain. Traling Stop: or Traling Step: If the price moves by the amount defined above the Trailing Start it w
FREE

Check out my TRADE PLANNER MT5 – strongly recommended to anticipate account scenarios before risking any money. This is the moving average convergence divergence (MACD) indicator based on Heikin Ashi calculations. Here you find multi-colored histogram which corresponds to bull (green) / bear(red) trend. Dark and light colors describes weakness/strenght of price trend in time. Also you can switch calculations between normal and Heikin Ashi price type.
Note: Buffers numbers for iCustom: 0-MACD,
FREE

The indicator identifies divergence by analyzing the slopes of lines connecting price and MACD histogram peaks or troughs. Bullish Divergence (Convergence): Occurs when the lines connecting MACD troughs and corresponding price troughs have opposite slopes and are converging. Bearish Divergence: Occurs when the lines connecting MACD peaks and corresponding price peaks have opposite slopes and are diverging. When a divergence signal is detected, the indicator marks the chart with dots at the pric

Jackson trendline scanner it a powerful price action tool which draw accurate trendlines and alert a breakout signals . As we all know that trendlines it a most powerful tool in price action by providing us with different chart patterns. e.g. Bullish flag, Pennant, Wedges and more...It not easy to draw trend lines, Most successful traders use trendlines to predict the next move based on chart pattern and breakout. Drawing a wrong trendline it a common problem to everyone, wrong
FREE

MT5 Smart Dashboard is the ultimate tool for manual traders who want speed and automatic risk management. It transforms your chart into a professional trading station with a clean dark theme. Key Features: Fast Execution Panel: Open Buy and Sell trades instantly. Place Pending Orders (Limit & Stop) with one click. Adjust Lot Size and Price easily via buttons (+/-). ️ Automatic Risk Management: Auto Break-Even (BE): Moves your Stop Loss to the entry price automatically
FREE

Mahdad Candle Timer MT5 — Real‑Time Candle Countdown Mahdad Candle Timer is a lightweight and precise MetaTrader 5 indicator that displays the remaining time until the current candle closes, shown directly beside the latest bar. It is designed for traders who rely on accurate timing — whether scalping, day trading, or waiting for candle confirmation in swing setups. Key Features Accurate Countdown – Remaining time in HH:MM:SS (optional milliseconds) Dynamic Placement – Always aligned with th
FREE

Gold Master Indicator MT5 - Institutional Precision for XAUUSD The Gold Master Indicator is an advanced analysis tool specifically designed for the unique volatility of the Gold (XAUUSD) market. This indicator not only tracks the price but also identifies liquidity zones and institutional turning points where the probability of reversals is higher.
Unlike standard indicators, Gold Master uses a data smoothing algorithm to eliminate market noise, allowing traders to capture clean movements on t

The Arbitrage365 EA is a basic script for MetaTrader that implements a triangular arbitrage strategy. It identifies and exploits price discrepancies between EURUSD, GBPUSD, and EURGBP to profit from temporary market mispricing. This EA capitalizes on the law of one price by simultaneously buying and selling currency pairs. Its advantages include speed, accuracy, scalability, consistency, cost-effectiveness, contribution to market liquidity, and portfolio diversification. However, it's a basic E
FREE
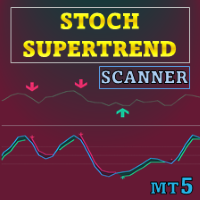
Special offer : ALL TOOLS , just $35 each! New tools will be $30 for the first week or the first 3 purchases ! Trading Tools Channel on MQL5 : Join my MQL5 channel to update the latest news from me This tool combines Stochastic RSI with SuperTrend logic to generate directional signals based on momentum shifts. It overlays a SuperTrend-style envelope on the Stochastic RSI and highlights turning points as momentum passes the overbought/oversold thresholds. See more MT5 version at: S

Xauusd Mr Gold: Excellence in Gold Algorithmic Trading (H1). Optimize your strategy in Xauusd (Gold) with Xauusd Mr. Gold , an Expert Advisor (EA) designed for superior profitability. This automated system combines deep analysis with precise execution on H1. Key Performance Data: Net Profit: $51,877.28 Profit Factor: 2.26 Maximum Drawdown: 1.52% Win Rate: 54.6% (1260 Trades) CAGR: 6.15% Xauusd Mr Gold is your tool for effective risk management and efficient capitalization of gold market oppor

EA Trendline Fusion is an innovative expert advisor that detects and trades diagonal trendlines. Designed for traders who use classic technical analysis, this system allows both automatic trading and visual signal alerts. For the best experience in the demo tester , follow the optimized setups shown in the images for each pair and timeframe. This EA starts at $45 and will increase with sales until it reaches $65.
This ea start at $45 and will increase with the sells to reach $65
Main Feature

Volume Weighted Average Price (VWAP) is a trading benchmark commonly used by Big Players that gives the average price a Symbol has traded throughout the day. It is based on both Volume and price. Additionally we put in this indicator the MVWAP (Moving Volume Weighted Average Price). For those who do not know the usage and the importance od this indicator I recommend a great article about this subject at Investopedia ( https://www.investopedia.com/articles/trading/11/trading-with-vwap-mvwap.asp
FREE

This utility displays economic news directly on the chart. It shows upcoming events, the time until their release, their importance, and sends notifications.
For:
For traders who follow economic news
For those who trade on the news
For traders who want to receive timely alerts
For users who need a simple and intuitive calendar right on the chart
Key Features News Panel - Shows the nearest economic event on the chart
Currency Filter - Displays only news for the currencies of your trading
FREE

Genaral: Not martingale, not a grid; Use on EURUSD Use on M5 EA was opimized only on 2020 year
Signals: There is a good rational algorithm. Work of 3 indicators: WRP, DeMarker, CCI (from 3 timeframes) (you can set a separate Timeframe for each indicator)
Stop Loss/Take Profit: There is a good money management system (there are several type for trailing stop loss); There is virtual levels of Stop Loss / Take Profit; There is smart lot (percent by risk) or fix lot
Important: EA can work on
FREE

Index Stalker EA (v1.x Series) Prop Firm Ready
Stay on the Rules
1% Risk Margin.
3% Daily Drawdown.
$10000 account.
Please Don't Hesitate to Contact me for any info you need. 1. High-Impact Product Description In the volatile currents of the NASDAQ 100, the greatest opportunities are found not through brute force, but through precision and patience. Introducing Index Stalker EA , the sophisticated trading tool engineered to silently track and execute high-probability setups with surgical accu
FREE

Break Even Line by MMD
The Break Even line is a useful indicator for people using strategies that allow simultaneous trades in both directions, such as the MMD methodology. This indicator is useful when playing statistical models and averaging positions in accumulation and distribution zones. The indicator draws levels by summing positions in three groups: positions included in BUY, positions included in SELL and all positions included.
Functionality description:
Show BUY BELine - shows or
FREE

Gold Swing Dragon is an Expert Advisor designed specifically for trading XAUUSD (Gold) using a swing-based approach.
The EA applies trend-following logic together with swing entry timing to identify retracement, breakout, and reversal opportunities.
It includes integrated trade management and risk control features suitable for different market conditions. Core Features Swing-Based Entry System : Detects potential swing setups and places trades at selected reversal or breakout zones. Trend Filter

For those who like trend the Force will be a very useful indicator. This is because it is based on the famouse ADX, which measure the strenght of a trend, but without its 3 confusing lines. Force has its very simple interpretation: if the histogram is above zero level the trend is up, otherwise it is down. You can use it to find divergences too, which is very profitable. Thanks to Andre Sens for the version 1.1 idea. If you have any doubt or suggestion, please, contact me. Enjoy!
MT4 version:
FREE

Product Name: HTF Candle Insight (EurUsd) - See the Big Picture Description: IMPORTANT: This version works EXCLUSIVELY on the EURUSD symbol. (It supports all broker prefixes/suffixes, e.g., pro.EURUSD, EURUSD.m, but will NOT work on Gold, Bitcoin, or other pairs). Experience the full power of "HTF Candle Insight" completely on EURUSD! Stop switching tabs constantly! This indicator allows you to visualize Higher Timeframe price action directly on your current trading chart. Whether you are a Sca
FREE

GoldMiner EA Pro MT5 - Advanced Neural Trend Trading for XAUUSD SUMMARY Unlock the power of automated gold trading with GoldMiner EA Pro, a high-precision Expert Advisor specifically designed for the unique volatility of XAUUSD. Unlike generic bots, GoldMiner uses a proprietary confluence engine that combines institutional trend following with real-time volume validation to capture high-probability moves.
WHY GOLDMINER EA PRO?
Precision Entry Engine: Uses multi-level analysis (EMA, RSI, MACD)
Stop guessing where the market will turn. Our advanced High/Low Indicator for MT5 is the ultimate tool for mastering price action and identifying key market structure. It automatically scans the chart to identify and clearly plot all critical swing highs and lows in real-time, helping you see the true story behind the candles. These crucial, non-repainting levels form the backbone of any successful trading strategy. Use them to instantly visualize the market's framework, allowing you to pinpoint
FREE

Keltner-Enhanced improves the accuracy and readability of Keltner Channels with many options for adjusting them and more five price calculations beyond the META default.
The Keltner-E indicator is a banded indicator similar to Bollinger Bands and Moving Average Envelopes. They consist of an upper envelope above a midline and a lower envelope below the midline.
The main occurrences to look out for when using Keltner Channels are breakouts above the Upper Envelope or below the Lower Envelope.
FREE

EA Doctor Bullish mt5 is an Expert Advisor designed specifically for trading gold, BTC, EURUSD. The operation is based on opening orders using the EMA/RSI indicator, thus the EA works according to the "Trend Follow" strategy, which means following the trend. For Expert Advisor need hedge type account Contact me immediately after the purchase if you prefer to get commission (Rebate) up to 40$/Lot! You can get a free copy of our Strong Support and Trend EA for unlimited account, please pm. me!
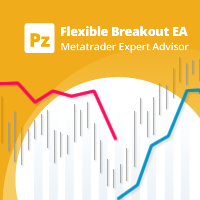
Trade donchian breakouts with complete freedom. This EA can trade any breakout period, any timeframe, with pending or market orders- as desired- and implements many other useful features for the exigent trader, like customizable trading sessions and week days, a martingale mode and inverse martingale mode. [ Installation Guide | Update Guide | Troubleshooting | FAQ | All Products ] Easy to use and supervise Customizable trading direction Customizable donchian breakout period It can trade using
FREE

Demand and supply zones Support and Resistance areas Show broken zones Show tested and untested zones Show weak zones Fractal factors Notifications when price reaches point of Interest with Push notifications and pop ups Customizable History Clickable Works on all Timeframes Works on all pairs.
Free for a while till further notice and changes. The demand and supply bot coming soon
FREE

The "Close All Order Tools" tool is designed to solve common problems faced by Forex traders when managing profitable orders—especially in highly volatile market conditions or when dealing with multiple open trades simultaneously. Problems This Tool Solves: Unable to close orders in time : “Just when it was rising nicely, the price suddenly dropped—I couldn’t close it in time, and the profit vanished.” Closing orders one-by-one is time-consuming : “With multiple orders open, closing each one ind
FREE

The utility places a grid of pending orders . You can select the number of orders in the grid, the step between orders, multiplier for the order size, SL and TP levels, magic number etc. If you use a profit bucket , please note that it applies to all orders on the current currency pair with the current magic. If you want to use several grids with independent profit buckets at the same time, run several copies of the utility and specify different magics in the settings. MT4 version of the utility
FREE
This expert is a pure volatility scalper working with market orders orders. Expert not use any indicator, only use prices action and volatility of price to generate signals. Using an algorithm to calculate the speed of price to generate the signals. There are three conditions for it to work: Tight spread Fast execution Stop level = 0 Please during the tests of this EA do not simultaneously use another EA in the same terminal because it affects the modification speed. Try expert on demo accoun
FREE
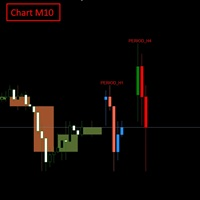
FULL PRODUCT DESCRIPTION Multi-Timeframe Candle Overlay Pro lets you view higher-timeframe candles directly on your current chart with absolute accuracy. When trading lower timeframes like M1–M15, understanding what the H1–H4 candles are forming is a major advantage: you avoid counter-trend entries, read market context faster, and trade with more confidence.
The indicator supports up to 2 higher timeframes, drawing full OHLC candles with precise positioning—no misalignment, no distortion. C
FREE

Signal222 Apex Command – Ultimate Multi-Currency Dashboard & Auto-Trader Short Description A high-performance command center for MetaTrader 5 that scans 8 assets simultaneously, providing real-time risk/gain calculations, one-click manual execution, and optional fully automated trading. Description Signal222 Apex Command is more than just an indicator; it is a professional-grade trade management utility designed for traders who handle multiple currency pairs. In the fast-moving 2026 markets, spe
FREE

Elevate Your Analysis with the Weis Wave Box ! If you seek precision and clarity in your trading , the Weis Wave Box is the perfect tool. This advanced volume wave indicator provides clear visualization of the effort vs. result dynamics in the market — essential for traders focused on volume and flow reading. Key Features: Customizable Volume Waves – adjust in ticks to fit your strategy.
Adjustable History – analyze specific periods with more accuracy.
Real Volume vs Ticks – unders
The MetaTrader Market is a simple and convenient site where developers can sell their trading applications.
We will help you post your product and explain you how to prepare your product description for the Market. All applications on the Market are encryption-protected and can only be run on a buyer's computer. Illegal copying is impossible.
You are missing trading opportunities:
- Free trading apps
- Over 8,000 signals for copying
- Economic news for exploring financial markets
Registration
Log in
If you do not have an account, please register
Allow the use of cookies to log in to the MQL5.com website.
Please enable the necessary setting in your browser, otherwise you will not be able to log in.