Watch the Market tutorial videos on YouTube
How to buy а trading robot or an indicator
Run your EA on
virtual hosting
virtual hosting
Test аn indicator/trading robot before buying
Want to earn in the Market?
How to present a product for a sell-through
Expert Advisors and Indicators for MetaTrader 5 - 39

Idea extracted from the books by Anna Coulling and Gavin Holmes using Volume and Spread Analysis (VSA) techniques coupled with Al Brooks' expertise with Price Action these candles are magical, identify the exact moment
of the performance of the big players are acting in the market represented by the colors:
1) Red Candles we have an Ultra High activity,
2) Candles Orange we have a Very High Activity
3) Candles Yellow we have one High Activity
4) White Candles represent normal activity in
FREE

Read more about my products Gap Cather - is a fully automated trading algorithm based on the GAP (price gap) trading strategy. This phenomenon does not occur often, but on some currency pairs, such as AUDNZD, it happens more often than others. The strategy is based on the GAP pullback pattern.
Recommendations:
AUDNZD TF M1 leverage 1:100 or higher minimum deposit 10 USD
Parameters:
MinDistancePoints - minimum height of GAP PercentProfit - percentage of profit relative to GAP level
FREE
This EA has no stop loss. All risks are at your discretion.
CHIQUITA MT5 EA is a fully automatic Expert Advisor for Scalping Trading on XAUUSD timeframe M1. The basic strategy starts with Market order in Trend Following, so this EA Follow the Trend . M1 Trend…. very very fast. MT4 version Recommendations The Expert is programmed to work on XAUUSD M1, but you can use all others timeframes with the appropriate settings. An ECN broker is always recommended A low latency VPS is alwa
FREE

This indicator was created based on posts from forex factory thread titled There is no Magic Moving Average - You need only one - by @andose2 a.k.a Andrei Florin. If you want to know about how to use this trading strategy please go and read https://www.forexfactory.com/thread/691864-there-is-no-magic-moving-average-you.
Note: Below are extracts some of the posts .
Estabilish a trend, based on Market Cycles, then go only long in the Markup Phase and only short in the Decline phase , st
FREE

Aether Algo: The Smart Scalper for EURUSD H1 Aether Algo is an intelligent automated trading system meticulously crafted for the EURUSD H1 chart. Designed to capitalize on market momentum and volatility, this Expert Advisor (EA) leverages a sophisticated combination of multiple indicators to identify high-probability entry and exit points.
Key Features Advanced Multi-Indicator Strategy: Aether Algo doesn't rely on just one signal. It uses a robust strategy that analyzes data from Heiken Ashi,

Introduction and Description Pythor is an Expert Advisor designed to operate in the Forex market, specifically as a scalping robot. Forex scalping is a day trading style used by F OREX traders that involves buying or selling currency pairs with only a brief holding time in an attempt to make a series of quick profits. While scalping attempts to capture small gains, such as 5 to 20 pips per trade, the profit on these trades can be magnified by increasing the position size. The Pythor EA u
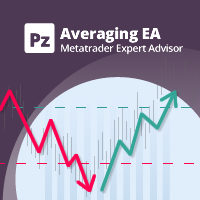
Profit even when too early: the perfect robot for position trades This EA turns your losing trades into winners using averaging. Once your initial trade moves into negative territory, the recovery mechanism will kick in and place consecutive market orders in the same direction at fixed price intervals, all of which will be closed with a combined profit or approximately breakeven. This mechanism is compatible with NFA/FIFO rules and accepted by US Brokers. [ User Guide | Installation Guide | Upda

Prism Winner EA - Multi-Strategy Expert Advisor Prism Winner EA combines four proven trading strategies with flexible execution modes. Trade single positions with stop losses or use advanced grid strategies. The system includes comprehensive risk management and professional filtering. Key Features Four Trading Strategies RSI Mean Reversion: High-precision trades based on overbought/oversold conditions. Bollinger Bands Classic: Statistical captures of price extremes. Support/Resistance Bounc
FREE

The WallStreet Scavenger: Smart Trading Automation Elevate your trading with The WallStreet Scavenger , an expertly crafted Expert Advisor (EA) designed to seize market opportunities with precision and control. This EA harnesses a sophisticated, time-tested strategy to deliver consistent results, blending seamless automation with robust risk management for traders of all levels. Key Features: Intelligent Trade Entries: Uses a proprietary system to identify prime trading moments, ensuring entrie
FREE

Elevate Your Trading with Shift the Frame Are you ready to take control of the market? The Shift the Frame EA offers cutting-edge tools to help you navigate the markets with precision, combining flexibility, advanced features, and security. Whether you’re aiming for steady growth or fast recovery, this EA is designed for both. How to Run EA: [Link Here] Latest news:
[Link Here]
Core Features: News Filter: Stay safe by avoiding high-impact events. Shift the Frame automatically pauses trading d

The DE_30_803015187_S_Ke_CF_SQX is an algorithmic trading strategy for MetaTrader, tested on DAX using the M30 timeframe from December 7, 2017, to June 2, 2023. There is no need to set up parameters, all settings are already optimized and fine-tuned.
Recommended broker RoboForex because of EET timezone.
You can find the strategy source code for StrategyQuant at the link: https://quantmonitor.net/dax-keltner-channel-breaker/
Key details are:
MagicNumber: 803015187 Main Chart: Current symb
FREE
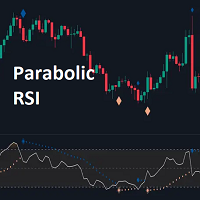
The Parabolic RSI indicator applies the Parabolic SAR directly to the Relative Strength Index (RSI) . This combination helps traders identify trend shifts and potential reversal points within the RSI framework. The indicator provides both regular and strong signals based on whether the Parabolic SAR crosses above or below key RSI thresholds.
KEY FEATURES
Parabolic SAR Applied to RSI – Tracks momentum shifts within the RSI indicator.
Dynamic SAR Dots – Plots SAR levels
** All Symbols x All Timeframes scan just by pressing scanner button ** ***Contact me to send you instruction and add you in "RSI scanner group" for sharing or seeing experiences with other users. Introduction RSI divergence is a main technique used to determine trend reversing when it’s time to sell or buy because prices are likely to drop or pick in the charts. The RSI Divergence indicator can help you locate the top and bottom of the market. This indicator finds Regular divergence for pullba

Mouse You can draw fibonaccis moving the mouse over the zigzag indicator Pin them You can click on fibonacci with this option and it will no longer be deleted unless you click on it again :) Precision The tuned fibonacci gets the precise point in lower timeframes Enjoy it You can ask me for add more features, so please comment and leave your ranting for me to be happy, thank you :)
FREE

With this easy to set up indicator you can display and set alerts for the following candlestick formations: Bull Breakout, Bear Breakout, Hammer, Pin, Bullish Engulfing, Bearish Engulfing. Input parameters: ShortArrowColor: The color of the Arrows, displaying a Bearish candle formation LongArrowColor: The color of the Arrows displaying a Bullish candle formation BullishEngulfing: Disabled/Enabled/EnabledwithAlert BearishEngulfing: Disabled/Enabled/EnabledwithAlert Pin: Disabled/Enabled/Enabledw
FREE

Description This technical indicator is designed to automate the analysis of market structure based on price action concepts. It identifies and labels key structural points, including Higher Highs (HH), Lower Lows (LL), Lower Highs (LH), and Higher Lows (HL), to assist traders in visualizing market trends. The indicator uses a configurable "Swing Strength" logic, checking a user-defined number of bars to the left and right of a pivot to confirm its validity. It also identifies Break of Structure
FREE
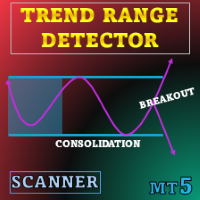
Special offer : ALL TOOLS , just $35 each! This tool will be FREE for 3 days, don't miss it! New tools will be $30 for the first week or the first 3 purchases ! Trading Tools Channel on MQL5 : Join my MQL5 channel to update the latest news from me Trend Range Detector was created for users who prefer a structured, data-driven view of price consolidation. Instead of relying on subjective chart reading, it applies clear volatility rules to outline where prices have paused and where

Capital Vault System is a professional technical analysis suite for MetaTrader 5 engineered to identify market structure and adaptively filter market volatility. Unlike static indicators, this system integrates three mathematical models— Maximum Entropy Spectral Analysis (MESA) , Fractal Dimension , and Harmonic Geometry —to distinguish between directional trends and non-linear consolidation ranges. It includes an embedded Risk Management Dashboard designed to assist traders in real-time positio

This MT5 indicator provides real-time updates of classic Renko charts. Renko charts focus on price movement, filtering out noise and highlighting trends. What are Renko candles? Renko charts display price movement using "bricks" of equal size, ignoring time. A new brick is drawn only when the price moves by a specified amount. They help visualize trends by removing time-based noise.
Parameters - BrickSizePoints (20): Renko brick size in points - HistoryDepthSec (3600): Historical data to ini
FREE

Hedge and Grid EA – Safe and Smart Trend-Following Trades candleforms.co Hedge and Grid EA determines market entries not just with instant trades but also through strategic hedge and grid systems. It offers robust risk management powered by technical analysis and dynamic trade execution. 1. Trend Detection: Strong Filters with MA, RSI, and ATR The robot identifies trend direction using a combination of: Two Moving Average (MA) crossovers RSI in overbought or oversold zones Comparison of t
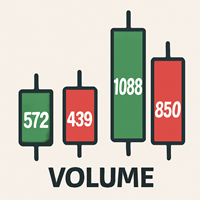
Volume Data on Candles Indicator for MetaTrader 5 Maximize your trading insights with the Volume Data on Candles indicator for MetaTrader 5. This powerful tool provides real-time volume data directly on each candle, allowing you to identify significant shifts in market activity. When the volume of a candle exceeds the average of the last 50 candles, it will be clearly highlighted , ensuring you don't miss out on potential high-volume movements. Key Features: Real-Time Volume Data : Displays volu
FREE

The indicator analyzes the price structure of fractals and determines possible reversal points in market dynamics. Fractals can be used as support and resistance levels
Advantages:
Works on all instruments and timeseries, Does not redraw its results, Customizable colors of indicator elements, Pairs perfectly with any trend strategy, Adjusting the strength of fractals.
MT4 version indicator -> HERE / AW Fractals EA MT5 -> HERE
Strategy:
Fractals are a combination of can
FREE

[ZhiBiDW Trend] is a simple, intuitive and effective indicator of trends and shocks. It is suitable for chart periods of more than 15 minutes and less than 4 hours, suitable for all market varieties.
Buy signal: A blue up arrow appears; the arrow will appear with a preset price for Stop Loss and Take Profit.
Sell signal: A red down arrow appears; the arrow will appear with a preset price for Stop Loss and Take Profit.
Parameter setting description:
[Send_Alert]: This is the alarm switch, set
FREE
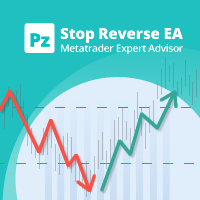
This EA recovers losing trades using a sequential and controlled martingale: it places consecutive trades with increasing lot sizes until the initial trade is recovered, plus a small profit. It offers a complete hassle-free trading framework, from managing initial trades to recovery. Please note that the EA implements a martingale, which means that it takes balance losses that are recovered later. [ User Guide | Installation Guide | Update Guide | Troubleshooting | FAQ | All Products ]
Feature
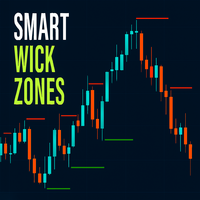
Smart Wick Zones indicator is a powerful tool designed to highlight hidden areas of price rejection and liquidity on your chart. By analyzing candle wicks (also called shadows or tails), the indicator automatically draws horizontal zones where strong buying or selling pressure has previously appeared. These wick zones often mark turning points in the market or areas where price reacts strongly, making them excellent references for support and resistance.
Instead of manually scanning candles for
FREE
The EA opens and closes new orders on time. It can be used to implement trading scenarios of any complexity by creating a list of tasks. There are two options for completing the task The task is executed on the specified date and time - it is executed once and is removed from the list. The task is executed with repetition on the specified day of the week and time - the task with repetitions is not removed from the list. Panel settings Symbol - select the symbol for the trade function. Time -
Introducing Maximus AI: Strength and Stability on EURUSD Are you tired of unpredictable scalping bots and unreliable strategies? Maximus AI was forged for a different purpose: to achieve consistent, intelligent trading on the stable and liquid EURUSD H1 timeframe . Named for its strength and robust logic, Maximus AI is an advanced Expert Advisor for MetaTrader 5 that combines a sophisticated internal neural network with the analytical power of the world's leading Large Language Models (LLMs). Th
This EA trades untested fractals using pending orders. It offers many trading behaviors and flexible position management settings, plus many useful features like customizable trading sessions and a martingale mode. [ Installation Guide | Update Guide | Troubleshooting | FAQ | All Products ] Easy to use and supervise It implements 4 different trading behaviors Customizable break-even, SL, TP and trailing-stop Works for ECN/Non-ECN brokers Works for 2-3-4-5 digit symbols Trading can be NFA/FIFO C
FREE

This EA is complete, multi-strategy , free , Brazilian and translated into English . If you prefer, download the EA in English:
https://www.mql5.com/en/market/product/59417 Light box robot , that is, you define the settings, which strategy you will use to operate.
More than 5,150 different input / output signals ;
More than 362.273148.218.750.000 possibilities combining up to 5 options of purchase (entry or exit) or sale (entry or exit), that's right, I checked this account!
Over 1,0
FREE

Unlock the Rhythm of the Markets: Automated Backtesting for Price Action Strategies Experience the power of our revolutionary price action concept backtesting product, capable of conducting years' worth of backtesting in a matter of seconds. Say goodbye to hundreds of hours of manual analysis and hello to instant insights. Our automated backtesting tool empowers traders to create and test strategies from scratch, optimize and refine their current strategies. No more manual constraints - propel
FREE

Stochastic indicator alerts when EA Available in comments , must have indicator installed buys stochastic main line is above signal line stochastic is below 30 rsi 5 is below 20 sell stochastic main line is below signal line stochastic is above 70 rsi 5 is above 80 ADD to chart Stochastic k 30 - d 9 - slowing 3, levels 30/70 rsi 5 lelels 20.80
Full alerts push, mobile , email ect All input settings variable feel free to contact for more information or alert sugestions
FREE

Necessary for traders: tools and indicators Waves automatically calculate indicators, channel trend trading Perfect trend-wave automatic calculation channel calculation , MT4 Perfect trend-wave automatic calculation channel calculation , MT5 Local Trading copying Easy And Fast Copy , MT4 Easy And Fast Copy , MT5 Local Trading copying For DEMO Easy And Fast Copy , MT4 DEMO Easy And Fast Copy , MT5 DEMO "Cooperative QQ:556024" "Cooperation wechat:556024" "Cooperative email:556024@qq.com" Strong
FREE

This is a custom indicator based on candlestick price action. It generates alerts for buy or sell signals on any trading instrument. There are explanatory materials available for signal validation, entry, and exit techniques. To learn more, search for Benjc Trade Advisor on YouTube for explanatory videos. The latest version includes trend and oscillator filters to enhance signal accuracy. Future updates will likely come with price increases. When a signal is generated, the system prompts immedi
FREE

Schaff Trend Cycle (STC) "CON ALERTAS"
El Indicador Schaff Trend Cycle (STC) es una herramienta técnica utilizada en el trading e inversión para identificar tendencias y generar señales de compra o venta. ¿Qué es el Schaff Trend Cycle? El STC fue desarrollado por Doug Schaff para mejorar las medias móviles incorporando análisis de ciclos. Su objetivo es identificar tendencias y cambios de tendencia midiendo la fuerza y velocidad de los cambios de precio. Es un oscilador que mide la velocidad
FREE

Only 2 copies left at $179. Next price 399$ After purchase, be sure to write to me in private messages, this is important for maintaining contact, as well as so that I can provide you with important information on setting up EA Live Monitoring
Genesis AI is a grid robot with an innovative mathematical algorithm that offers highly efficient Forex trading. Our robot analyzes the market and makes trading decisions based on an advanced mathematical model that allows you to use current market ineff

This indicator is designed to detect high probability reversal patterns: Double Tops/Bottoms with fake breakouts . This is the FREE version of the indicator: https://www.mql5.com/en/market/product/29957 The free version works only on EURUSD and GBPUSD! Double top and bottom patterns are chart patterns that occur when the trading instrument moves in a similar pattern to the letter "W" (double bottom) or "M" (double top). The patterns usually occur at the end of a trend and are used to signal tren
FREE

Dominator Gold Bot – Expert Advisor for XAUUSD (H1) Dominator Gold Bot is a fully automated trading system developed specifically for XAUUSD on the H1 timeframe .
The EA applies directional volatility analysis, session-based logic, and adaptive risk control to identify structured movement during high-liquidity periods.
It has been designed for stable long-term trading with controlled risk exposure. Important Notice The latest optimized set file is available in the Comments section.
Please downlo
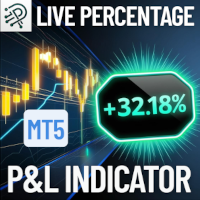
Quickly monitor your floating profit or loss as a percentage of your account balance live and always visible right on your chart! Key Features: Real-Time Calculation: Instantly calculates the combined floating profit or loss from all open trades as a percentage of your current account balance. Easy On-Chart Display: The result is conveniently shown as a label in the lower-right corner of your chart no distractions, always visible. Clear Color Coding: Green for profit, red for loss for immediate
FREE

Utazima 001 Indicator AI Professional Market Structure & Opening Range System STOP GUESSING. START TRADING WITH STRUCTURE. Utazima 001 Indicator AI is a next-generation Market Structure & Opening Range Intelligence System , built for traders who want clarity, precision, and consistency . This is not a repainting signal tool.
This is institutional-grade logic , simplified and automated for retail traders. Designed by Utazima MentorCreate , this indicator reveals the most important price zo
FREE

AGENT 47 Semi-Automatic Once launched, you'll never be able to let it go. This EA was designed to automate the mental gymnastics a trader performs throughout their trading day. This system is based on conceptual common sense and an enlightened vision of the market. This is not an EA like any other, but rather an open door to a new vision of the market. The market is ruthless and leaves no room for errors and emotions. Only iron discipline and a deep understanding of the market will make you a pr

TriTrendMA
TriTrendMA es un Asesor Experto sencillo y estable, diseñado para operar a favor de la tendencia mediante una estructura clara de tres capas de señal y una gestión de riesgo clásica y controlada.
El EA está orientado a ofrecer una lógica transparente y fácil de comprender, pensada para un uso conservador y educativo, sin recurrir a sistemas agresivos ni técnicas de alto riesgo.
---
Estructura de trading (3 capas)
TriTrendMA opera únicamente cuando las tres señales están alineada
FREE

Clyra
Special Launch Offer, Current price: 65. Price will increase to 102 after the first 5 copies are sold. 0 copies sold so far.
This isn’t just another expert advisor. It’s a system built for consistency, accuracy, and survival—even in the most unpredictable markets.
Need proper backtest results? Contact me and I’ll send you the correct settings file plus full guidance. Follow Market Updates: https://www.mql5.com/en/channels/babayeasnews User Guide: https://www.mql5.com/en/blogs/post/7622
Time saving and fast execution Whether you’re traveling or sleeping, always know that Telegram To MT5 performs the trades for you. In other words, Our Telegram MT5 Signal Trader will analyze the trading signals you receive on your selected Telegram channels and execute them to your Telegram to MT5 account. Reduce The Risk
Telegram To Mt5 defines the whole experience of copying signals from Telegram signal copier to MT5 platforms. Users not only can follow all instructions from the signal

Build your EA with Build EA, with it you can build your strategy with the available indicators and tools.
Build EA does not have any defined strategy, but with it you can use combinations of indicators and use them as signals or filters along with the available tools and build your strategy!
Indicators available: adx Alligator Bollinger Bands bear power Bull Power CCI crossing of means dx Envelope Stochastic fractal macd OBV Parabolic SAR return to mean Fibonacci retracement Rsi Standard Devi

Ichimoku Kijun Trader Ichimoku Kijun Trader es un Expert Advisor diseñado para operar tendencias limpias , utilizando únicamente el sistema Ichimoku Kinko Hyo, sin indicadores añadidos ni filtros artificiales. La lógica del EA es simple y disciplinada:
identificar una tendencia clara y entrar en el pullback , no en la persecución del precio. El Kijun-sen actúa como eje central de la operativa, funcionando como nivel dinámico de equilibrio desde el que el sistema busca incorporarse a la tendenci
FREE

PylonEA - Free Grid Trading System This is a free EA that contains only 2 strategies from the ThemisEA portfolio - both strategies trade EURUSD. Key Features: Each position has a stop loss Advanced grid system with dynamic position spacing Maximum positions per strategy: 18 positions (not infinite grid - controlled risk) Minimum recommended account size: $2000 USD Note: Less diversified than ThemisEA - trades only one currency pair, equity curve will be less smooth with more volatility Easy Inst
FREE

GridMaster ULTRA - Adaptive Artificial Intelligence The Most Advanced Grid EA on MT5 Market GridMaster ULTRA revolutionizes grid trading with Adaptive Artificial Intelligence that automatically adjusts to real-time market conditions. SHORT DESCRIPTION Intelligent grid Expert Advisor with adaptive AI, multi-dimensional market analysis, dynamic risk management and automatic parameter optimization. Advanced protection system and continuous adaptation for all market types. REVOLUTIONARY
FREE

Welcome to HiperCube Renko Candles Discount code for 25% off at Darwinex Zero: DWZ2328770MGM This indicator provide you a real info of market transform it to Renko Candle Style. Definition Renko charts are a type of financial chart that measures and plots price changes, using bricks (or bars) to represent price movements . Unlike traditional candlestick charts, Renko charts do not display time-based information, focusing solely on price fluctuations. Features: Indicator in separate windows
FREE
A 'Seconds Period' chart, offering enhanced precision for charting and analysis. Especially beneficial during volatile market conditions and intraday trading. This indicator addresses the limitations of MT5's predefined timeframes, allowing for finer granularity down to second intervals.
Since only one EA can run per chart, being an Indicator allows for the additional advantage of running an EA alongside the Seconds Timeframe Candles Indicator on the same chart. Compatible with any intraday tim
FREE
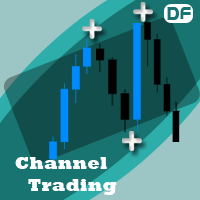
This Expert Advisor follows your channel lines that you draw. and when the price reaches these support and resistance trend lines, EA send open or close order automatically. You must draw two trend line with same color for EA to work, not equidistant channel line. and this color must be specified in ChannelColor parameter Strategies:
Inside Channel Strategy: If the price reaches bottom trend line, the EA will place a buy order. and when the price reaches the top trend point, EA send close order
FREE

MT4 Version : https://www.mql5.com/en/market/product/110557 MT5 Version : https://www.mql5.com/en/market/product/110558 Live Signal : https://www.mql5.com/en/signals/2047369
Introducing the Cutting-Edge "FAST SCALPER" Expert Advisor : Unleash the Power of Global Markets with Precision and Proficiency
In the dynamic realm of forex trading, staying ahead of the curve demands an unparalleled combination of intelligence and technology.
The "FAST SCALPER" Expert Advisor stands as the pinnacle of

UPDATED The Non-Repaint zones is a time base indicator that scans for possible reversal of the market for perfect entry. It read the history and draws the possible zone for our comfort. The indicator possesses four different zones that read the history of the market over 10,000 previous bars and predict the possible entry point. It rescans every market trend change to give us the possible zone, it is used for trading all types of markets and does not repaint. The indicator has the following inp
FREE

Description of the Harmonic Patterns + Fib Indicator
The Harmonic Patterns + Fib indicator is a technical analysis tool designed for MetaTrader 5 (MT5). It automatically detects and visualizes harmonic price patterns on financial charts, leveraging Fibonacci ratios to identify potential reversal points in markets such as forex, stocks, cryptocurrencies, and commodities. The indicator scans for classic harmonic formations like Butterfly, Bat, Crab, Shark, Gartley, and ABCD, drawing them with lin
FREE

Welcome to the future of algorithmic trading.
The Nascore Scalper EA is a precision-engineered, AI-inspired scalping robot built exclusively for trading NAS100 (US Tech 100 Index) . It analyzes smart money footprints, breakout zones, and high-timeframe bias to capture high-probability scalping entries. Key Features: Optimized for NAS100 (US100) – Fast-moving Nasdaq-based index trading Smart Money Concepts – Integrates structure, breakout logic, and bias Minimal Margin Usage – Ideal for traders
FREE

Venom Crown – Rule-Based Expert Advisor Venom Crown is a rule-based Expert Advisor designed for GBPUSD , operating on the H1 timeframe using multiple confluence conditions with controlled daily execution.
The system applies configurable time filters, risk-management rules, and an optional news-event filter, all adjustable through the input parameters.
Trades are executed only when all internal conditions are satisfied, supporting structured and disciplined trading. Live Signal : https://www.mq

BitBot – BTCUSD Trading Robot for H1 Chart BitBot is a smart and adaptive trading robot designed specifically for Bitcoin (BTCUSD) on the H1 timeframe. Built entirely on pure technical analysis, BitBot emphasizes high-precision decision-making through volume-based strategies — a critical factor in the volatile world of crypto trading. The core of BitBot's logic revolves around real-time trading volume analysis for both Bitcoin and major altcoins. By continuously monitoring volume changes across

ATR Smart Levels – Clarity on where the market can realistically move Many traders lose not because of their strategy, but because they enter at bad levels: too early, in the middle of the range, or without a proper risk-reward structure. ATR Smart Levels solves this problem with a single indicator and three simple buttons. The indicator automatically draws three ATR-based target zones (TP1, TP2, TP3) above and below the current price. You immediately see whether a trade makes sense and whether
FREE

"NagaRecoil" EA: A highly durable and resilient trading solution for long-term results
The long-awaited EA "NagaRecoil" has finally been released! This EA utilizes two high-performance indicators, RSI and RFTL, to skillfully capture market trend fluctuations and determine the optimal entry point. RSI sensitively detects market overheating, and RFTL predicts future price movements. This combination provides signals for buying and selling. Furthermore, as its name suggests, "NagaRecoil" develops
FREE

Greetings friends, this is the updated version for the MT5 terminal. This is my new product based on my first indicator, an enhanced version with streamlined settings, optimized specifically for Gold. The indicator supports sending notifications. Usage Recommendations: Instrument - XAUUSD (primary, optimized for this asset) Instrument - XAUEUR (secondary; it was not optimized for this asset, but I am pleased with the results) Timeframe - H4. Attach the indicator to your chart and leave it

The MelBar EuroSwiss 1.85x 2Y Expert Advisor is a specific purpose profit-scalping tool which success depends on your understanding of its underlying strategy and your ability to configure it. Backtest results using historical data from 6 February 2018 15:00 to 19 February 2020 00:00 for the EUR/CHF (M30) currency pair proves very highly profitable.
Initial Deposit : US$500 Investment returns : US$1426.20 Net Profit : US$926.20 ROI : 185.24% Annualized ROI : 67.16% Investment Length : 2 yea
FREE

Displays a digital clock or a countdown (until new bar) in the chart in realtime.
Benefits: Current time always in sight for market open/close, economic data, etc. Displays accurate time (server/broker time) Keep an eye on how much time is left until a new bar starts (countdown) Clearly visible (set color, size, font, position) Always runs/refreshes every second even without new price tick Hint: To display the most accurate time, use the server (broker) clock setting combined with the time (hou
FREE

Pip Value Calculator - Instant Risk Assessment on Your Chart This powerful and lightweight utility instantly calculates the precise monetary value for any pip movement, displaying it directly on your chart so you can assess risk and potential profit at a glance. At its core, the indicator's sophisticated calculation engine runs silently with every price tick, ensuring the information you see is always up-to-date. It automatically detects the instrument you are trading—whether it's a Forex pair,
FREE

Trade Hunter MT5 - Buy and Sell Indicator
Unlock precise trading opportunities with Trade Hunter MT5! This powerful indicator identifies potential buy and sell signals by analyzing price movements over a customizable period. Blue arrows mark buy opportunities below key lows, while red arrows highlight sell signals above critical highs. With adjustable parameters like bar range, percentage offset, and alert settings, Trade Hunter adapts to your strategy. Optional alerts and notifications ensur
FREE

XAUUSD Heat Map Scalping Indicator Perfect for 1M, 3M, 5M, 15M Scalping on Gold (XAUUSD) Take your scalping to the next level with this exclusive Heat Map indicator , designed and optimized specifically for XAUUSD . This tool is a powerful visual assistant that helps you instantly identify market strength, pressure zones, and potential entry points in real time. Key Features: Optimized for Fast Scalping : Works best on 1-minute, 3-minute, 5-minute, and 15-minute timeframes Specializ
First Scalper is an Expert Advisor based on Scalping, Using the best and safest scalping EA on market. Large number of inputs and settings are tested and optimized and embedded in the program thus inputs are limited and very simple. Using EA doesn't need any professional information or Forex Trading Knowledge.
First Scalper can trade on all symbols and all time frames, using a special and unique strategy developed by the author.
Using EA :
General Options Trade Type : Long/Short/Both Stop

AllTF Trend Bias Indicator is a professional tool to visualize market bias, designed mainly for 1-minute charts. The colors are not trading signals by themselves, but a visual compass to guide your decision-making: HiddenEdge release model
All HiddenEdge tools follow the same structured release plan.
Each indicator is released initially for free to collect feedback.
After reaching a stable user base, it moves to a fixed paid tier.
Some utilities remain permanently free as part of the Hidde
FREE

Multifunctional trade dashboard to simplify manual trading. Deals and orders visualization, p&l calculations, one click trading, orders modification, breakeven, trailing stop, partial stop loss, partial take profit, closing by time, equity stop loss and take profit - all of that is possible in one or a few clicks, using hotkeys or with simple mouse drag of the levels on the chart. User friendly interface allows you to test necessary scenarios and move to the use the application almost immediatel

Auto Stop Loss (MT5 Manager) is a robust utility designed to take the stress out of trade management. Whether you are a scalper or a swing trader, this EA automatically applies Stop Loss and Take Profit levels to your trades, secures profits with Break-Even, and maximizes gains with an intelligent Trailing Stop. This manager works with all trading instruments and allows you to manage specific symbols or multiple pairs from a single chart .
Key Features:
- Automatic SL & TP: Instantly appl

Description
Spread History is a simple yet essential indicator that displays the historical spread, candle by candle, in a separate window alongside its moving average. With a real‑time line and overlaid text on the main chart, you can easily monitor the spread applied by your broker at every market phase. Purpose Show the actual spread provided by the broker for each candle Calculate and display the spread’s moving average over a configurable period Overlay the current spread value and its av
FREE
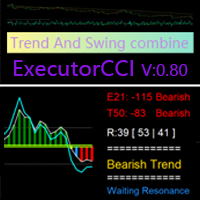
Based on the CCI Trend-Following Principle, Improved to Identify Trend Reversals
This indicator is designed to confirm trends after identifying them using the ( Executor Trend Indicator ) indicator, making it a tool for both trend confirmation and reversal detection. Features Green and Red Histogram: Represents the development of bullish (green) or bearish (red) trends in the current timeframe. Blue Line and Green Histogram (Bullish Confirmation): When the blue line rises above +10
FREE
Learn how to purchase a trading robot from the MetaTrader Market, the store of application for the MetaTrader platform.
The MQL5.community Payment System supports transactions via PayPal, bank cards and popular payment systems. We strongly recommend that you test the trading robot before buying, for a better customer experience.
You are missing trading opportunities:
- Free trading apps
- Over 8,000 signals for copying
- Economic news for exploring financial markets
Registration
Log in
If you do not have an account, please register
Allow the use of cookies to log in to the MQL5.com website.
Please enable the necessary setting in your browser, otherwise you will not be able to log in.